Aerosols are tiny airborne particles that come from forest fires, deserts, volcanoes, breaking ocean waves, and urban and industrial pollution. Aerosols play an important role in the Earth system, directly influencing global climate and human health. Five years of atmospheric aerosol data are available as global aerosol maps from NASA’s Multi-angle Imaging SpectroRadiometer (MISR) on the Terra satellite. This five-year data sequence has special significance to the MISR Mission; the team has released the data this week to mark the fifth anniversary since MISR began taking science data, on February 24, 2000.
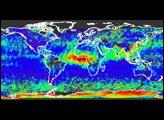
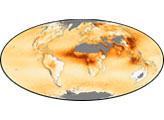
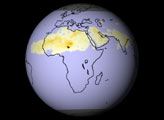
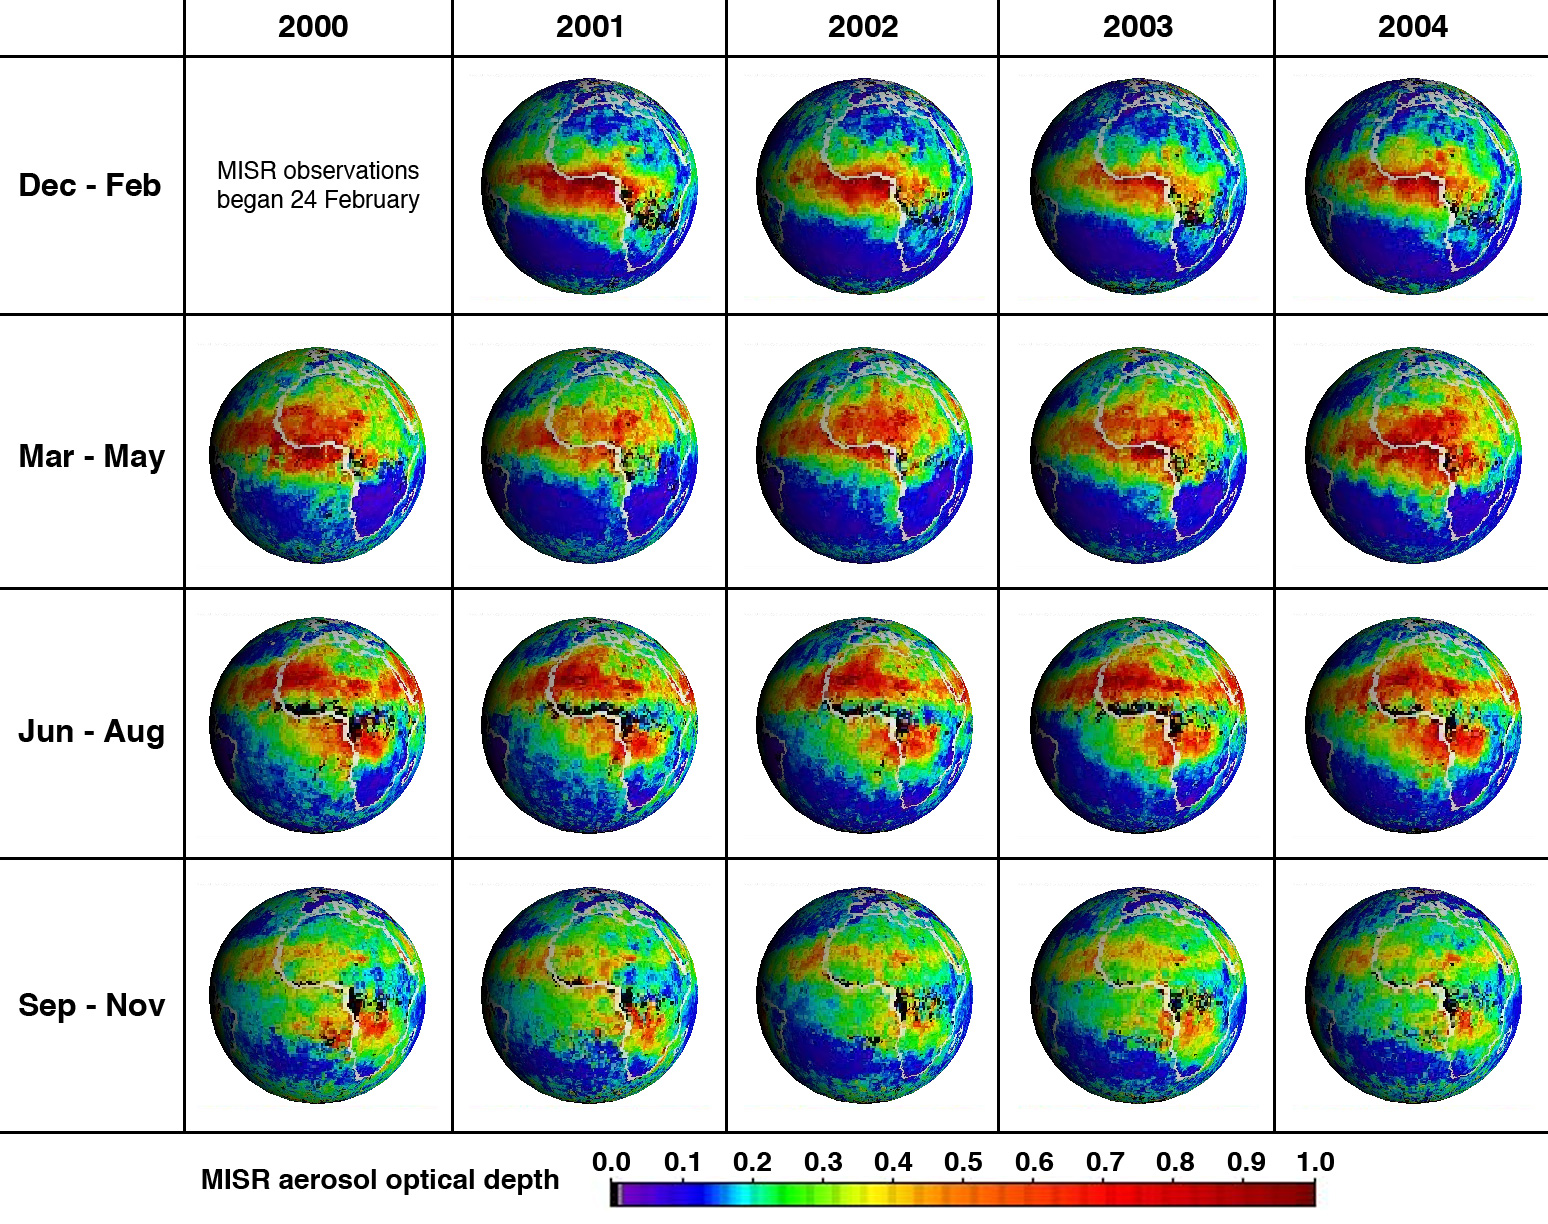
These 19 globes show how the location and amount of atmospheric aerosols across Africa (white outline) and the Atlantic Ocean changed from season to season between March 2000 and November 2004. MISR measures the total amount of aerosols in a column of atmosphere between the sensor and the ground; the measurements, called “optical depth,” are based on how well light can pass through the column. The color scale indicates the range of optical depths, from relatively clear skies in blue and purple to haziest skies in orange and red. An optical depth of 1.0 means that about 37 percent of the light at the top of the atmosphere makes it though to the ground. An optical depth of 0.7 means about 50 percent of the light is making it to the ground. The remainder is being absorbed, reflected, or scattered by aerosols. Black pixels indicate places where persistent clouds prevented good observations.
Seasonal patterns are remarkably similar from year to year. Between December and February, skies over northern Africa are relatively clear, while high aerosol levels are found across the Central and West African wet-tropical regions and the Gulf of Guinea. From March through May, very thick aerosols extend northwards across the deserts of Mali, Niger and Chad, while in southern Africa, this is the least hazy time of year. During June through August, there is persistent cloud cover along the Central and West African wet-tropical coasts (black pixels in the aerosol maps), and very thick aerosol concentrations extend both north-northwest over Mauritania, Western Sahara and Algeria, and south over the Democratic Republic of the Congo. Between September and November thick aerosol cover is limited to portions of southern Africa and the Congo, mostly related to seasonal agricultural burning, but moderately high aerosol optical thickness (green and yellow pixels) extends a bit farther west over the Atlantic.
To assess the human-health impact of chronic aerosol exposure, an accurate record of aerosol properties for ten or more years is needed. Ground-based networks that accurately measure column aerosol amount and properties are sparse; satellite instruments can now complement these data, providing aerosol optical depth measurements over long periods and large areas. When analyzed along with independent information about aerosol vertical distribution, satellite data can help determine ground-level pollution concentrations. The results are being used to improve air quality models and for regional health studies. Global summaries of aerosol optical thickness from the Multi-angle Imaging SpectroRadiometer (MISR) instrument are available from the NASA Langley Atmospheric Sciences Data Center’s MISR Level 3 Imagery Website.NASA image courtesy GSFC/LaRC/JPL, MISR Team