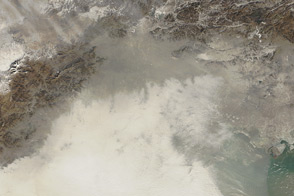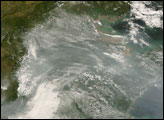

With rapid urban growth, economic development, and a significant increase in vehicles in the past three decades, Beijing, China, suffers from severe air pollution. The air quality in Beijing is determined by its geography, weather conditions, and anthropogenic (human-generated) emissions. This series of images made from data collected by the Multi-Angle Imaging SpectroRadiometer (MISR) on NASA’s Terra satellite shows how changes in emissions and weather conditions during the 2008 Olympic Games affected air pollution over East China, including Beijing.
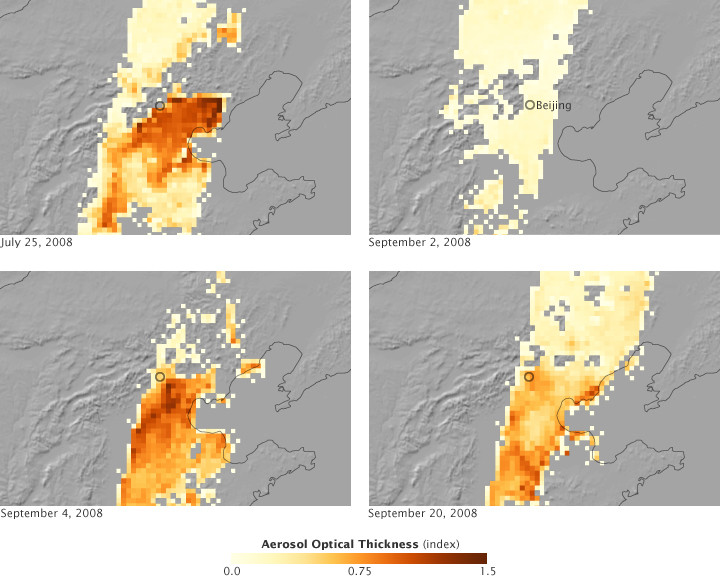
During the Beijing Olympic and Paralympic Games (August 8 to September 17, 2008), the government strictly controlled emissions: traffic volume was reduced by 40 to 50 percent, and regional power generation and consumption were throttled back. The dramatic, rapid drop in air pollution was documented by MISR, which measures the density of particles in the atmosphere (aerosols). In these images, high aerosol concentrations (poor air quality) are brown, while low concentrations (good air quality) are cream.
During the Olympics, air quality in Beijing improved, but it still fluctuated because weather conditions and geography allow air pollution to either disperse or to become concentrated. Beijing sits at the northern edge of the North China Plain, which is bounded on the north and west by mountain ranges. Winds blowing south or east push pollutants out of the city, while north or west-blowing winds cause pollutants to pile up over the city along the mountain front.
Pollution controls went into effect on July 20, but Beijing experienced heavy particle pollution on July 25 (top left). MISR recorded high aerosol concentrations (dark brown) in the entire Beijing metropolitan area. Daily fine particle pollution (PM-2.5) concentrations in downtown Beijing reached 140 micrograms per cubic meter. (The Clean Air Act limit in the United States is 35 micrograms per cubic meter.)
Emissions combined with weather conditions led to highly polluted air on July 25. Temperatures were high in the morning, about 27 degrees Celsius (81 degrees Fahrenheit), creating conditions in which smog could form. Light winds from the east and southeast trapped the polluted air mass over the region.
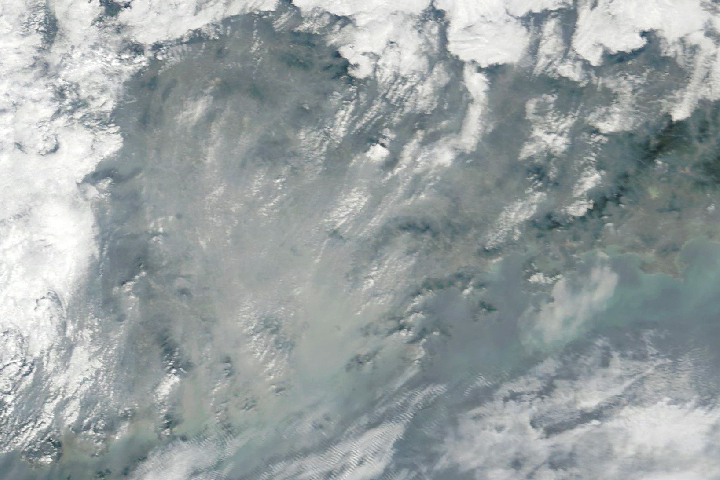
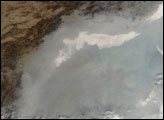
Clouds covered Beijing when MISR observed the city during the Olympic Games, so the instrument was unable to record pollution levels during the games. By September 2 (upper right), strict air pollution control measures had been fully implemented for three weeks. Cooler temperatures (23 C, or 73 F), lower relative humidity (about 60%), and higher wind speed (about 8 meters/second, or 18 miles per hour) from the north in the morning worked with the significantly lower emissions to create a very clean air day. MISR recorded very low aerosol concentrations over the entire Beijing area. On the ground, the daily PM 2.5 concentration was 19 micrograms per cubic meter.
On September 4, the wind blew from the south at approximately 7 meters/second (16 miles per hour) in the morning. The air pollution control measures were still in effect, but regional pollution transport began to influence the air quality in Beijing. The MISR aerosol concentrations over Beijing were still low, as shown by the lighter tones of brown in the lower left image, and daily PM 2.5 concentrations on the ground were also relatively low (35 micrograms per cubic meter). But aerosol concentrations over the heavily industrialized regions south of Beijing were climbing. Winds would carry this pollution into the city, affecting Beijing’s air quality on September 5 and 6.
By September 20, anthropogenic emissions began to return to pre-Olympic levels, although some air pollution control measures remained in effect. The combined effects of cooler air temperature (21 C, or 70 F), relatively high winds (8 meters per second, or 18 miles per hour) from the north, and increased emissions created a typical day with moderate particle pollution. MISR observed moderated aerosol concentrations over Beijing, and daily PM2.5 concentrations at the monitoring site were 70 micrograms per cubic meter.
NASA images created by Jesse Allen, using data provided courtesy of the MISR Science Team. Caption by Yang Liu, Emory University, and Holli Riebeek.