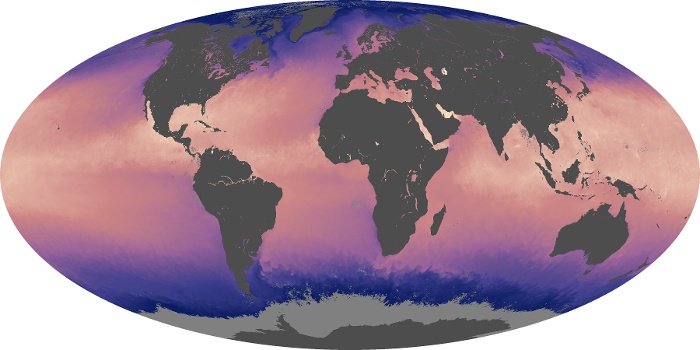
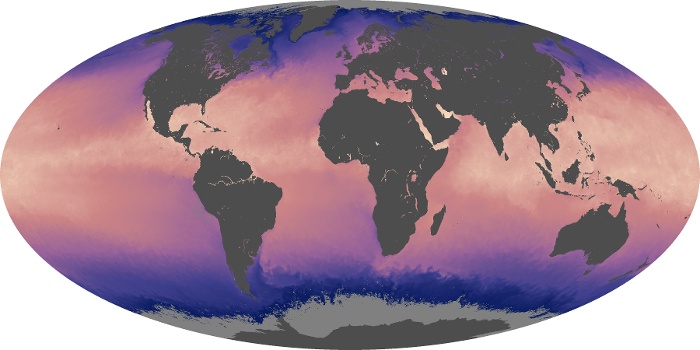
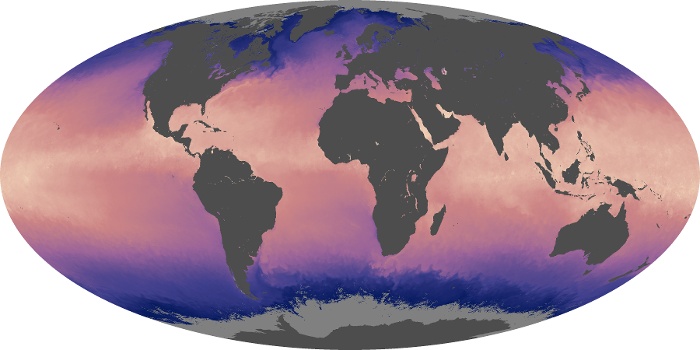
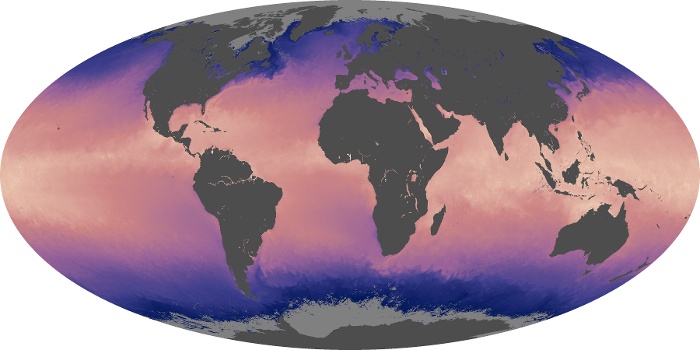
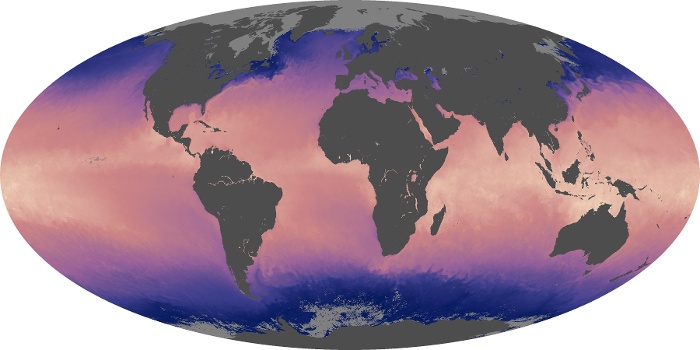
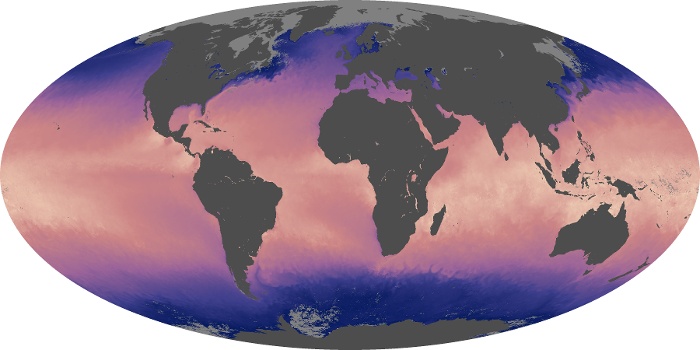
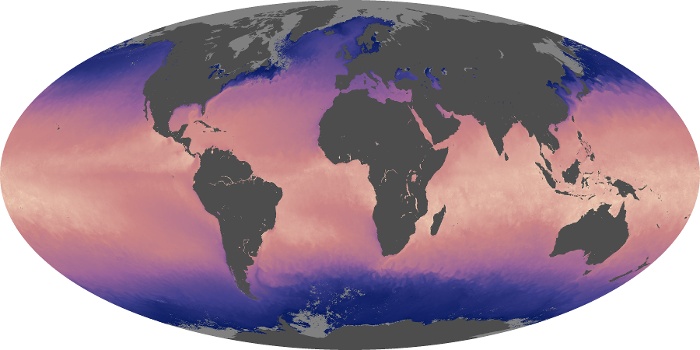
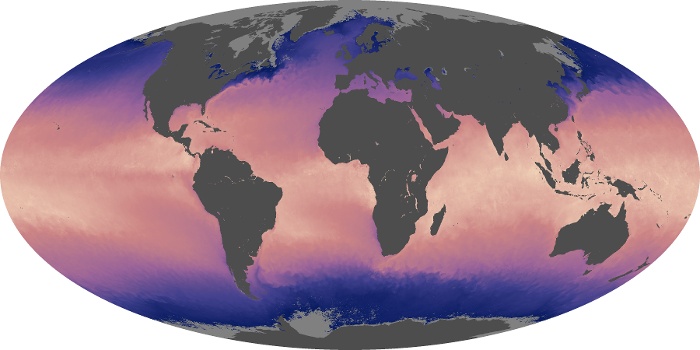

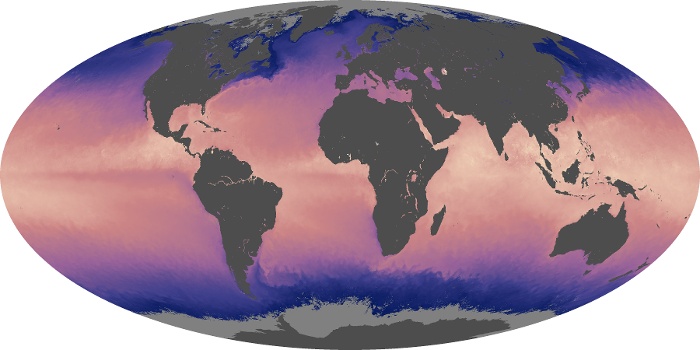

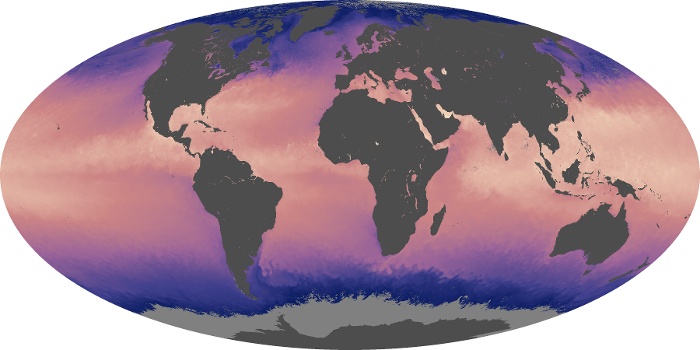
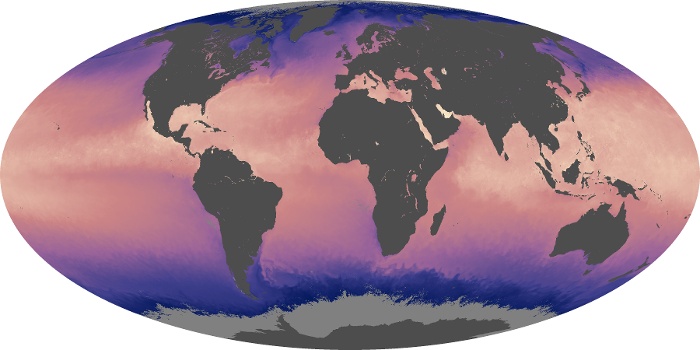
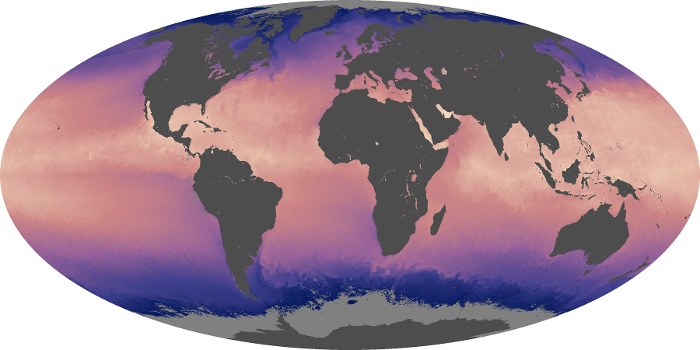
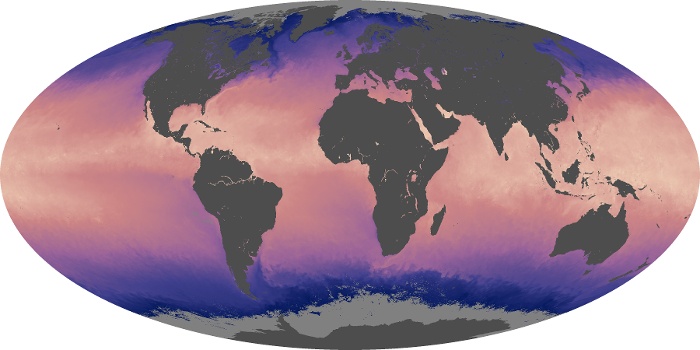

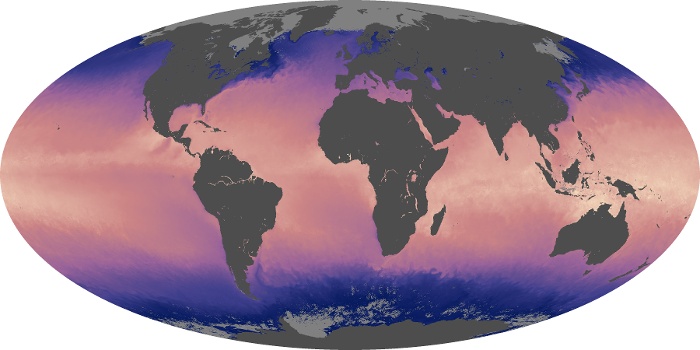
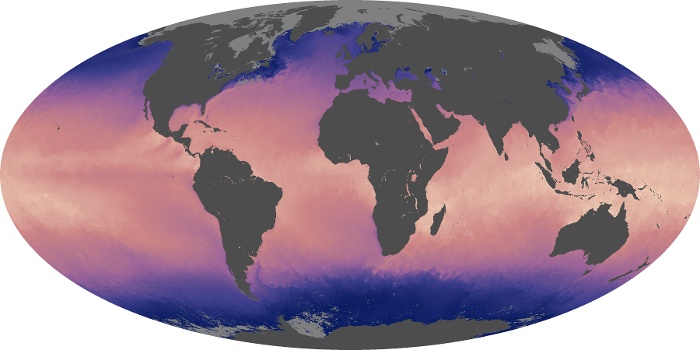

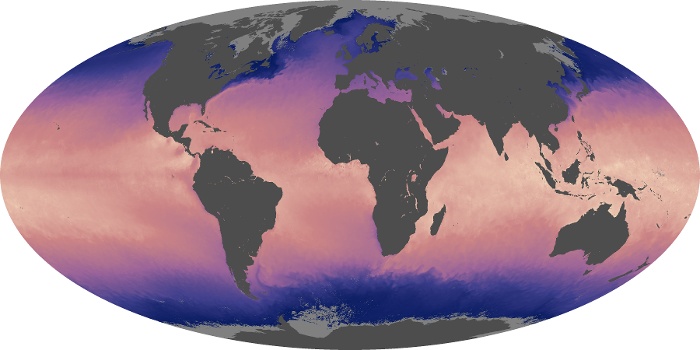

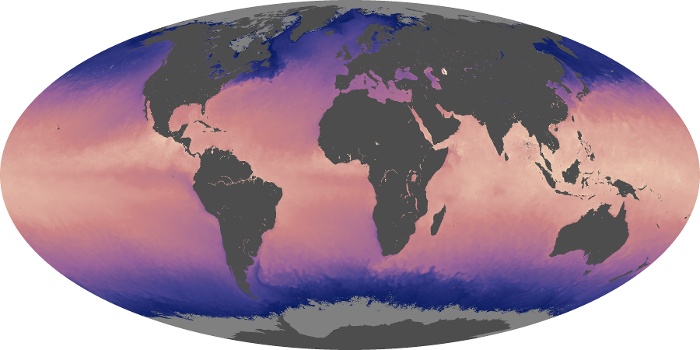


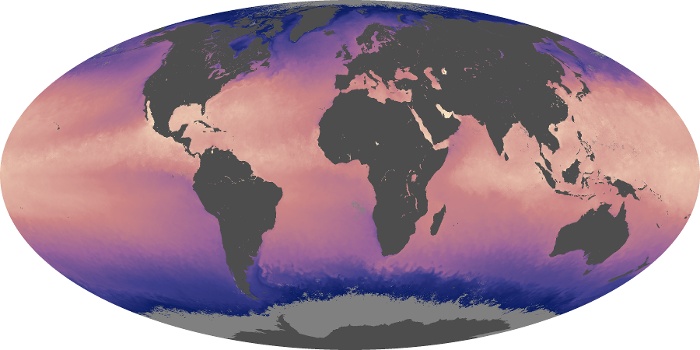
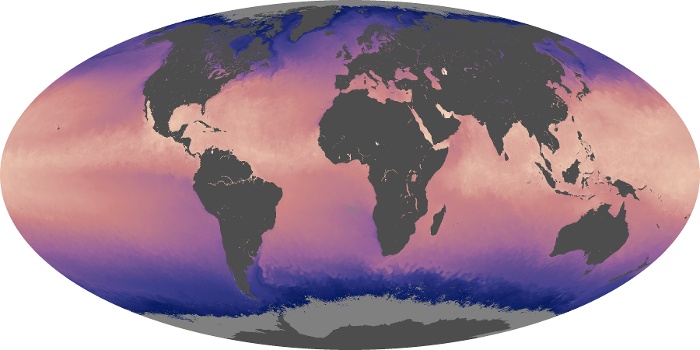
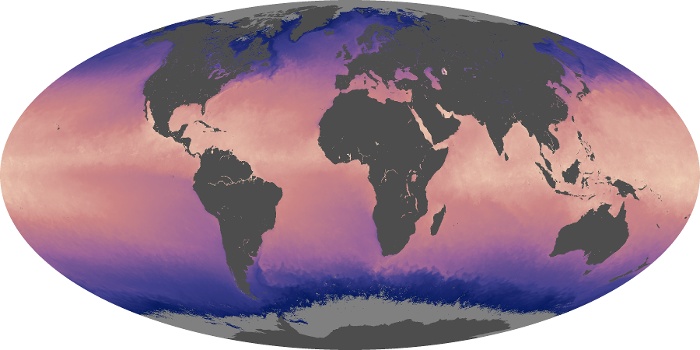
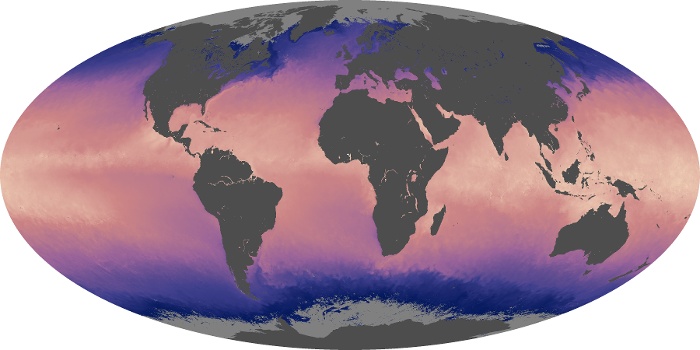
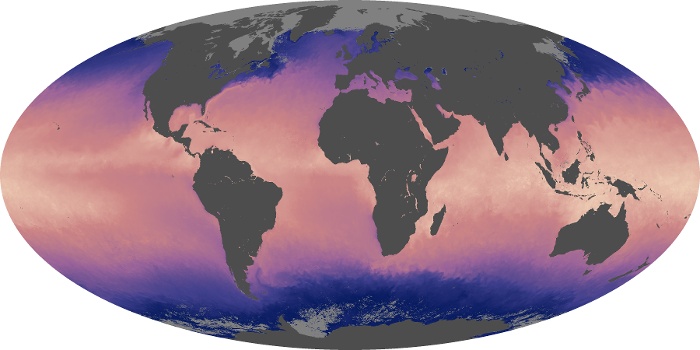
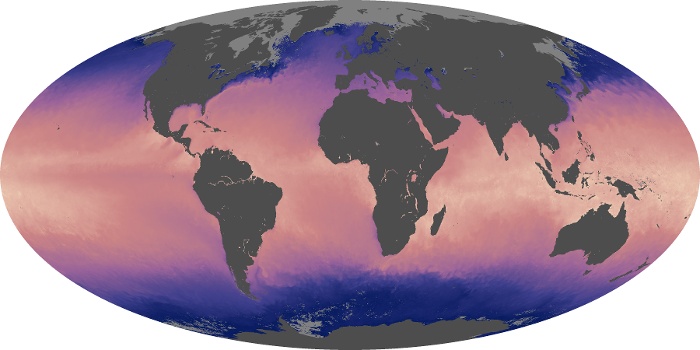


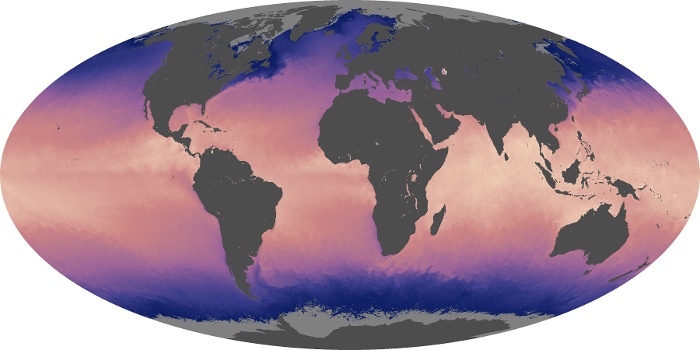

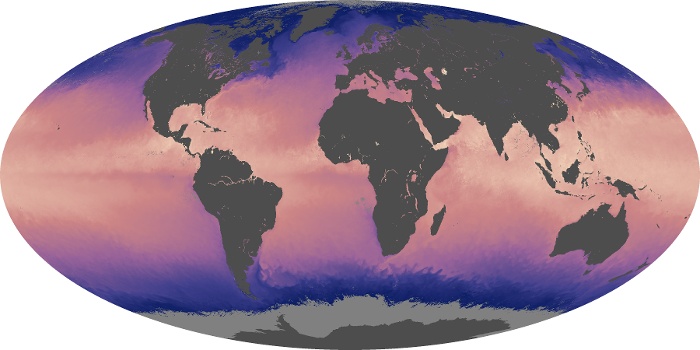
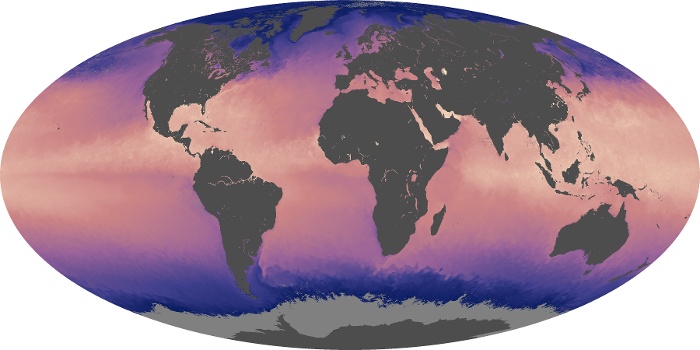
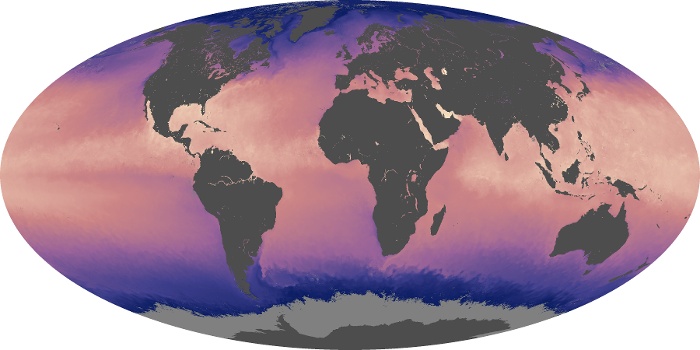
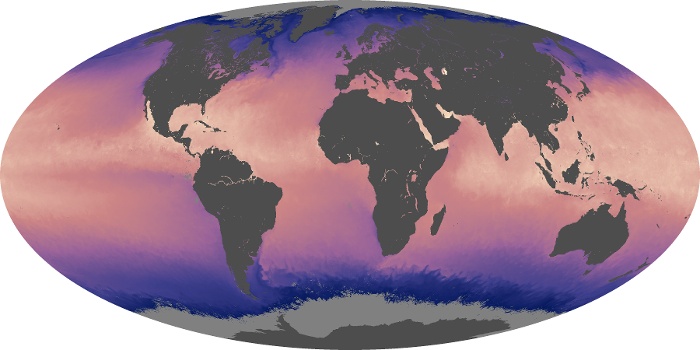
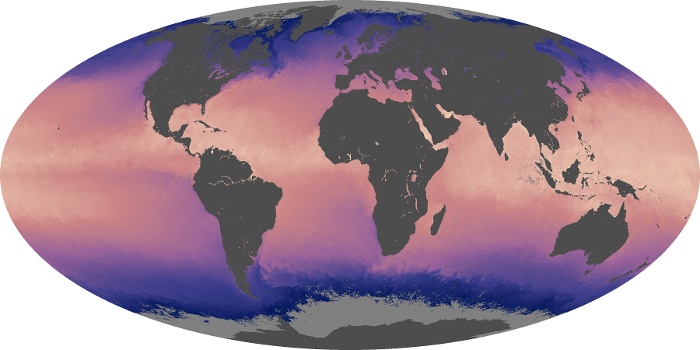
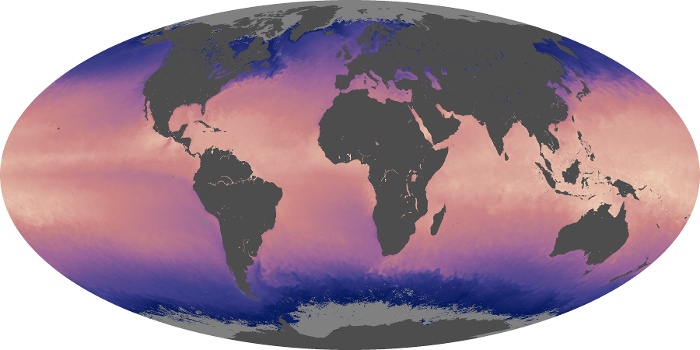
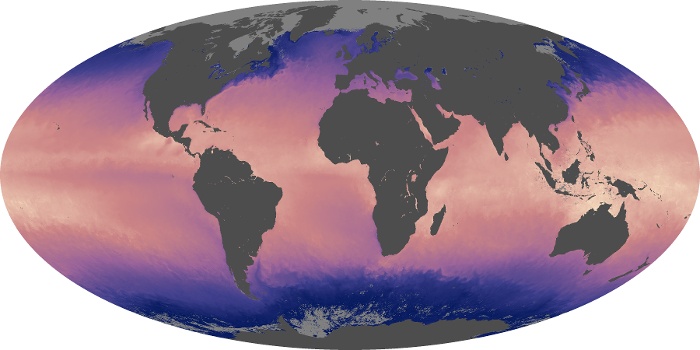
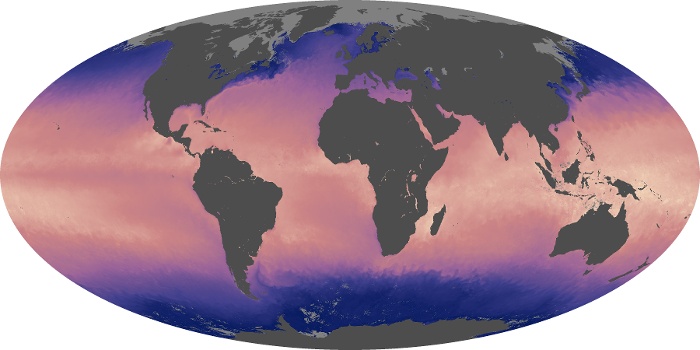


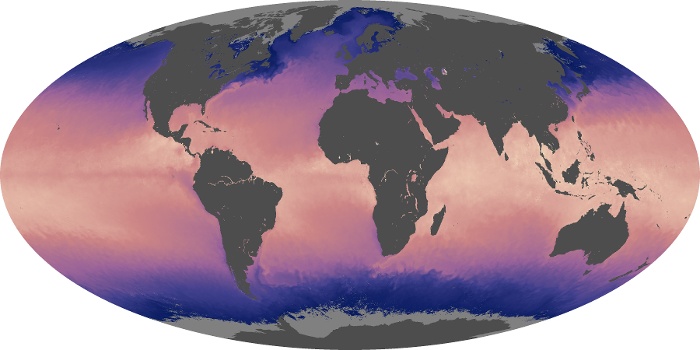
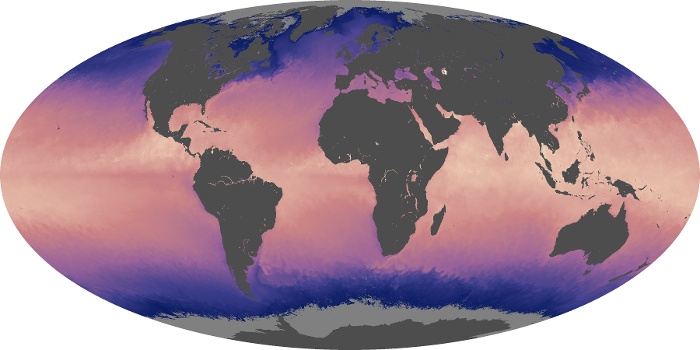

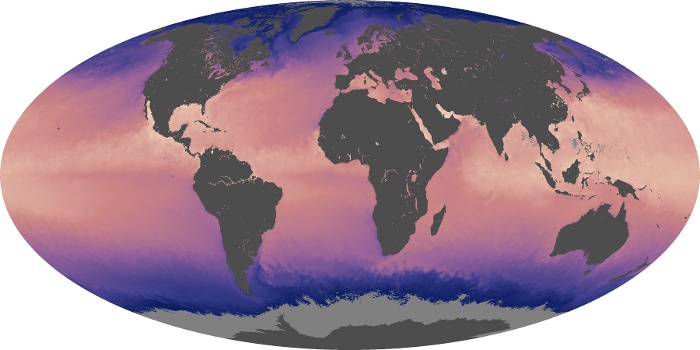
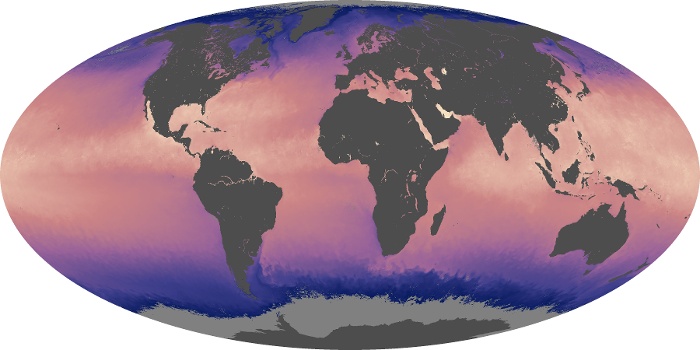
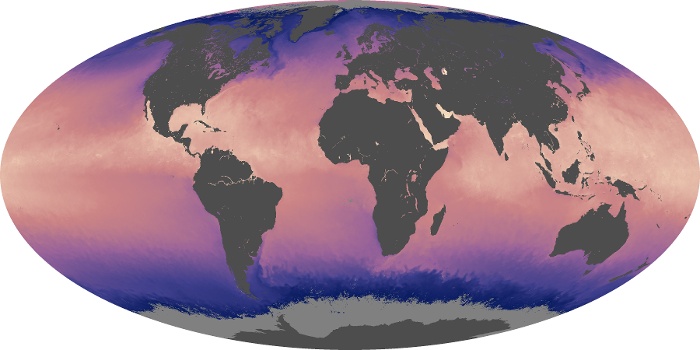
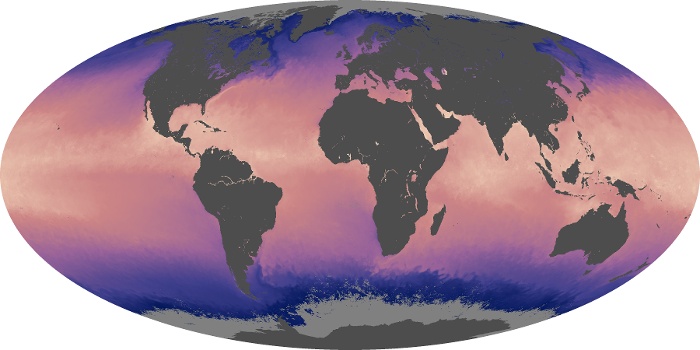
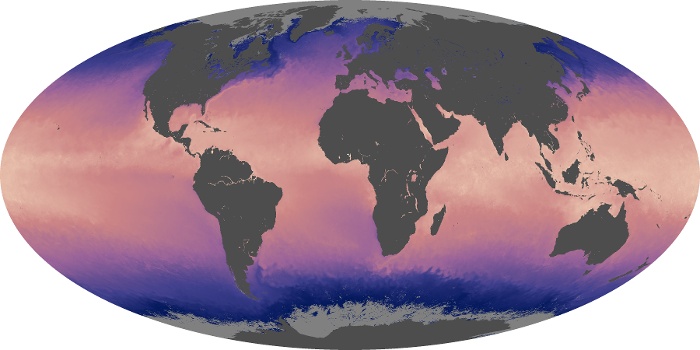
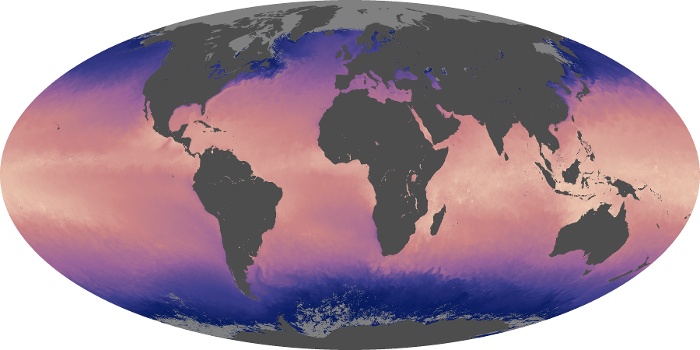

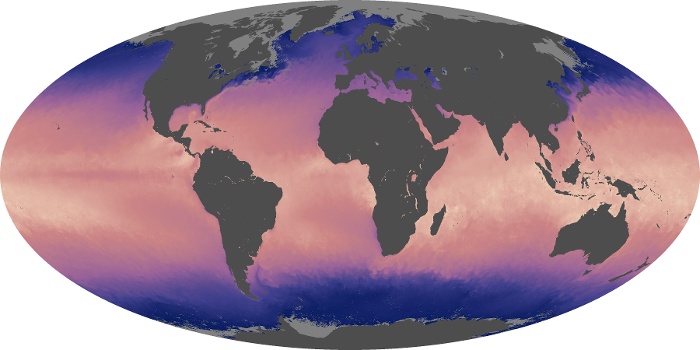


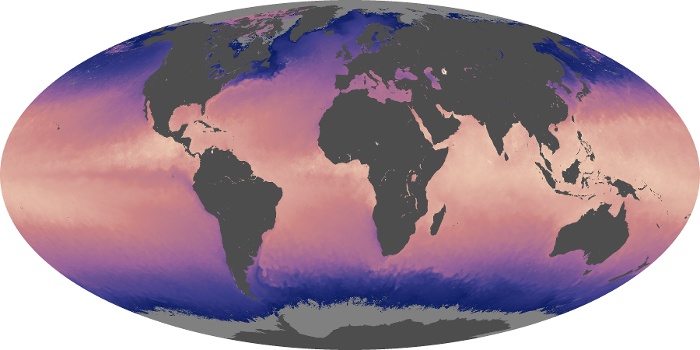
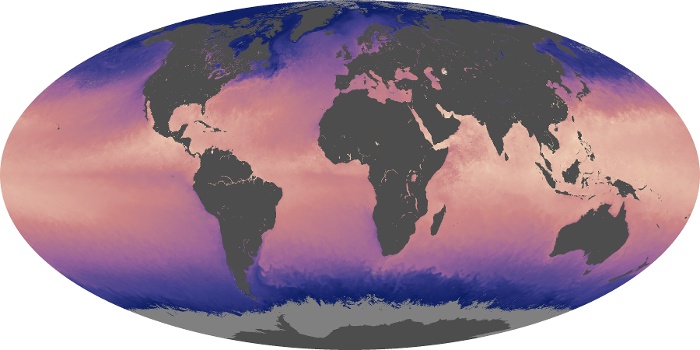
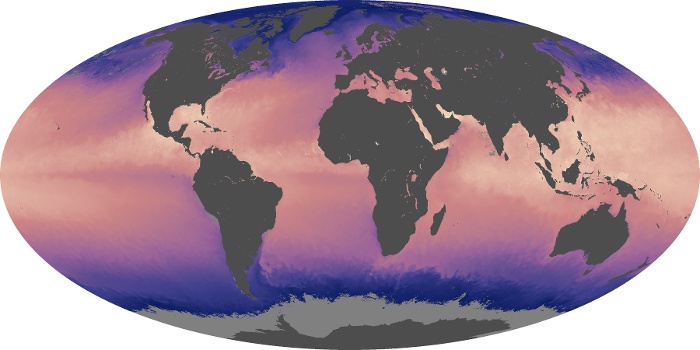

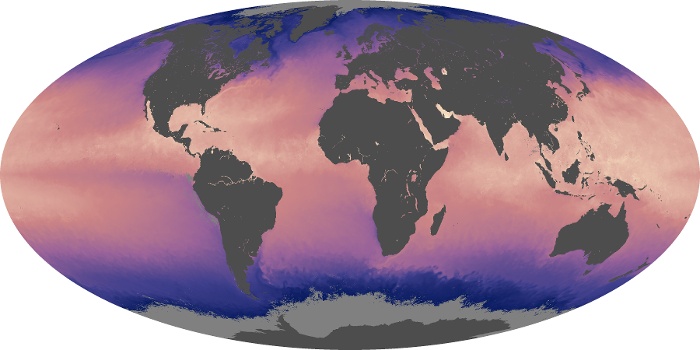

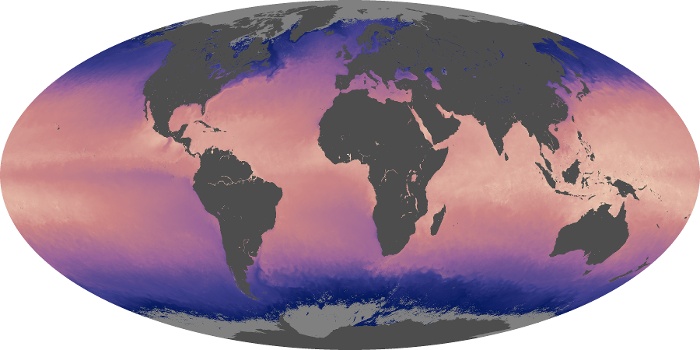

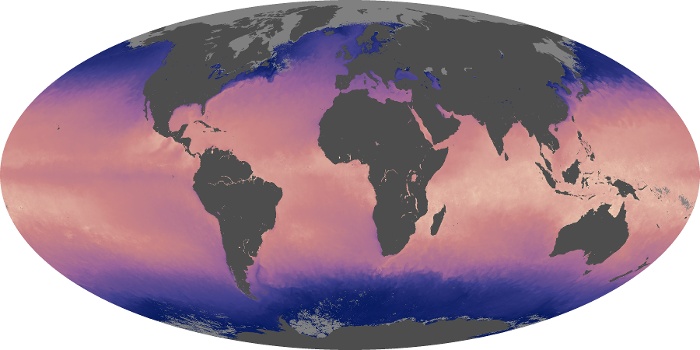
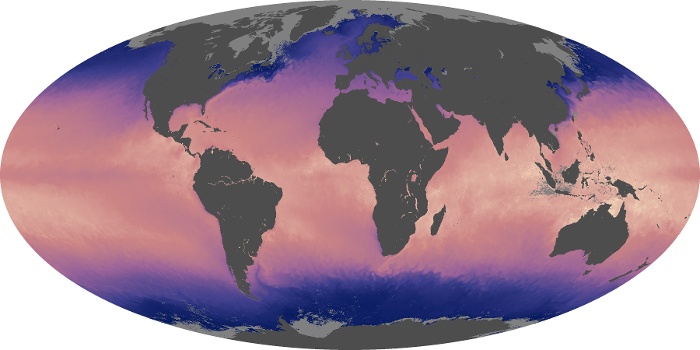
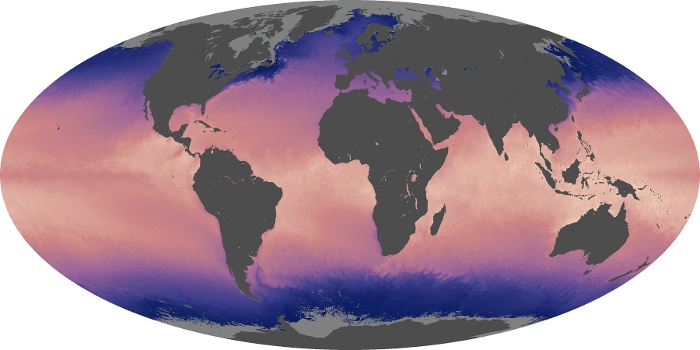


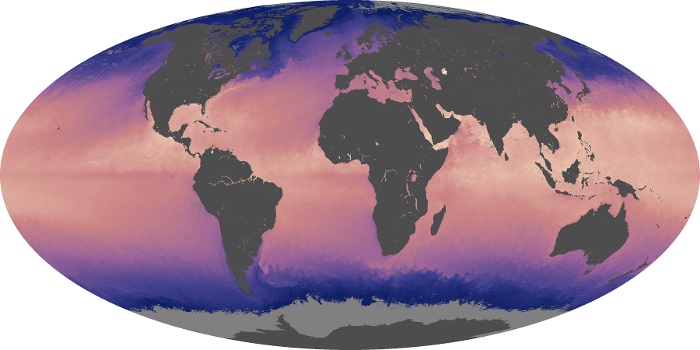

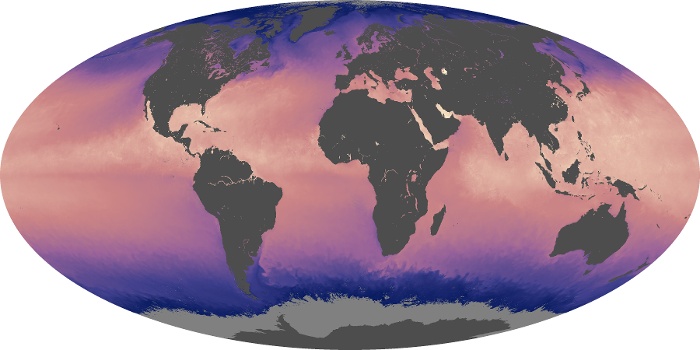
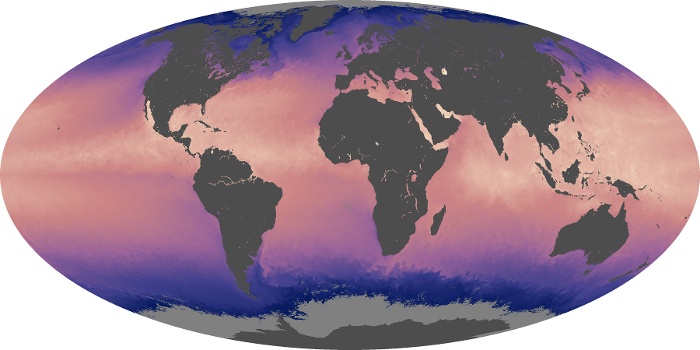
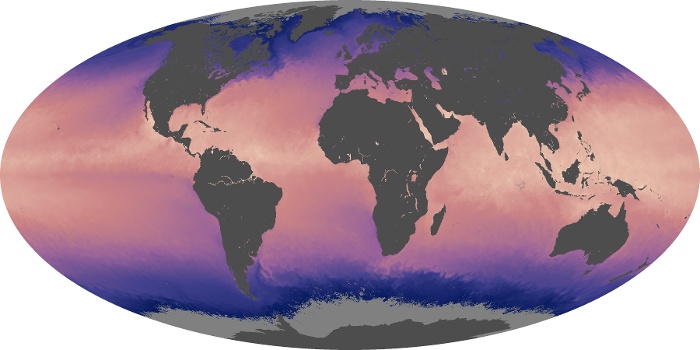
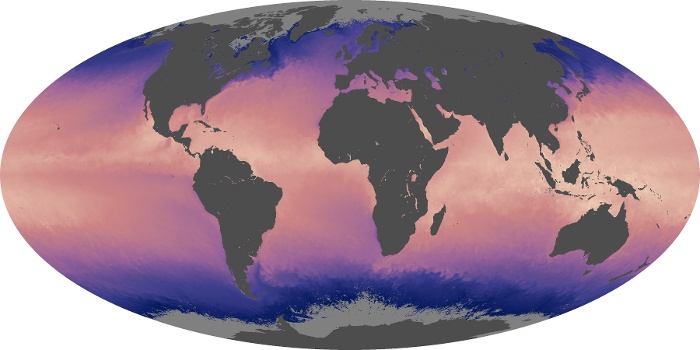
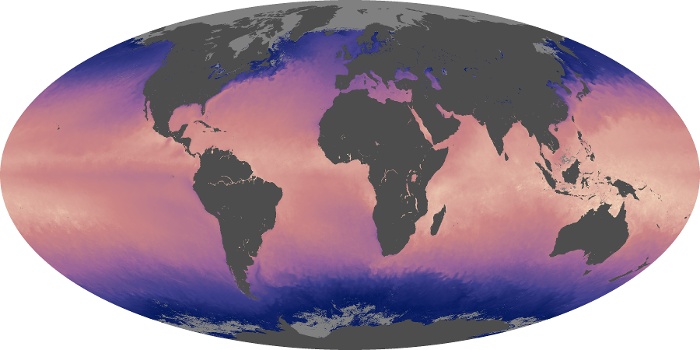

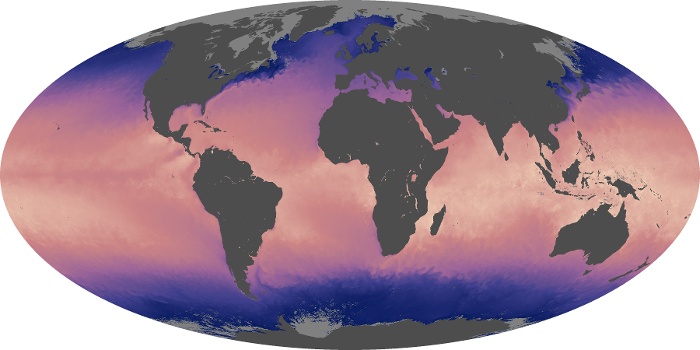


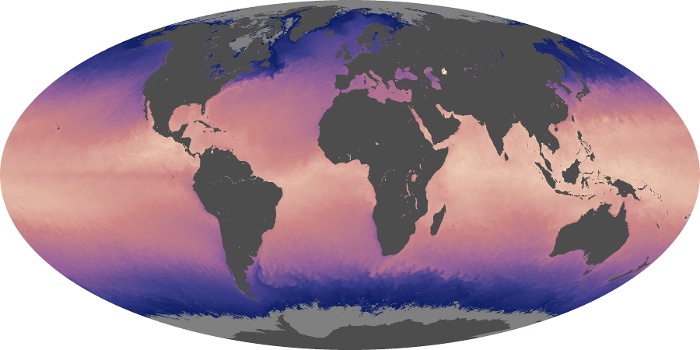

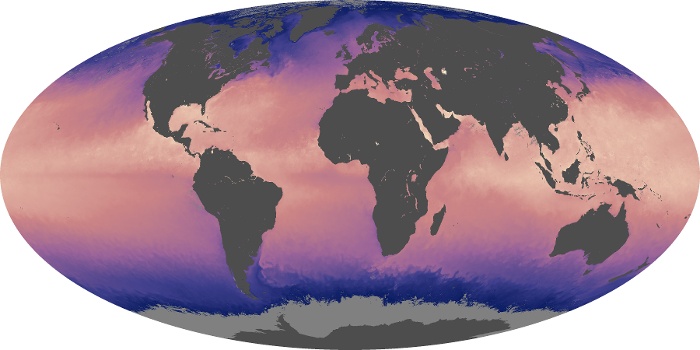

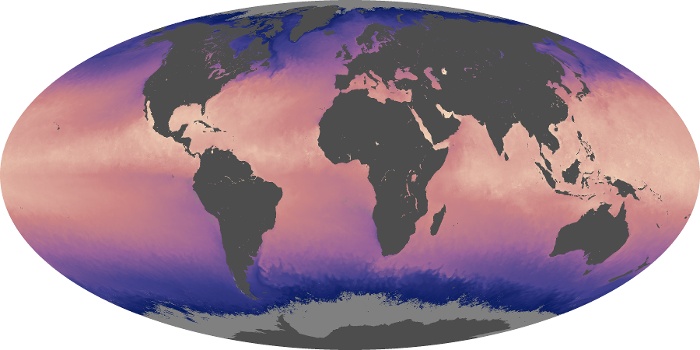
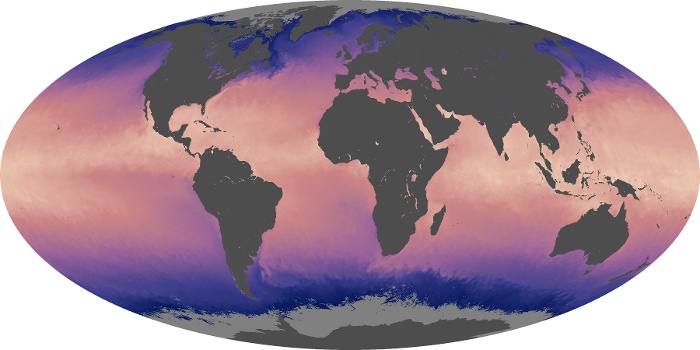
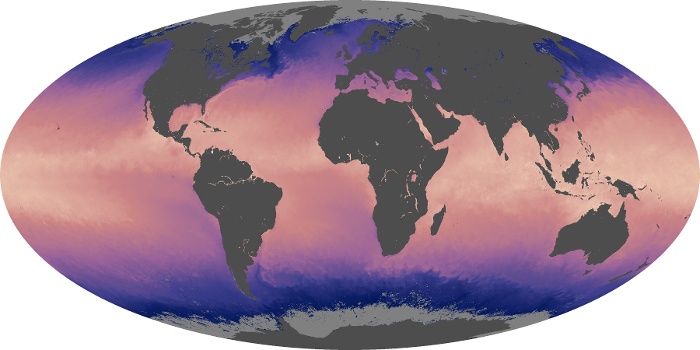
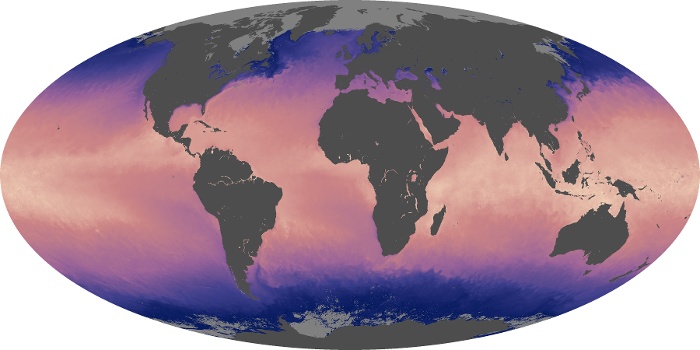
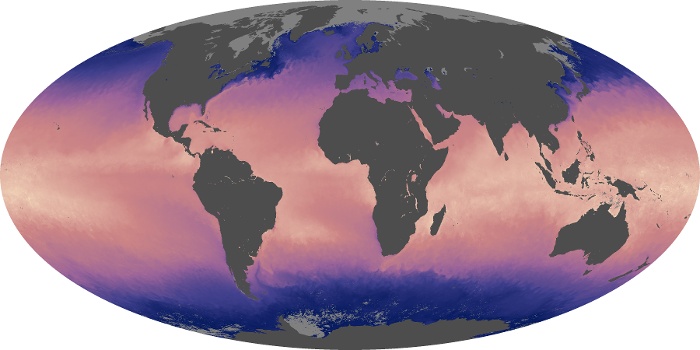
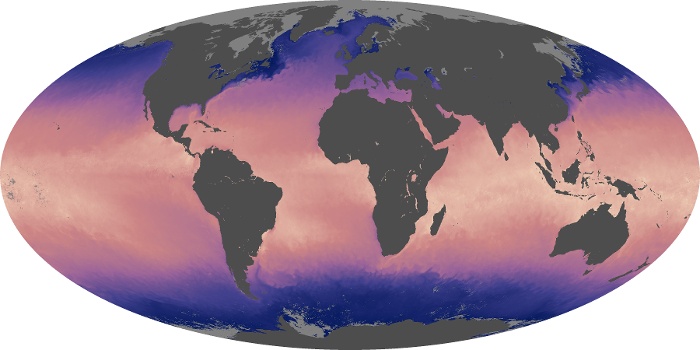


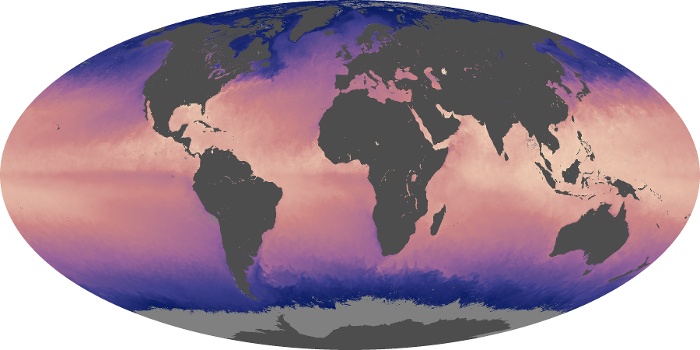
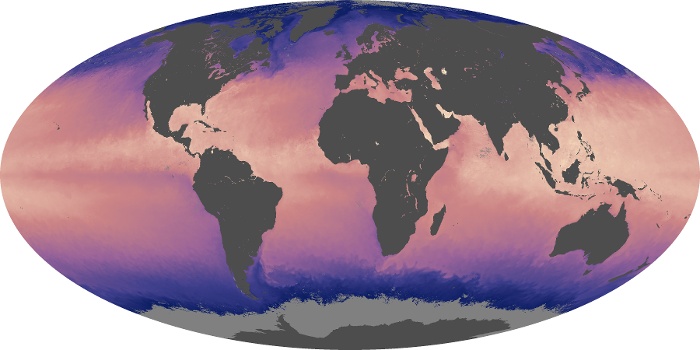


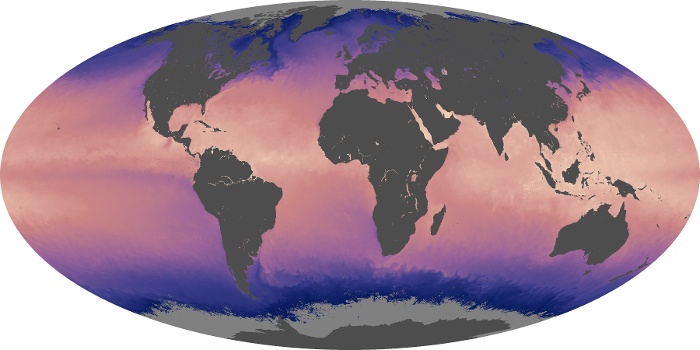
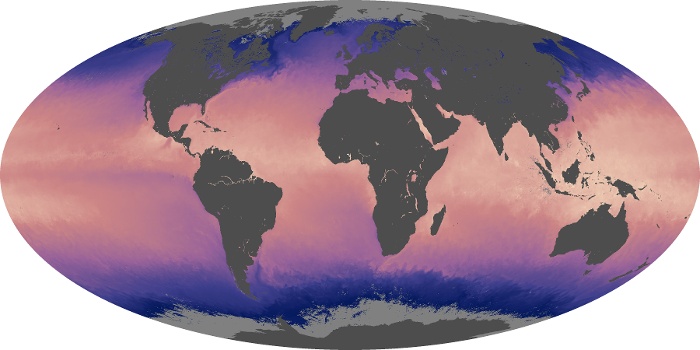

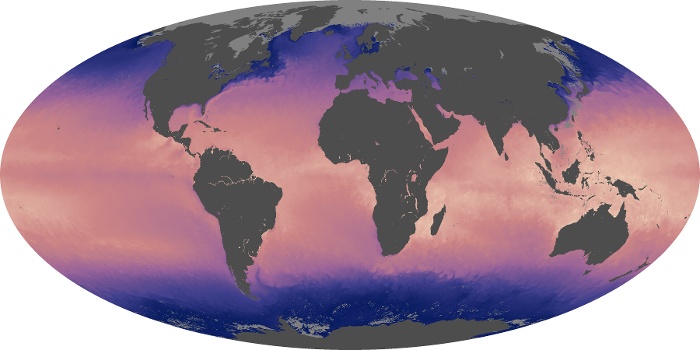

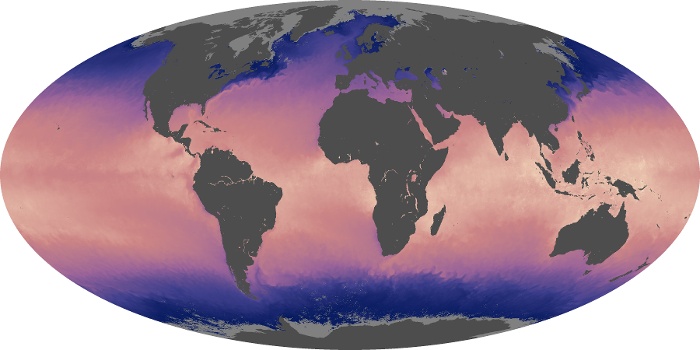

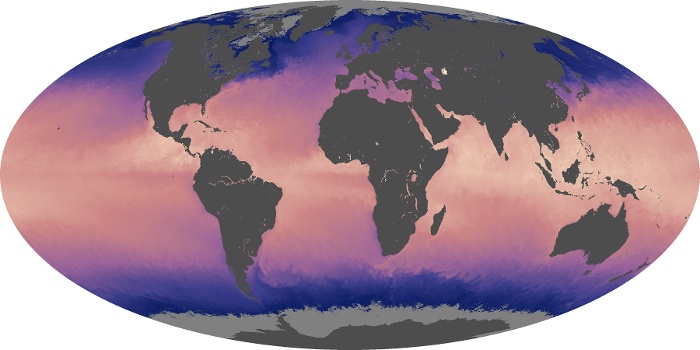

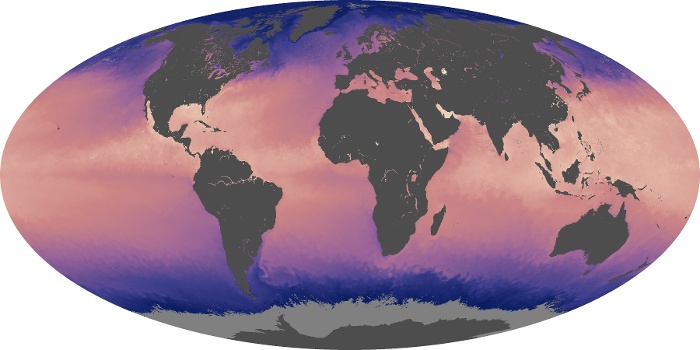
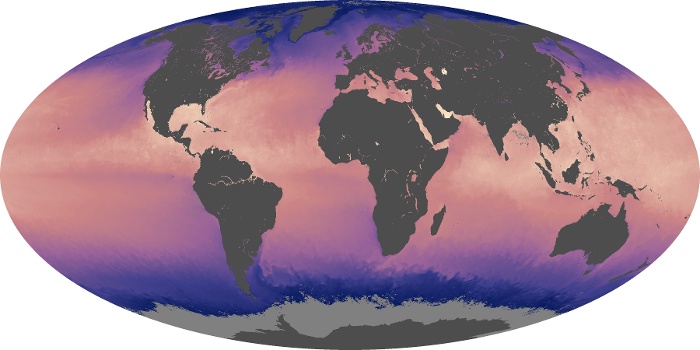
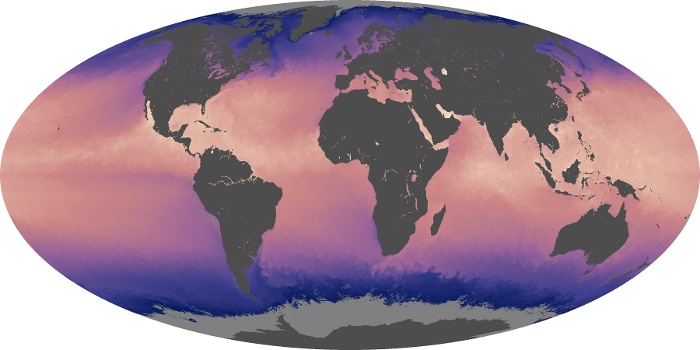
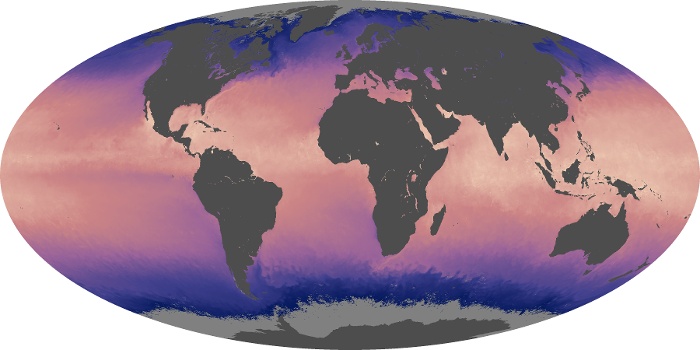
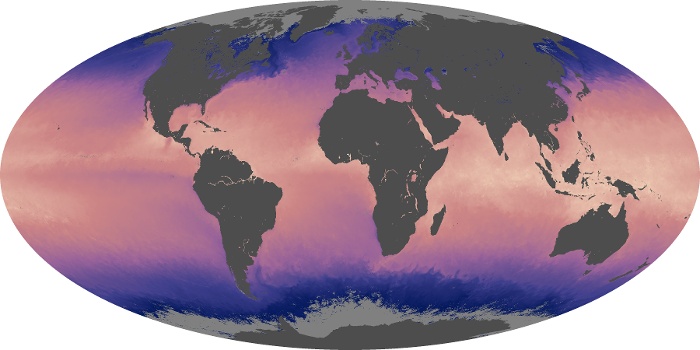
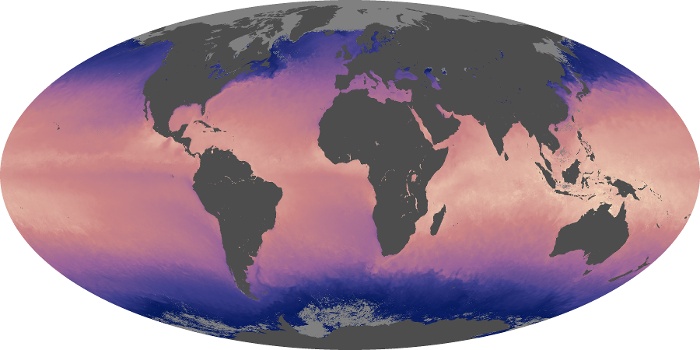
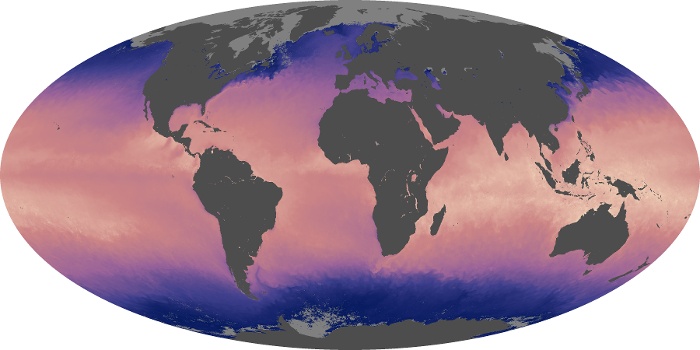
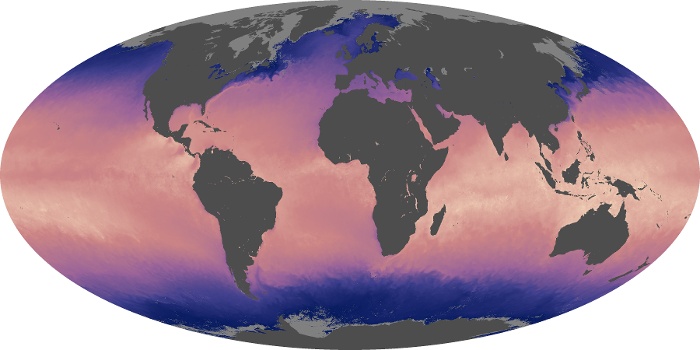
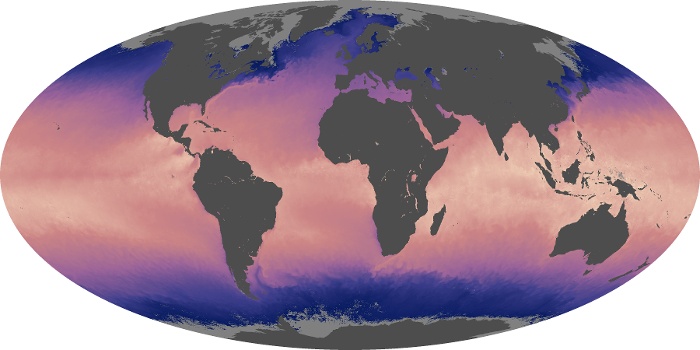
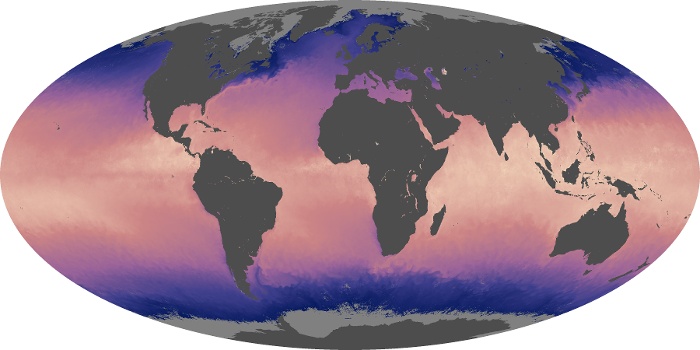
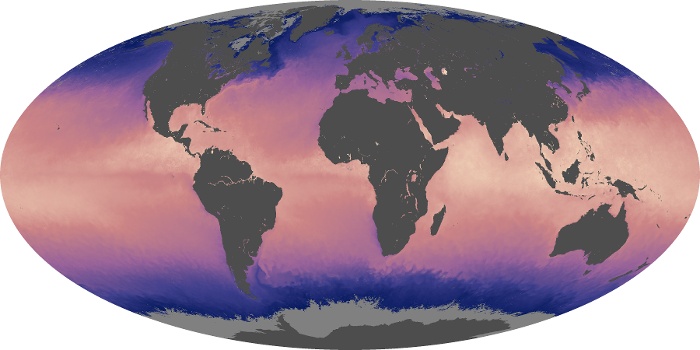
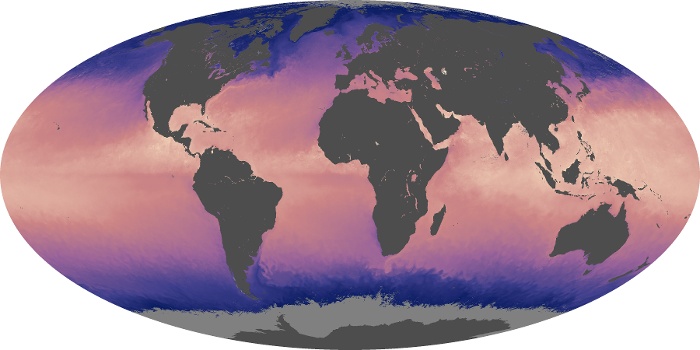

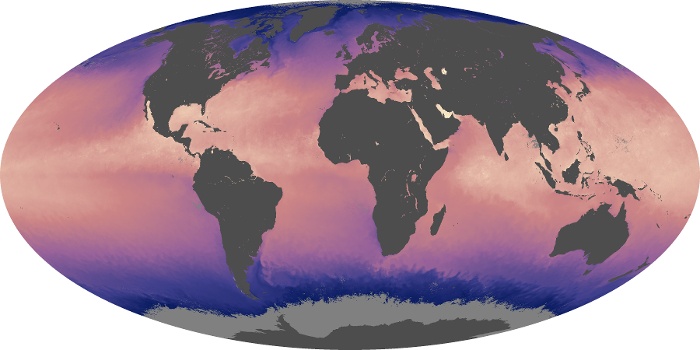
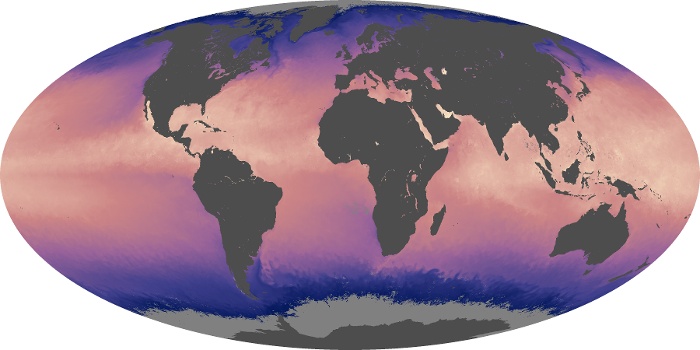
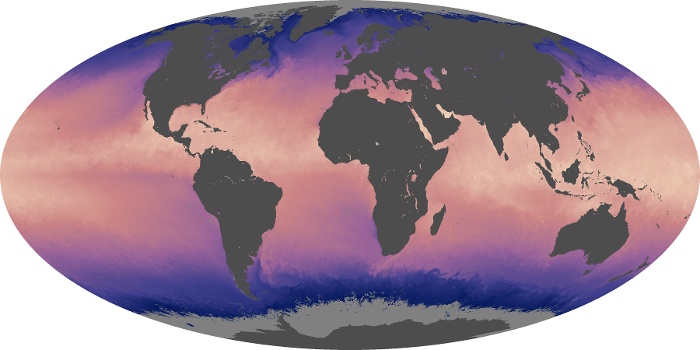

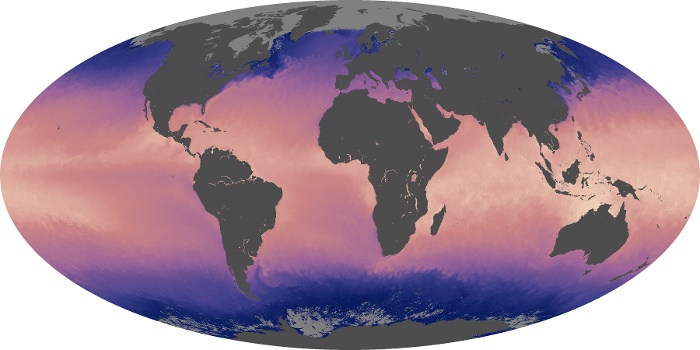


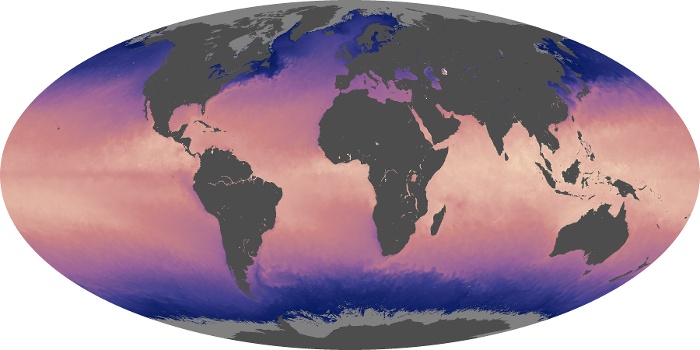
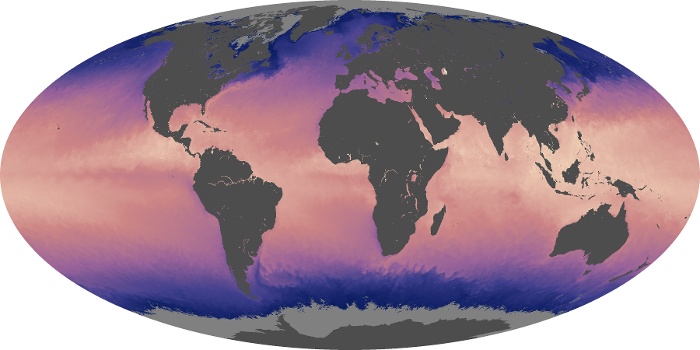


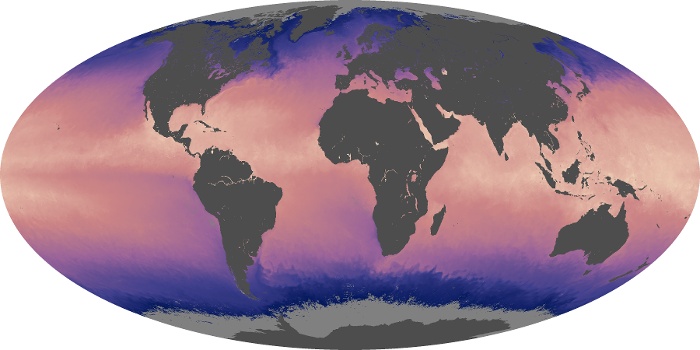

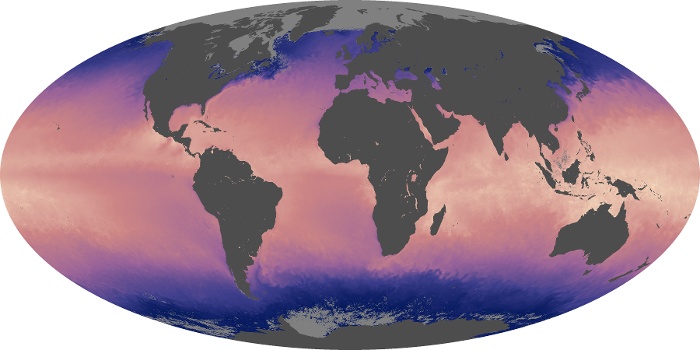
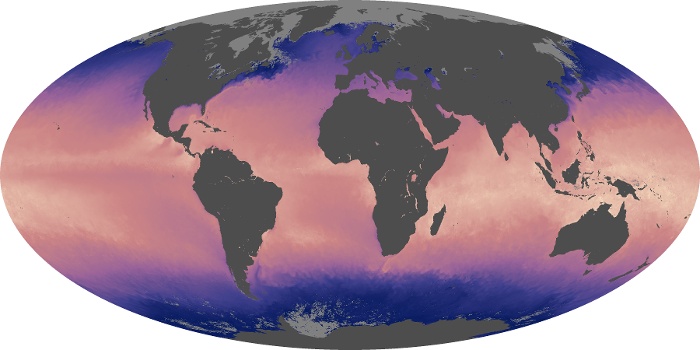
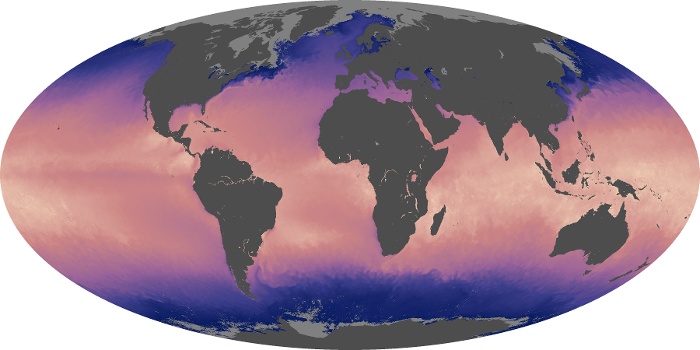
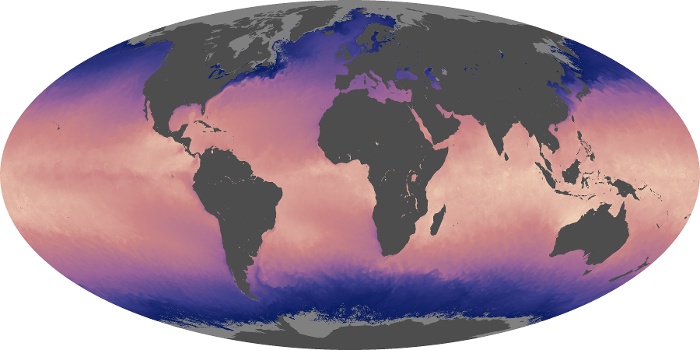

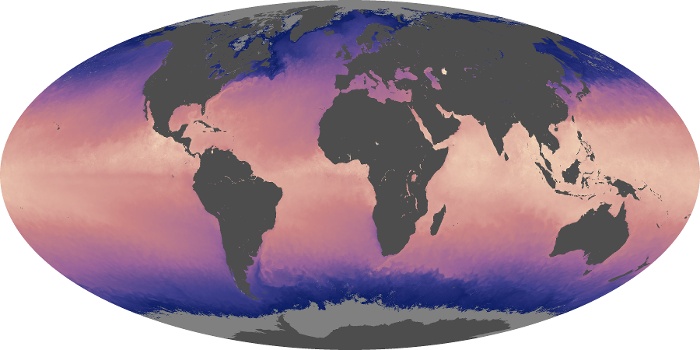
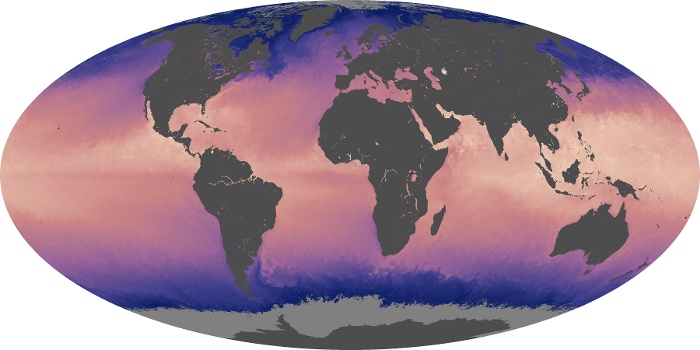
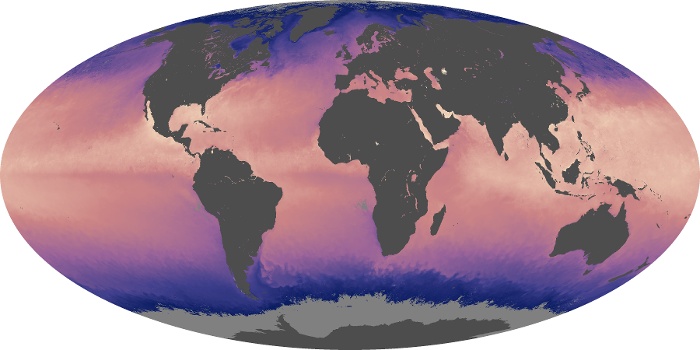
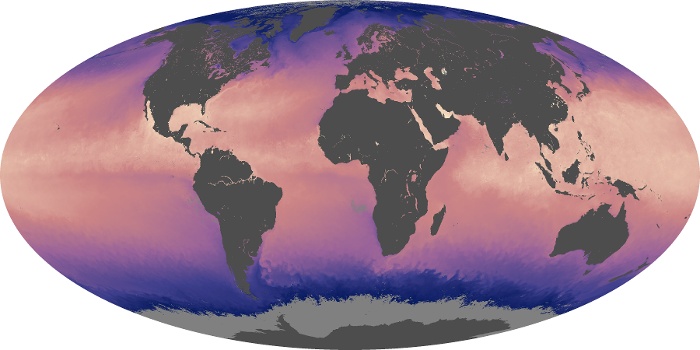
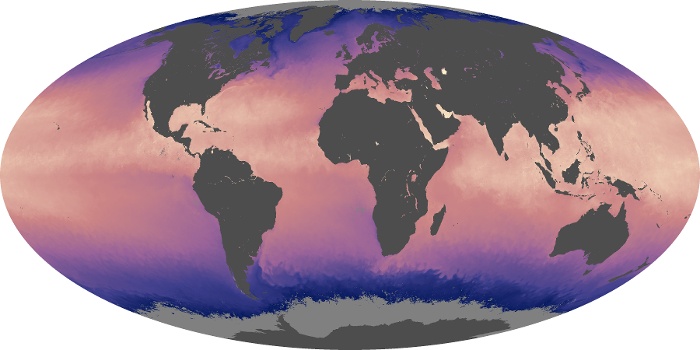
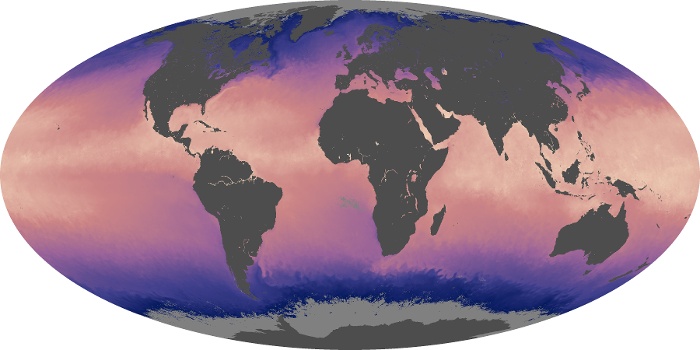
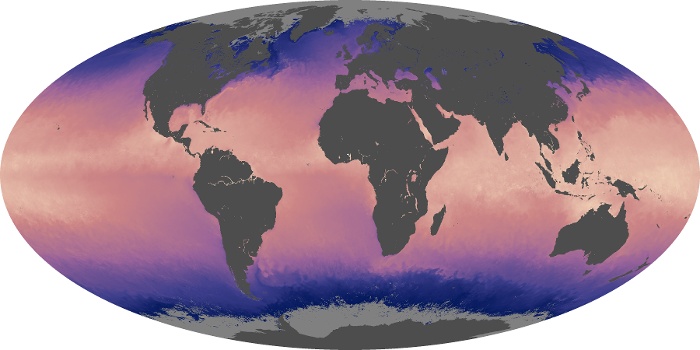
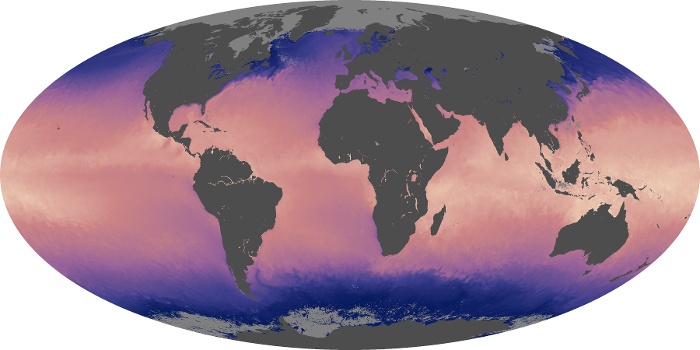
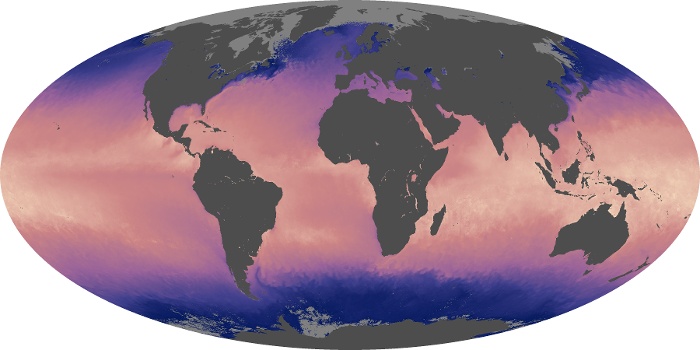
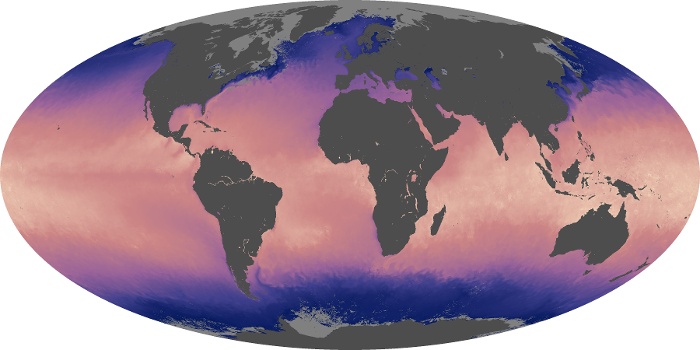
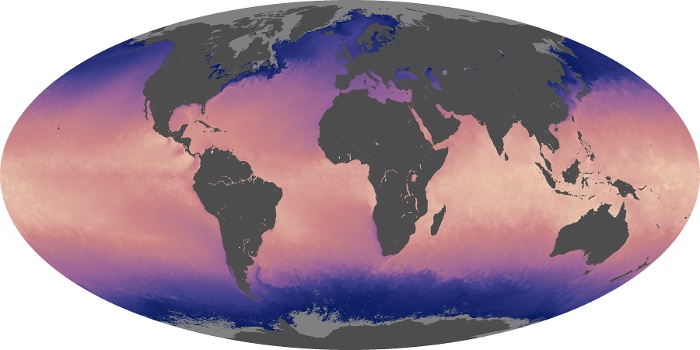
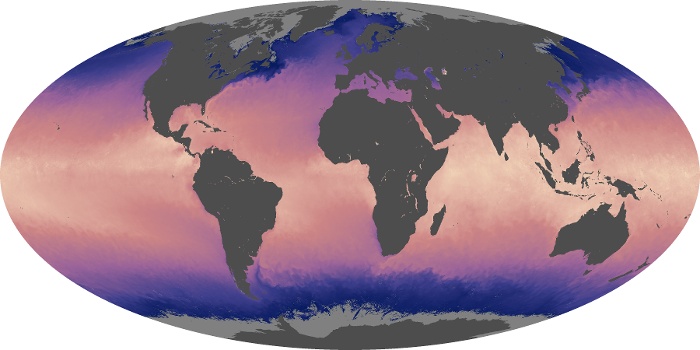

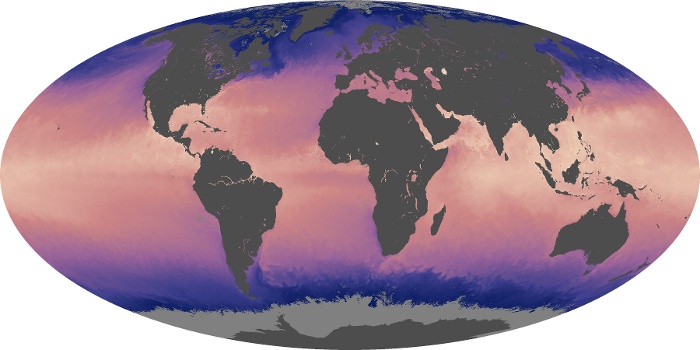
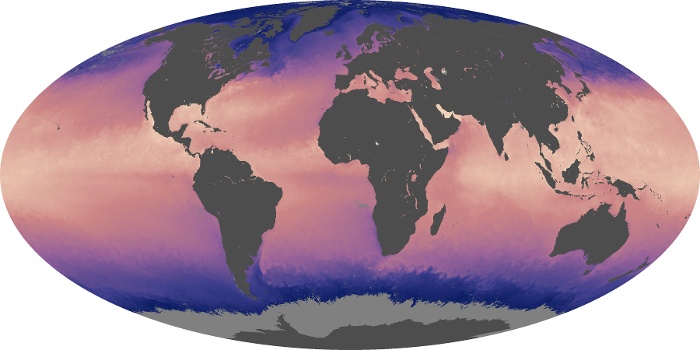

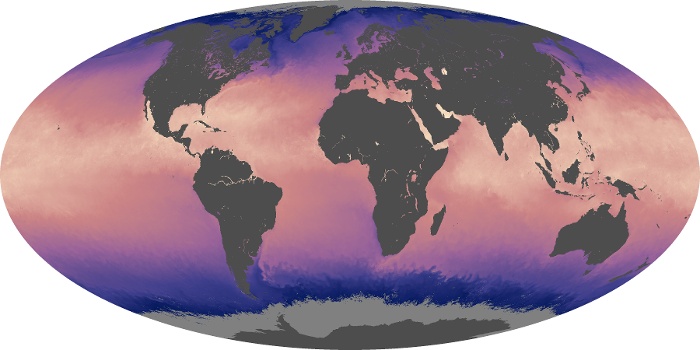
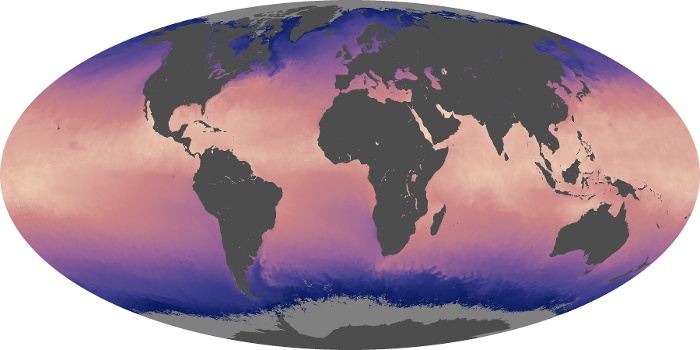
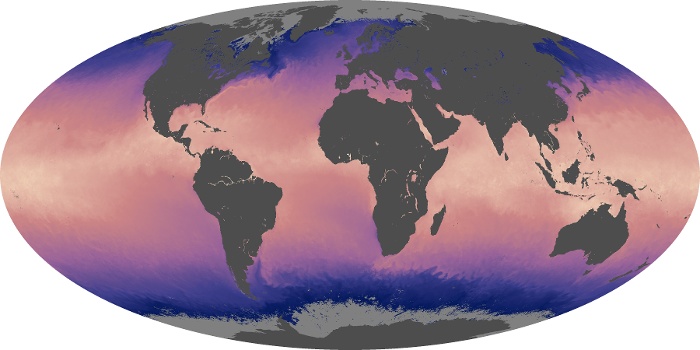
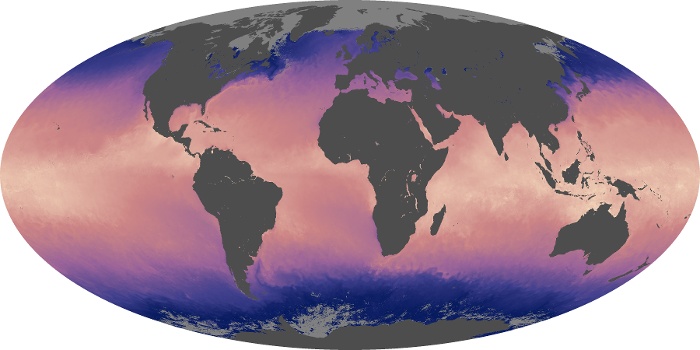
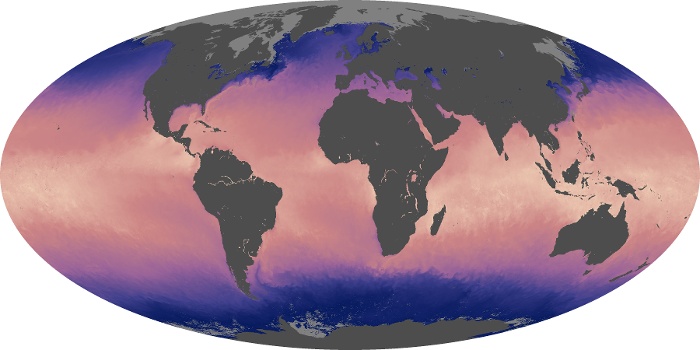
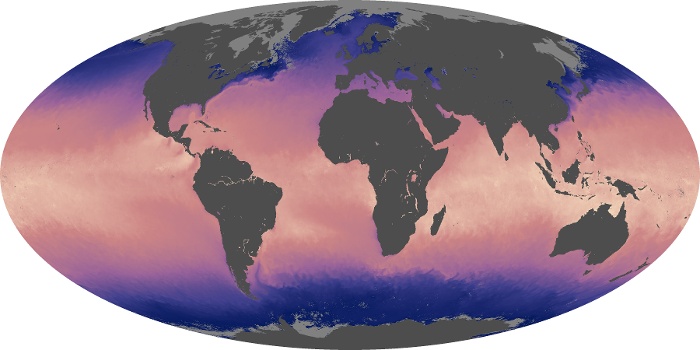
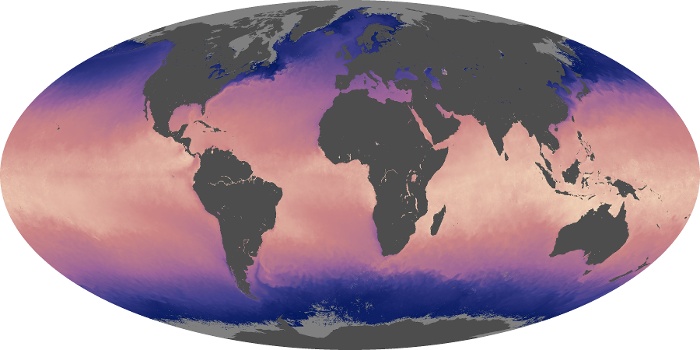


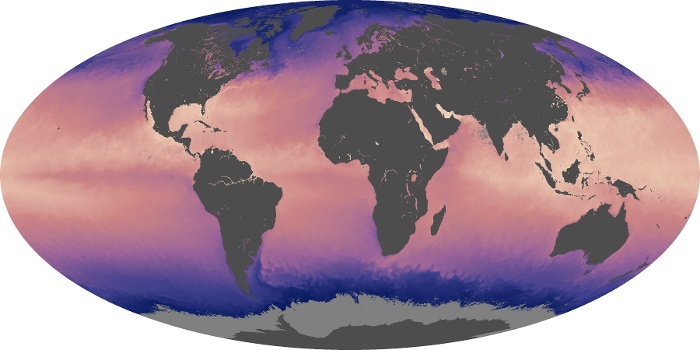
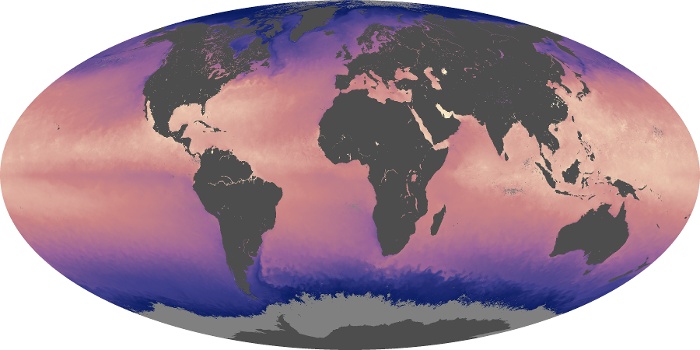
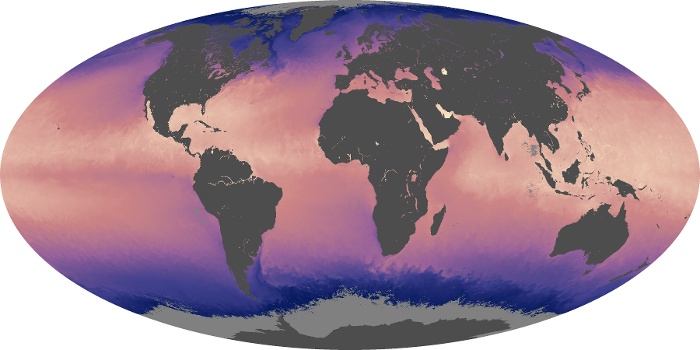
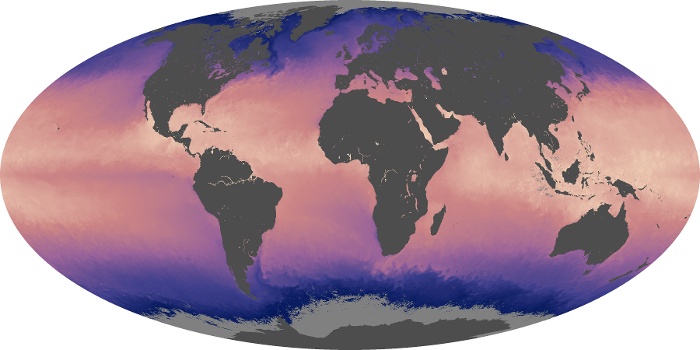
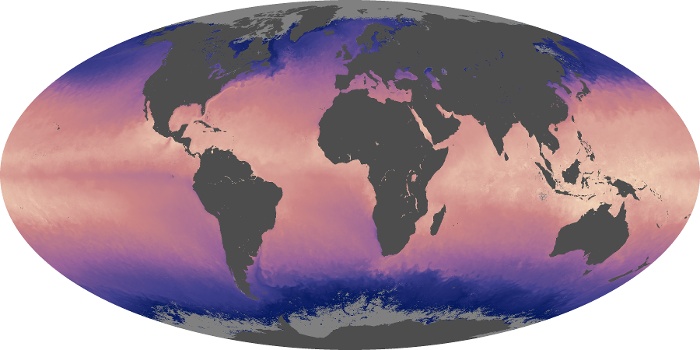
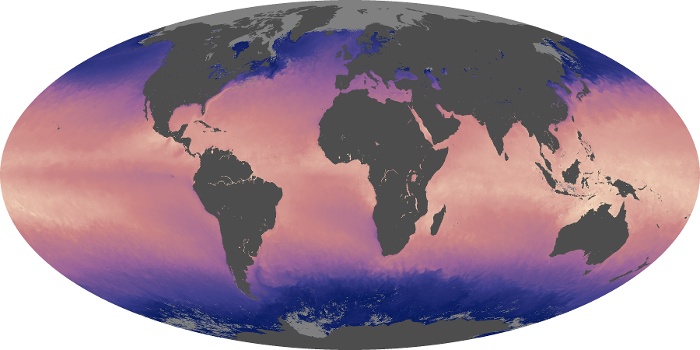


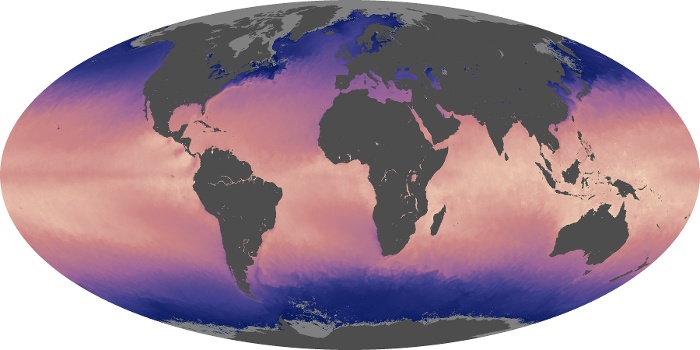

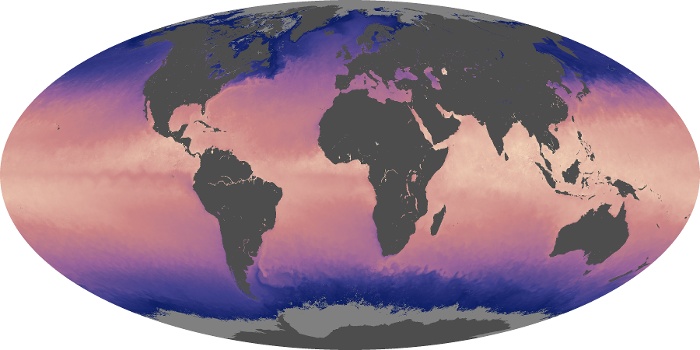


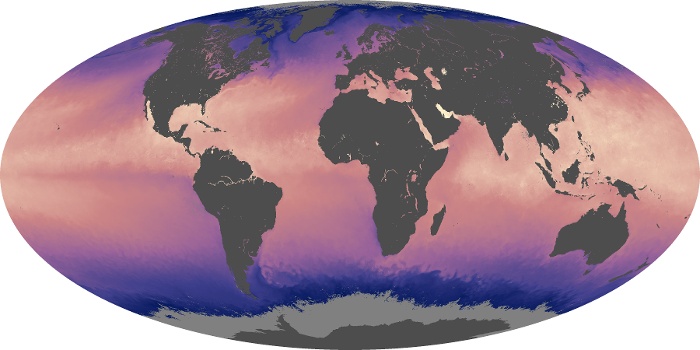

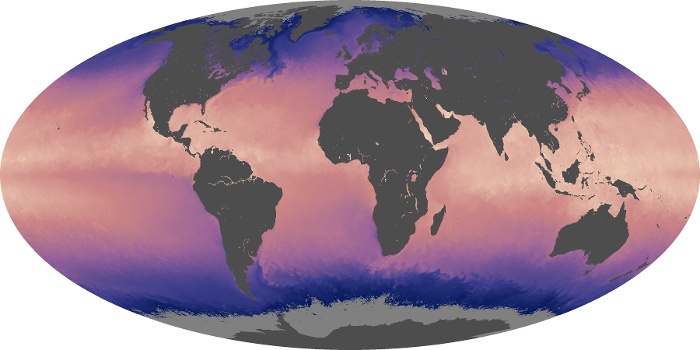
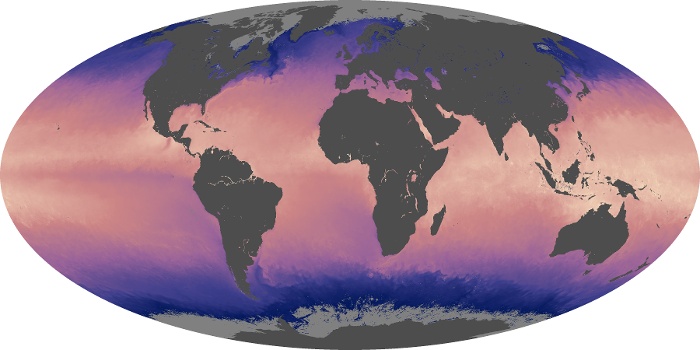
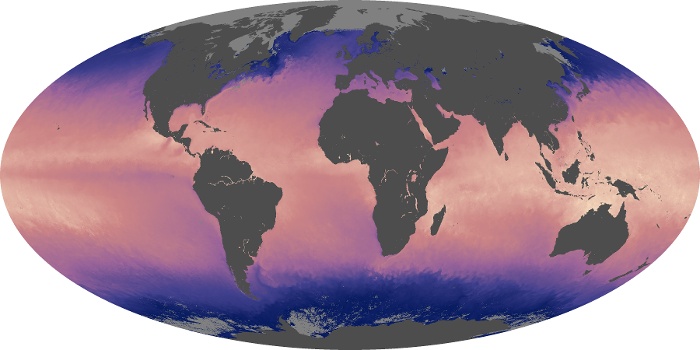
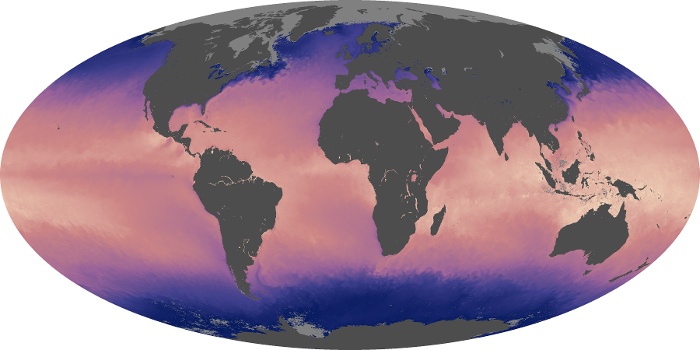

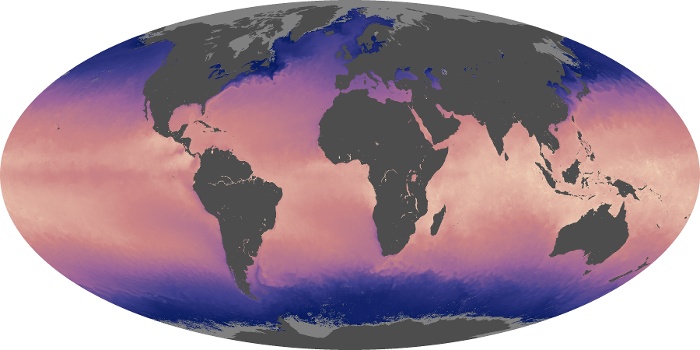

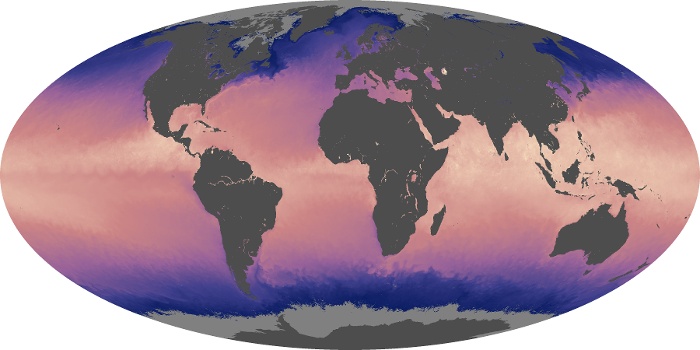


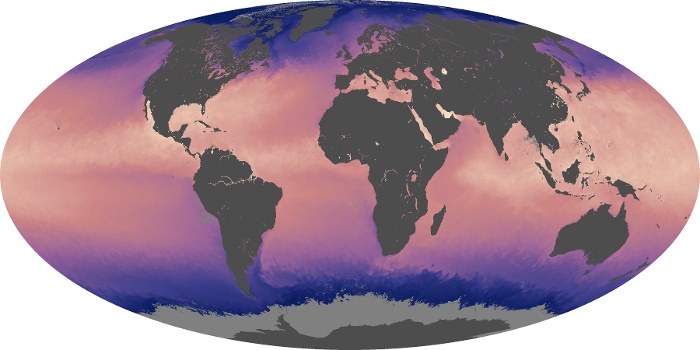
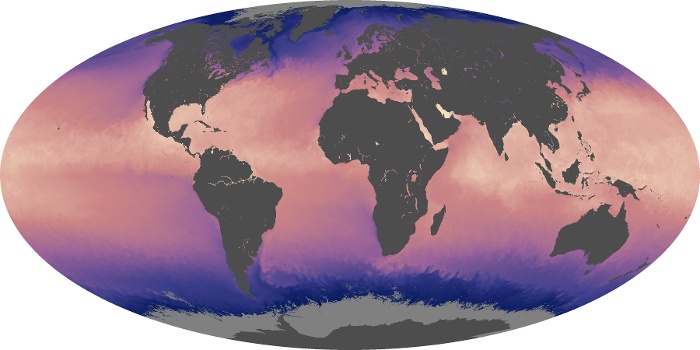
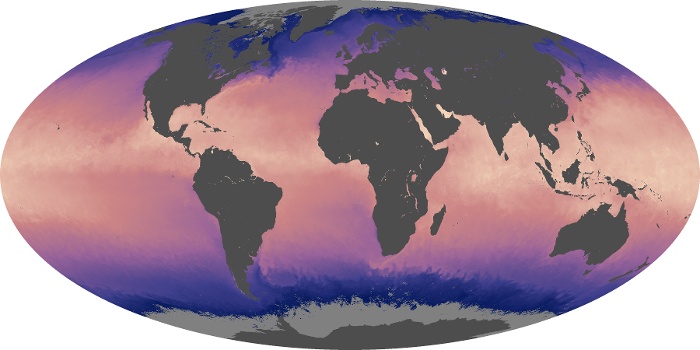
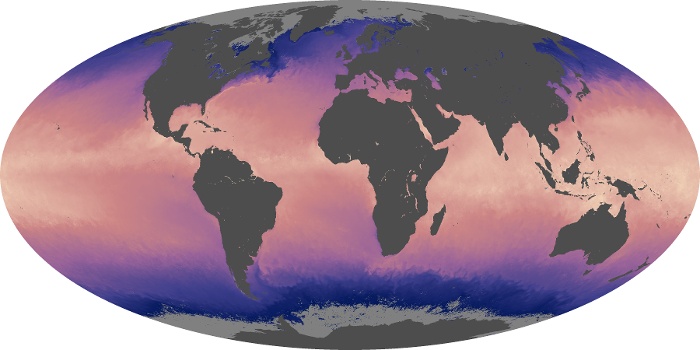


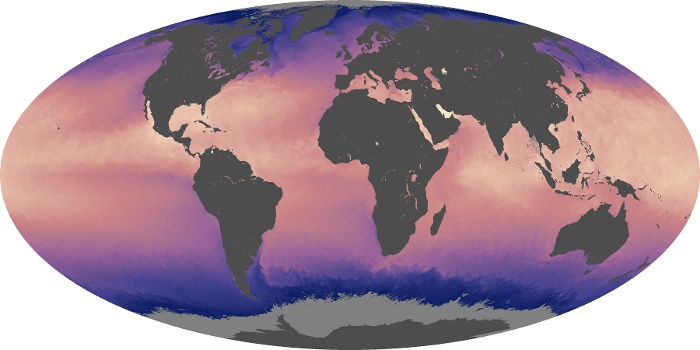
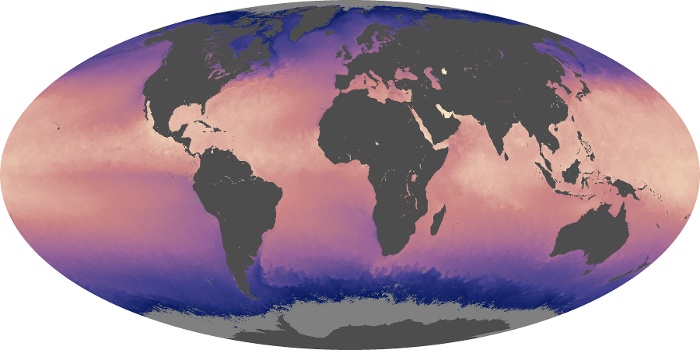
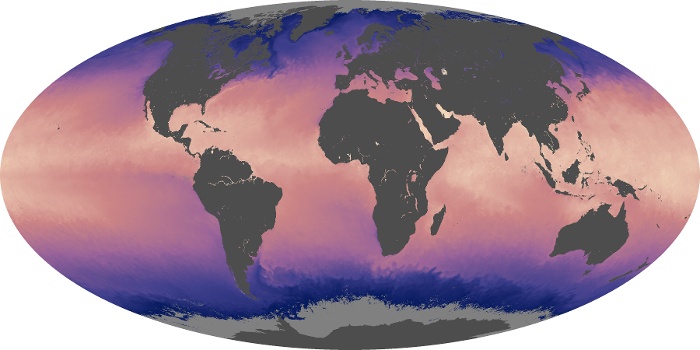
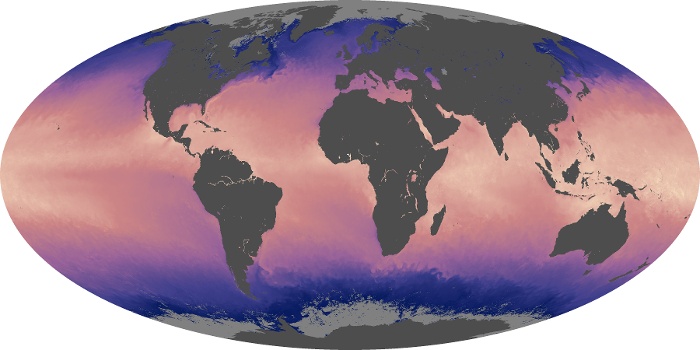
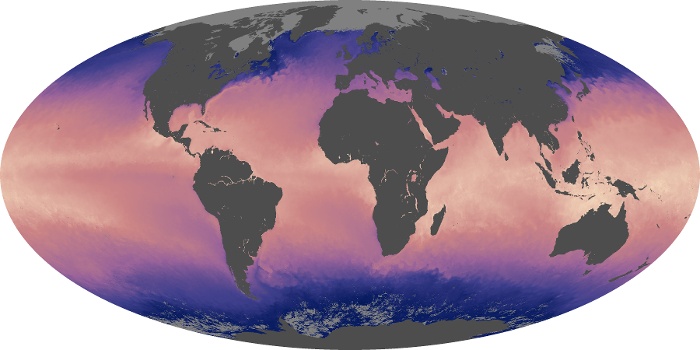
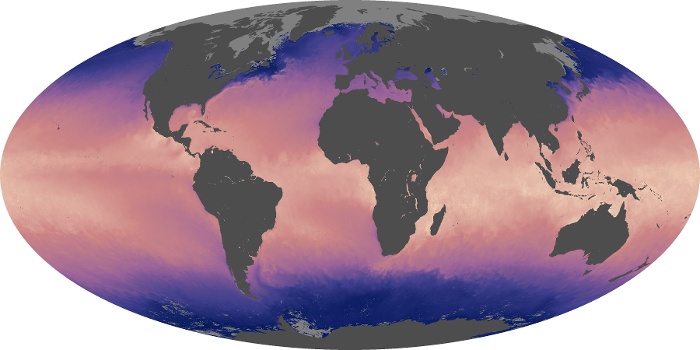

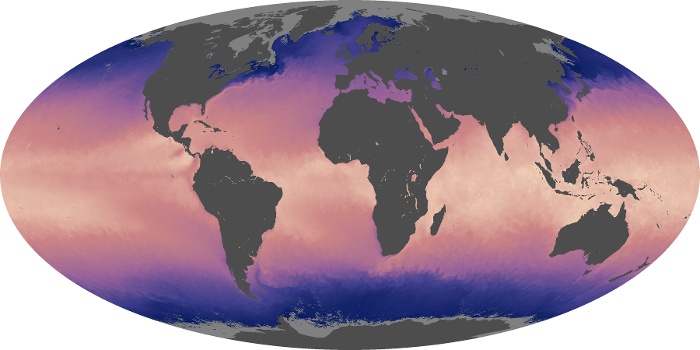
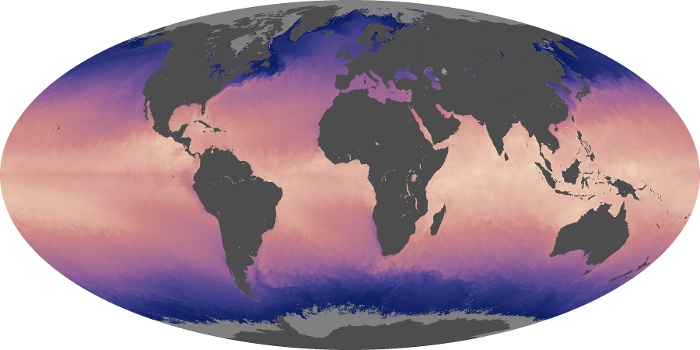
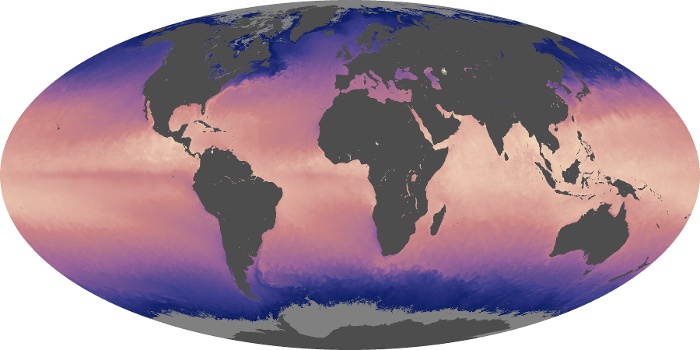

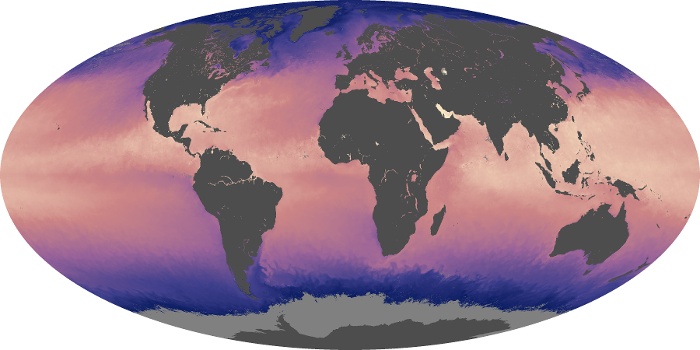
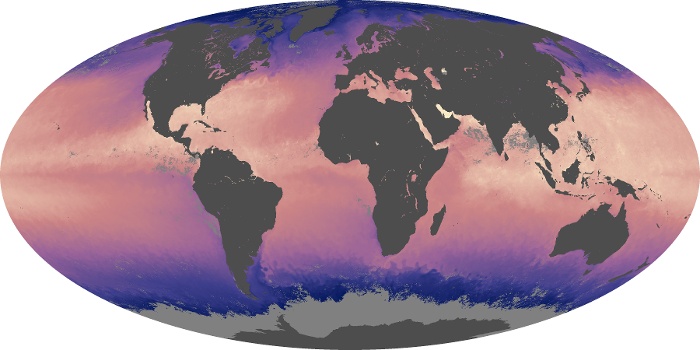
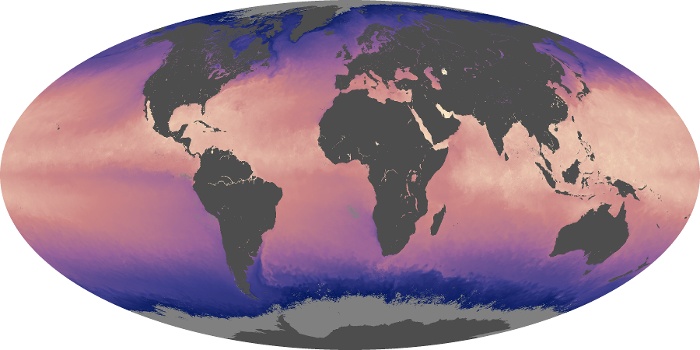
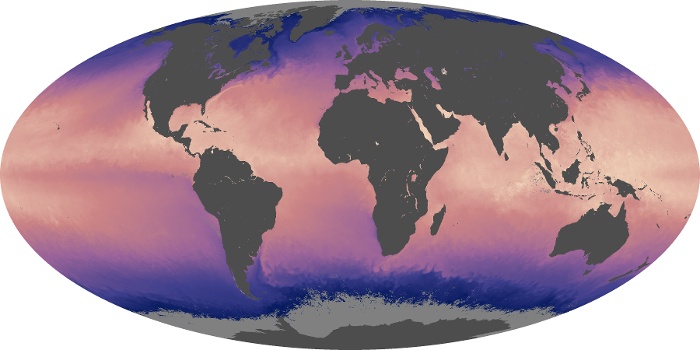
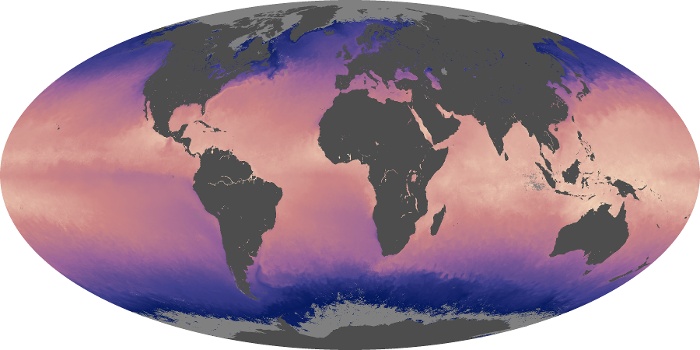


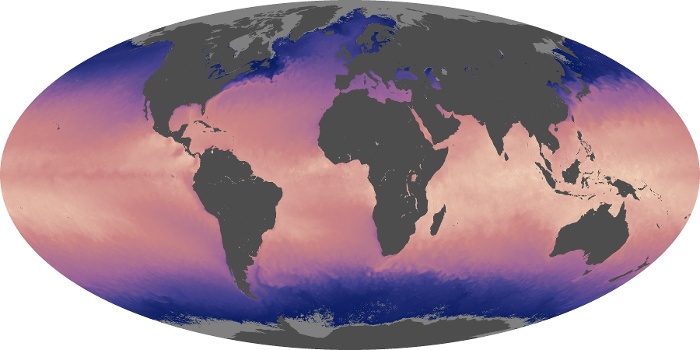
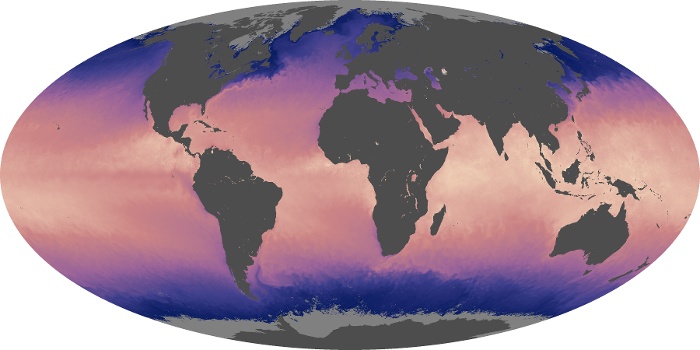
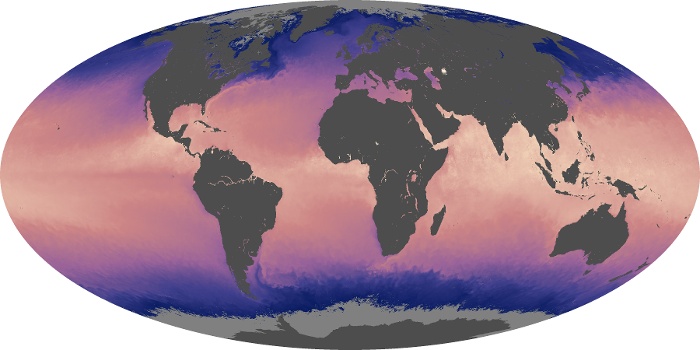

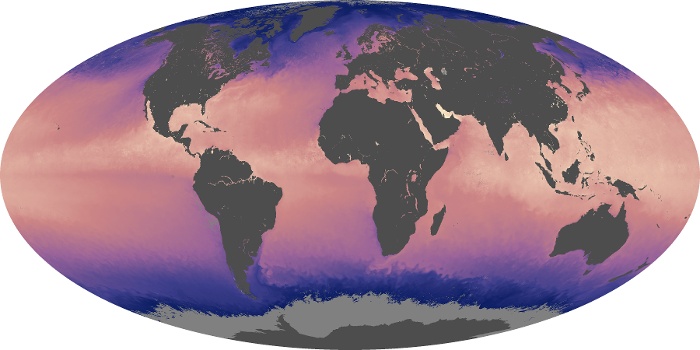
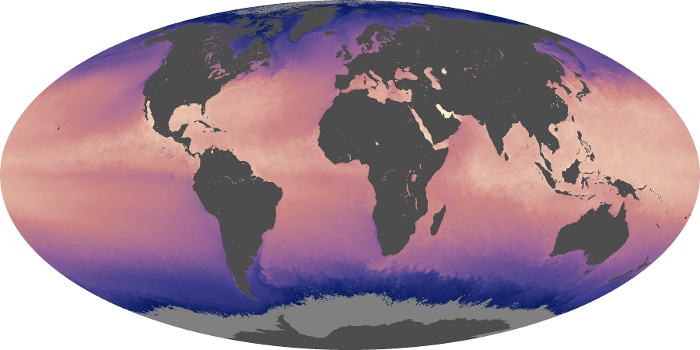

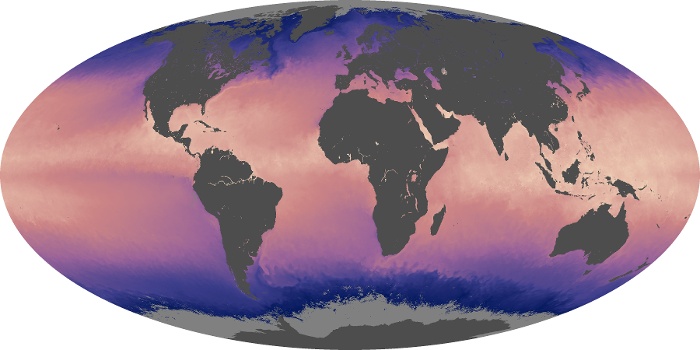
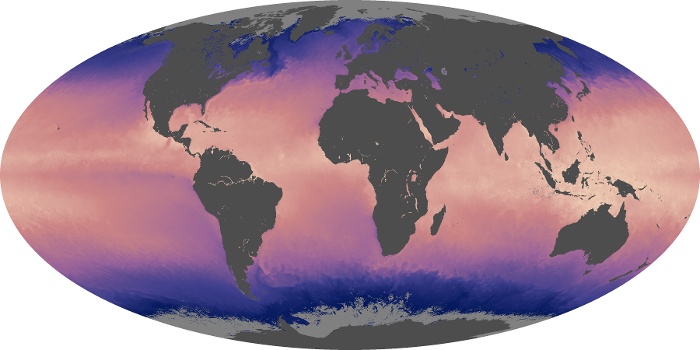
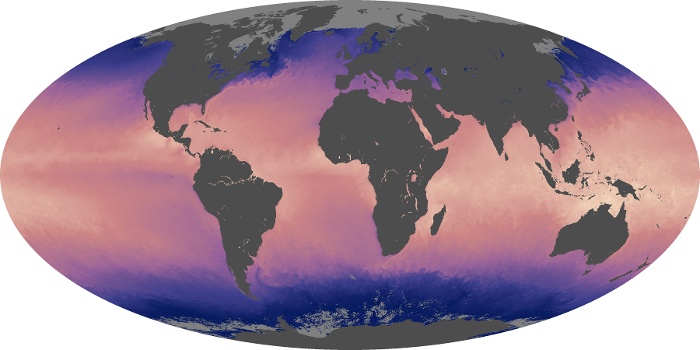
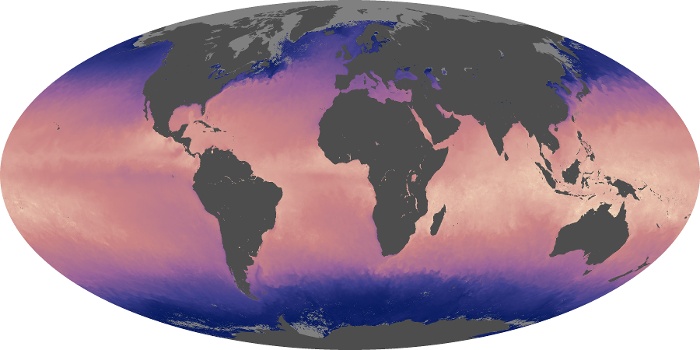

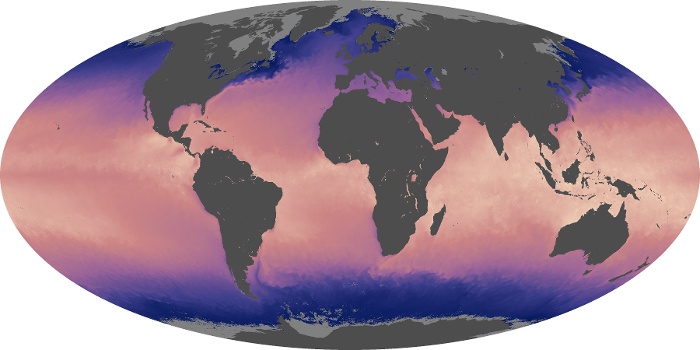
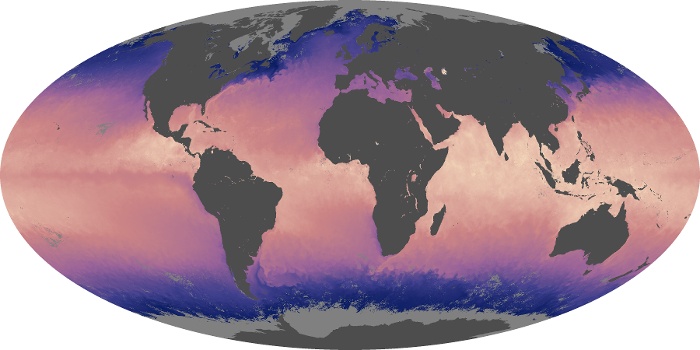
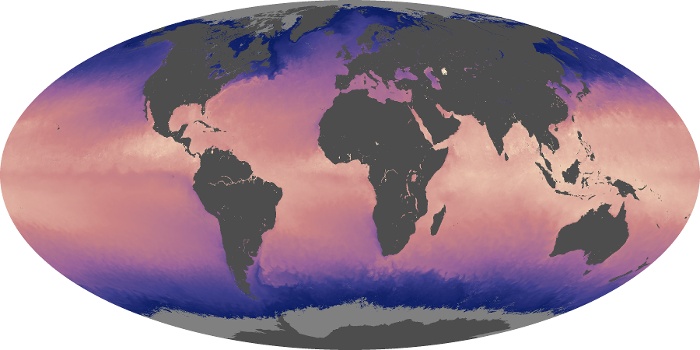
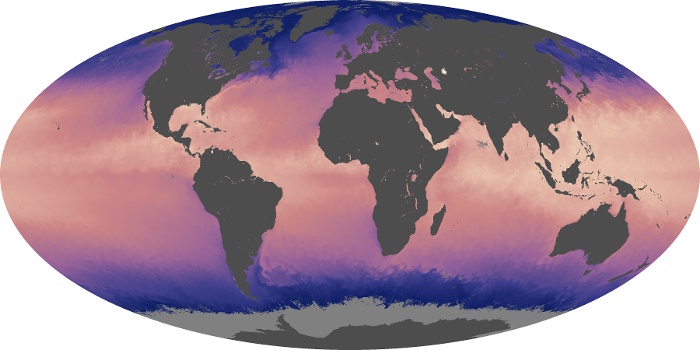

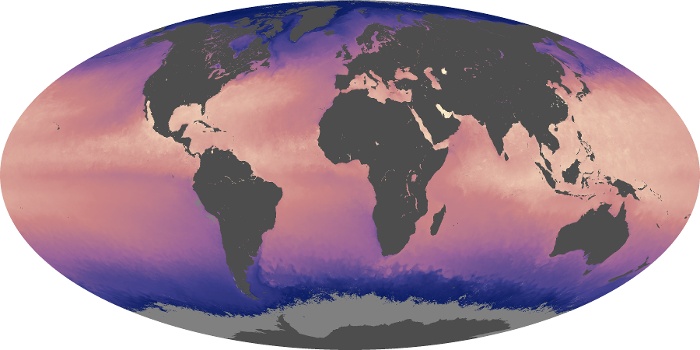

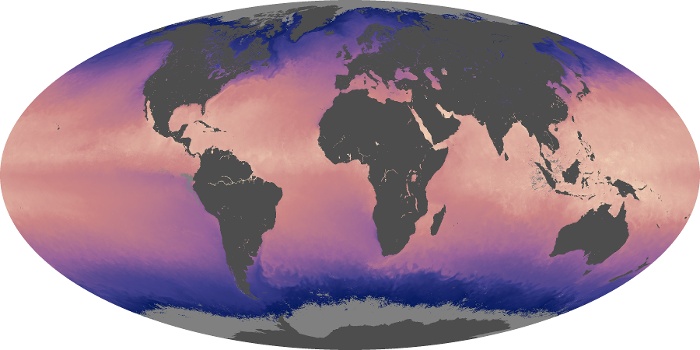
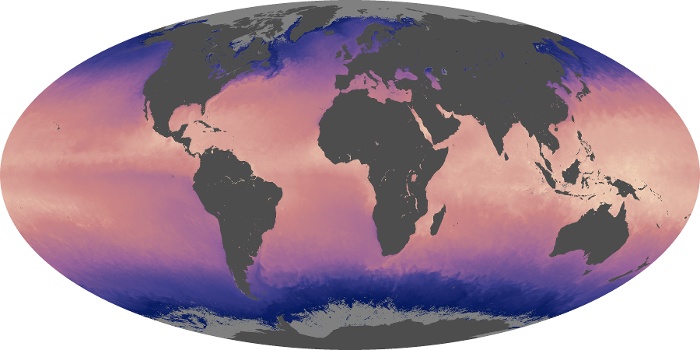

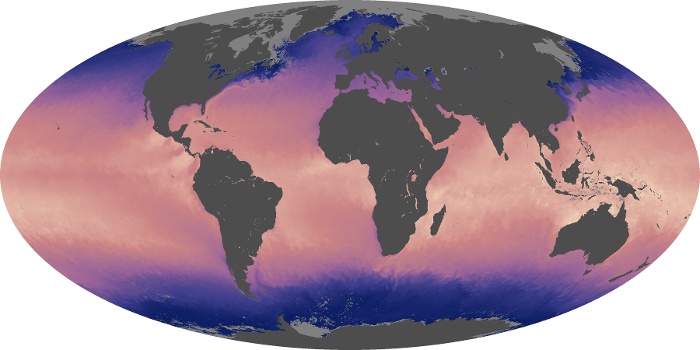
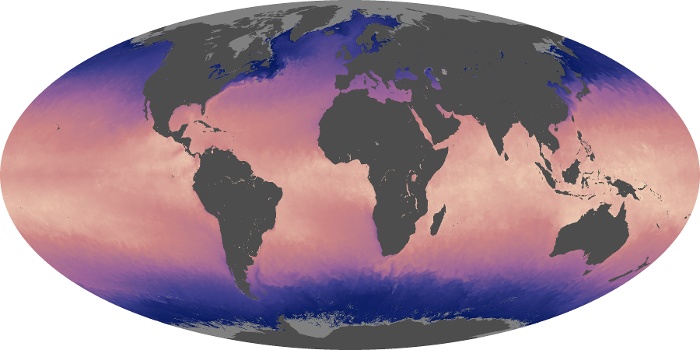

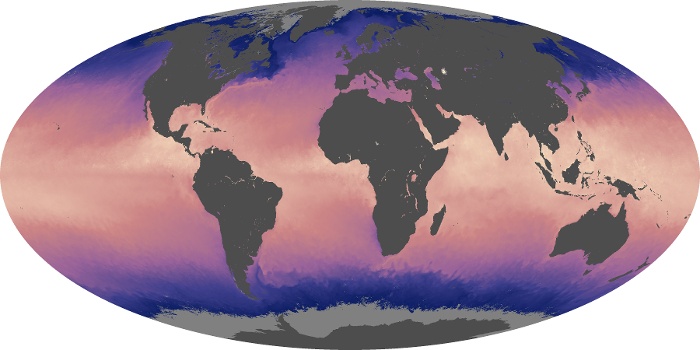
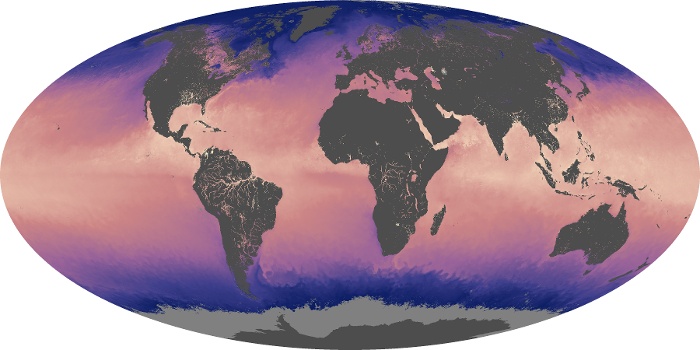
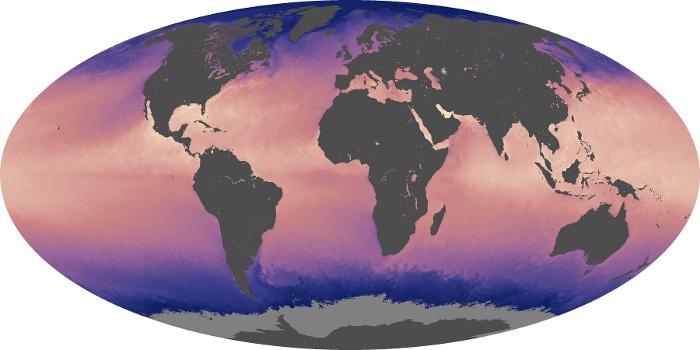
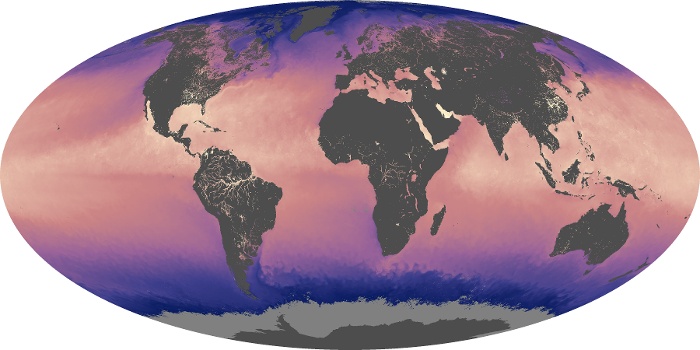
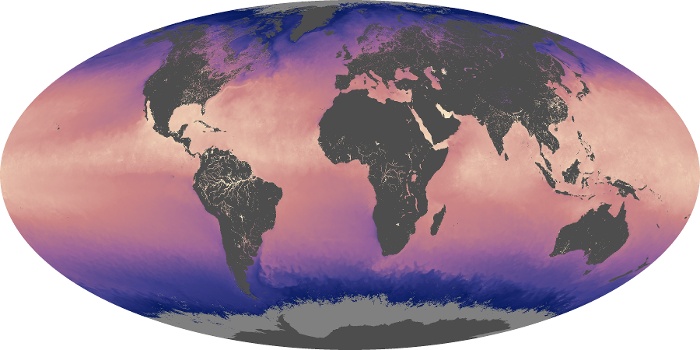
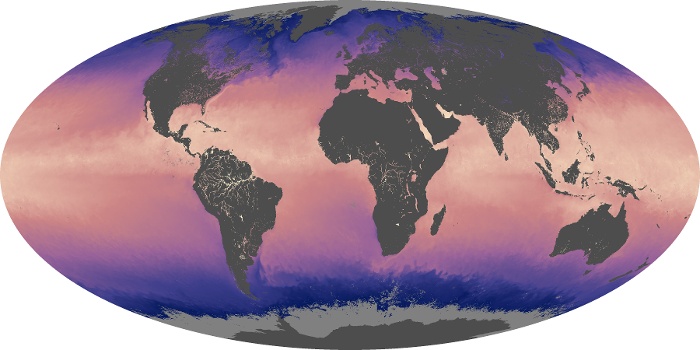
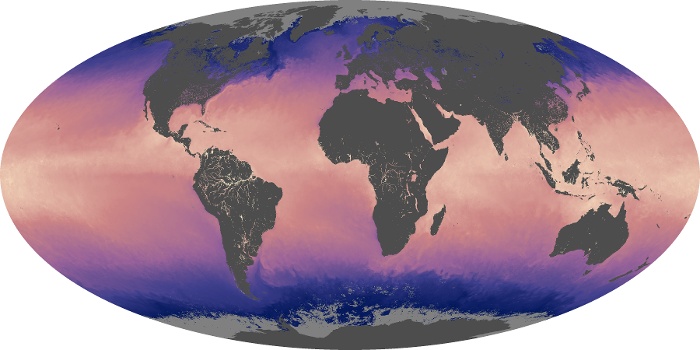
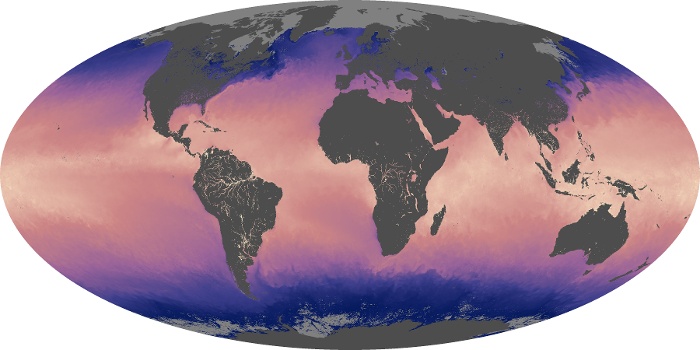


These sea surface temperature maps are based on observations by the MODIS sensors on NASA's Terra and Aqua satellites. The satellites measure the temperature of the top millimeter of the ocean surface. In this map, the coolest waters appear in blue (approximately -2 degrees Celsius), and the warmest temperatures appear in pink-yellow (35 degrees Celsius). Landmasses and the large area of sea ice around Antarctica appear in shades of gray, indicating no data were collected.
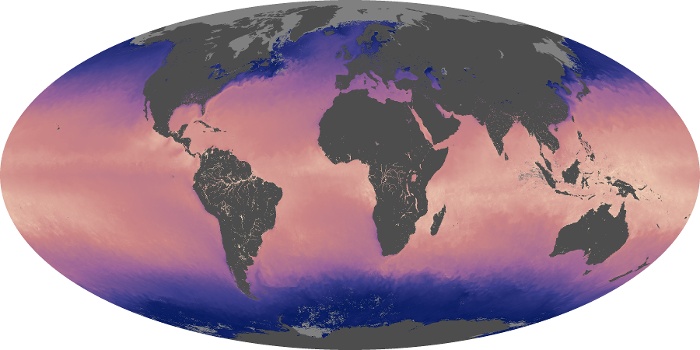
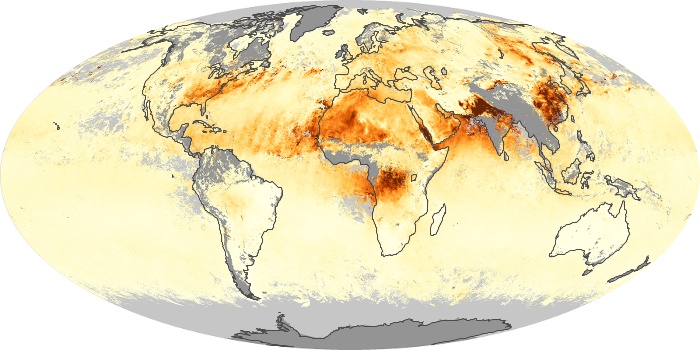
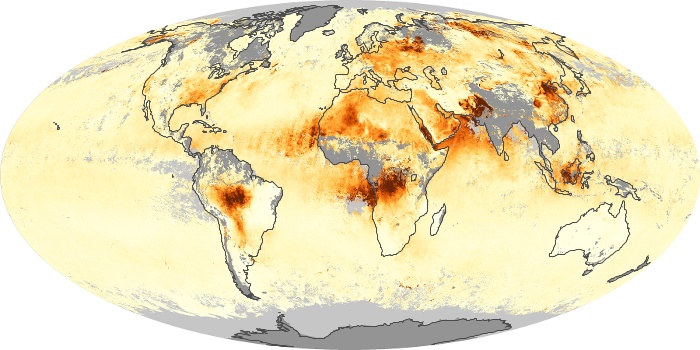
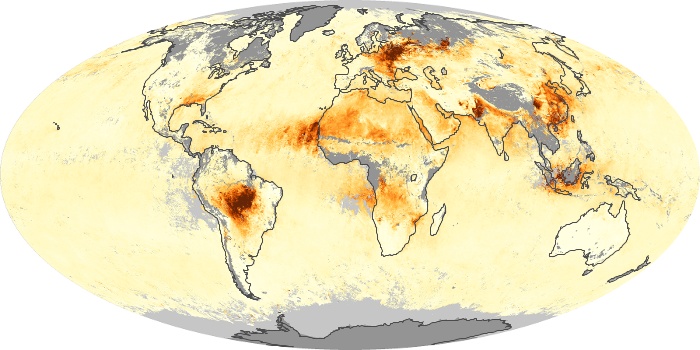
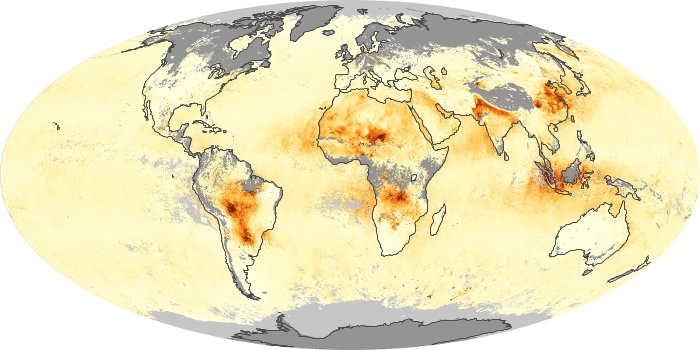
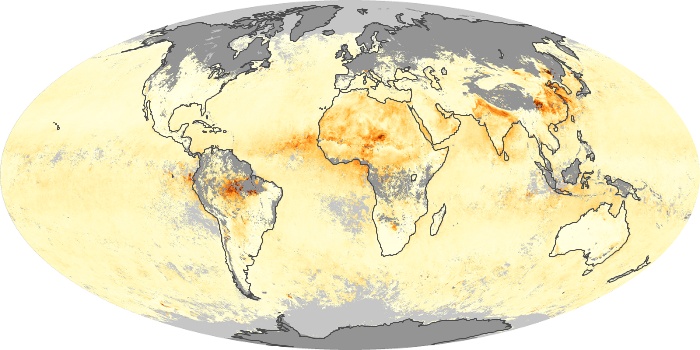
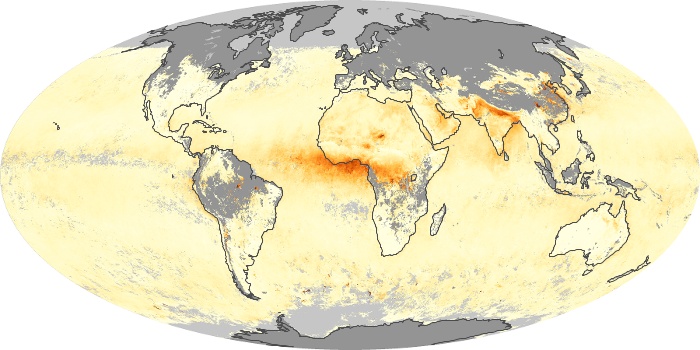
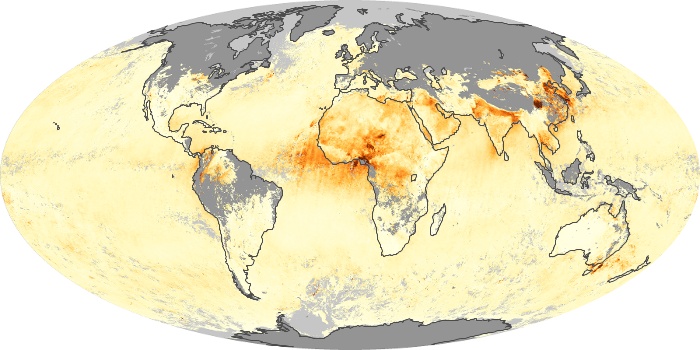
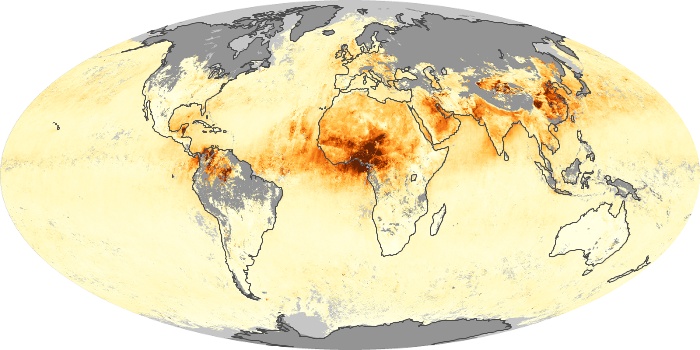
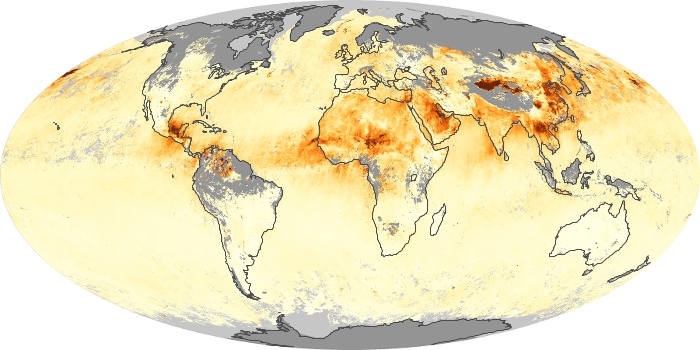
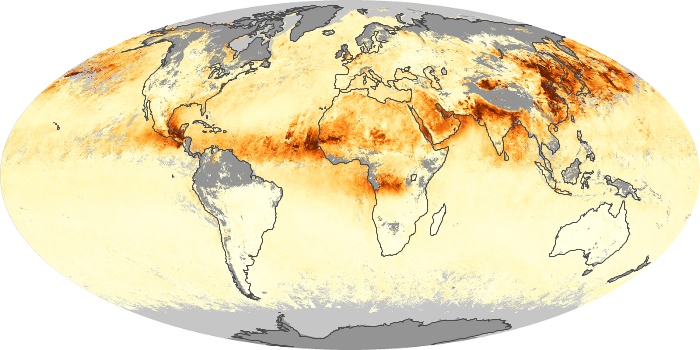
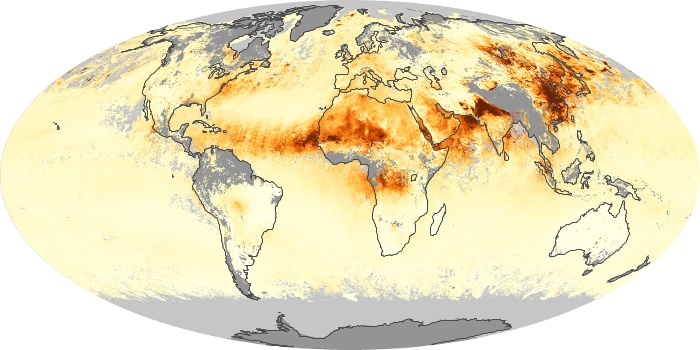
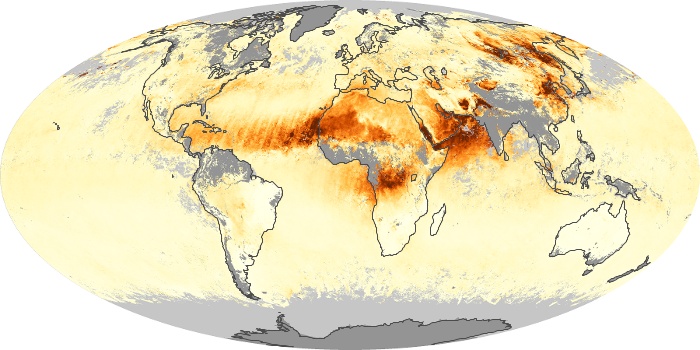
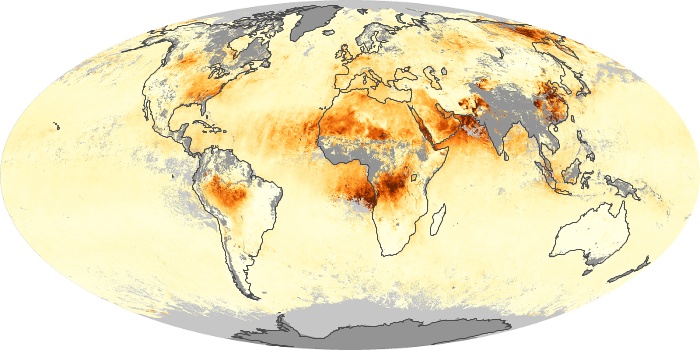
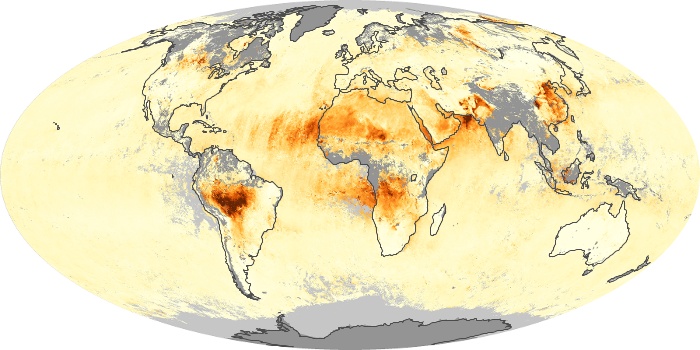
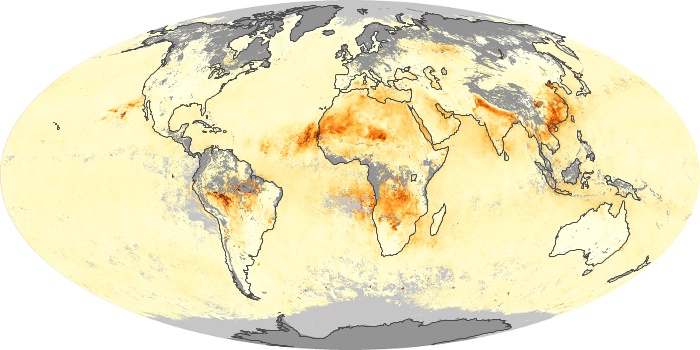
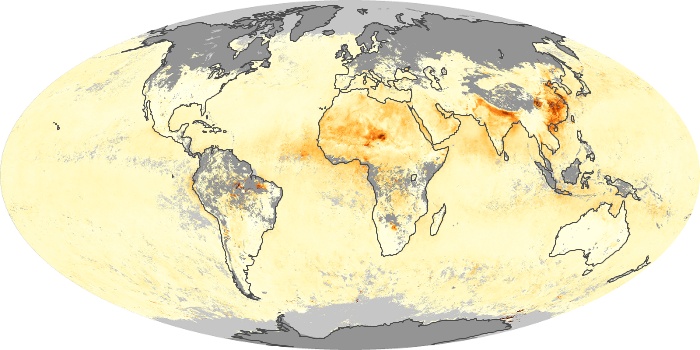
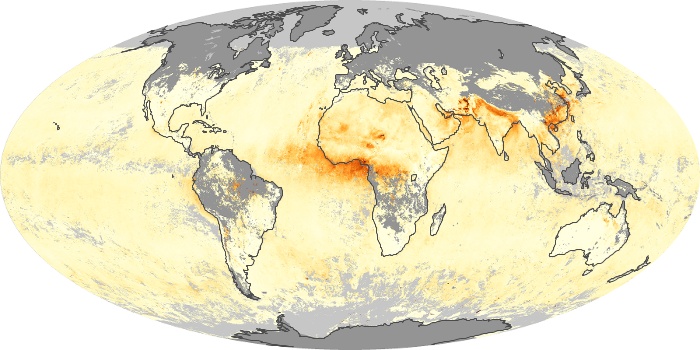
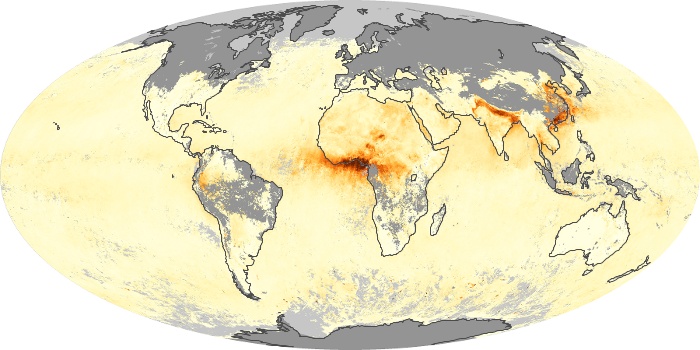
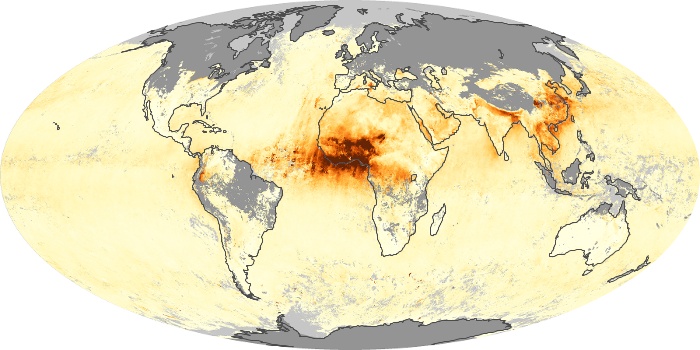
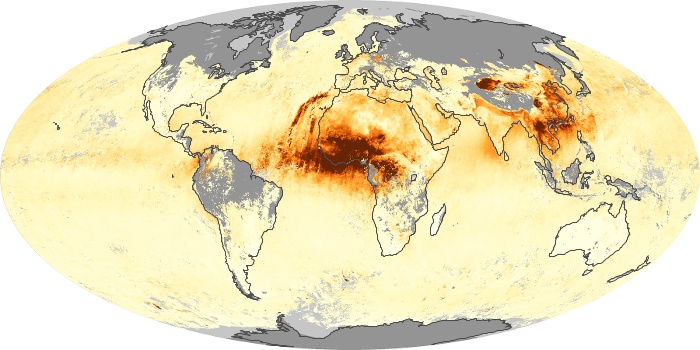
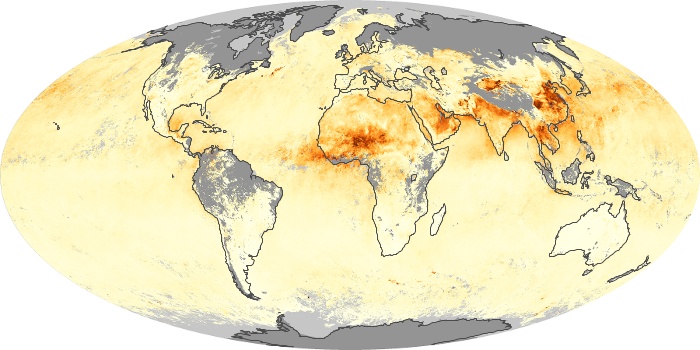
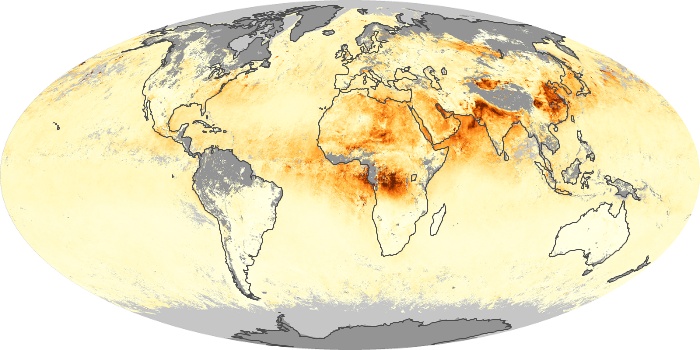
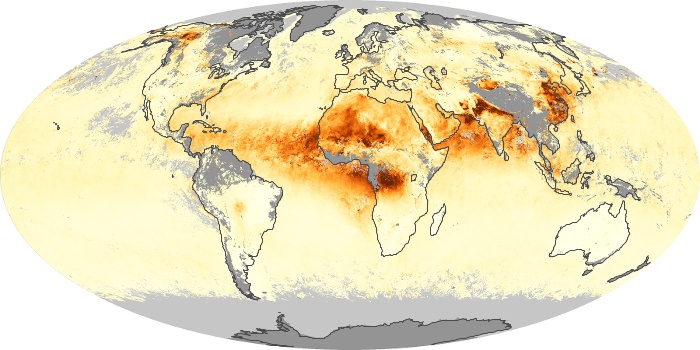
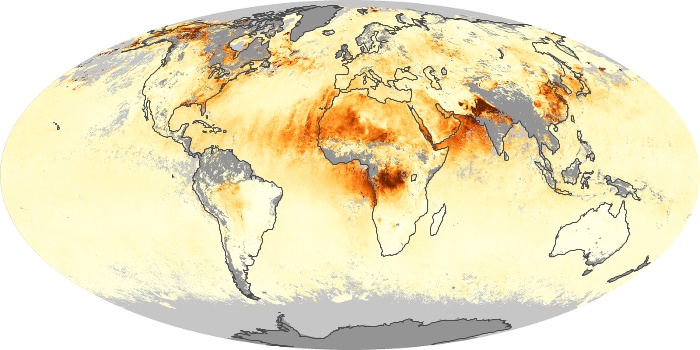
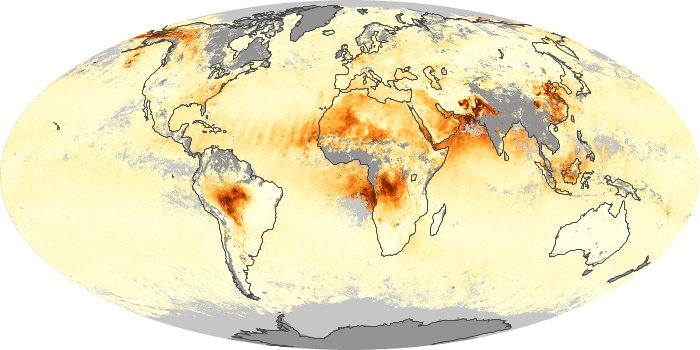
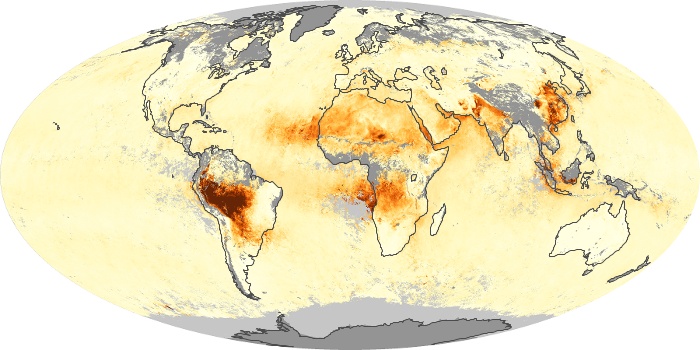
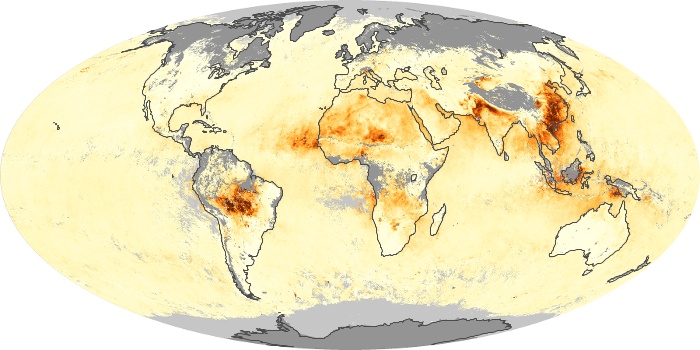
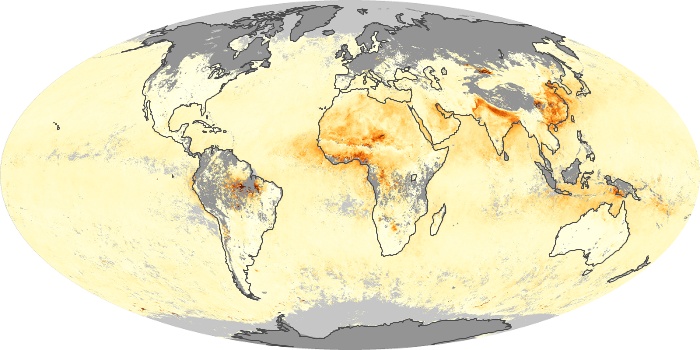
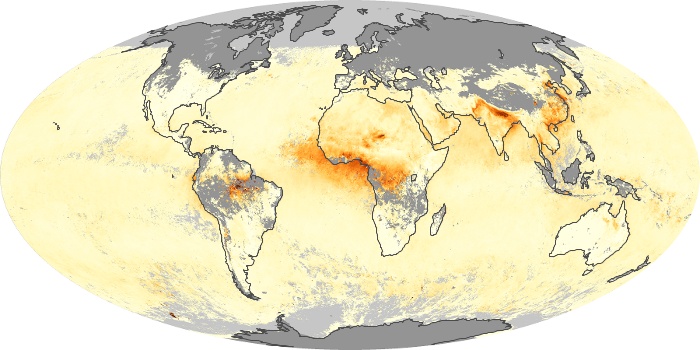
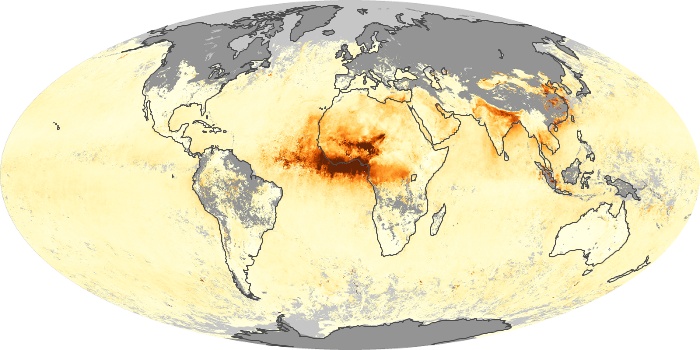
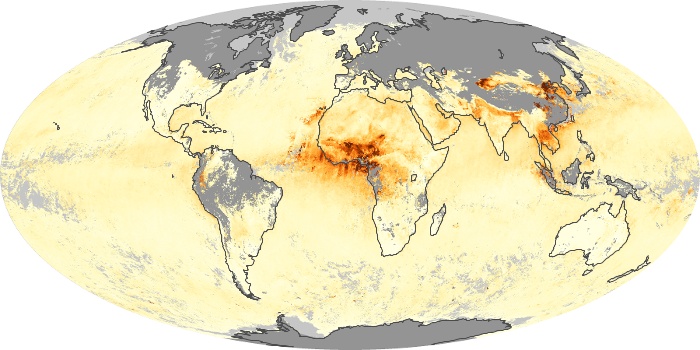
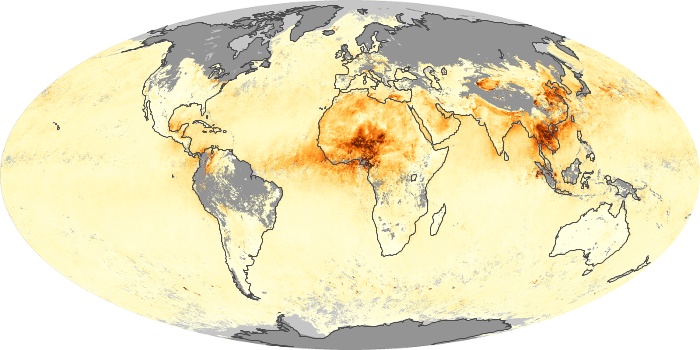
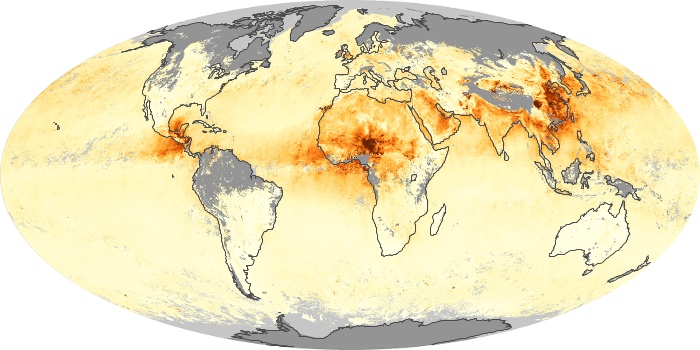
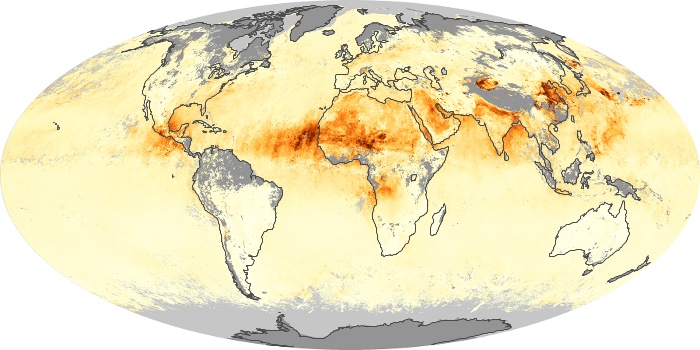
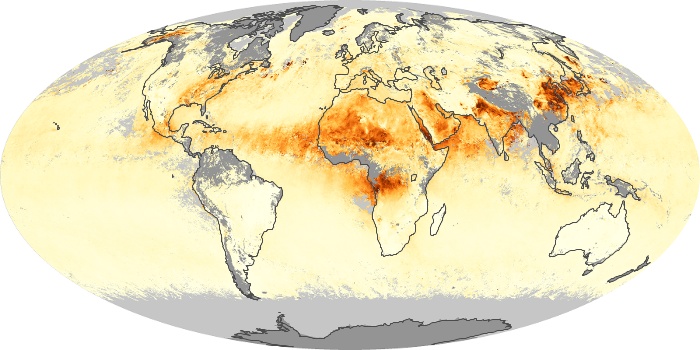
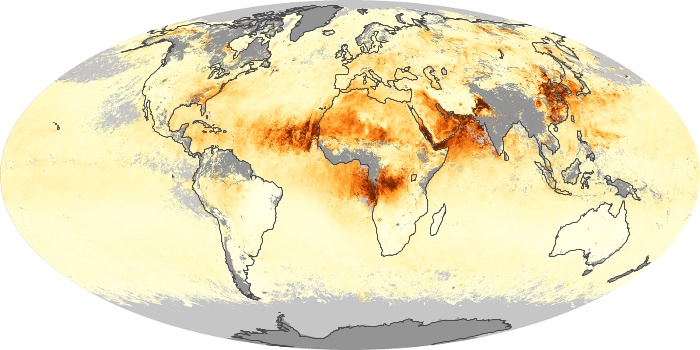
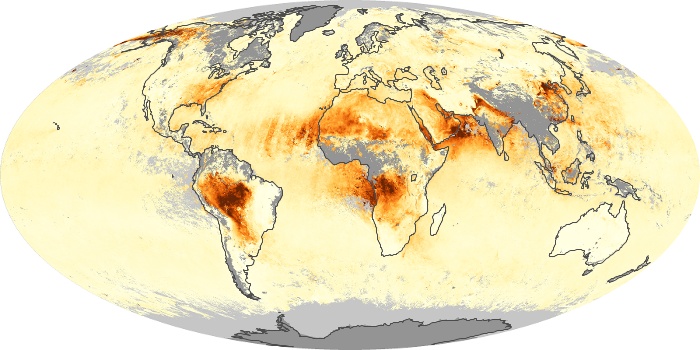
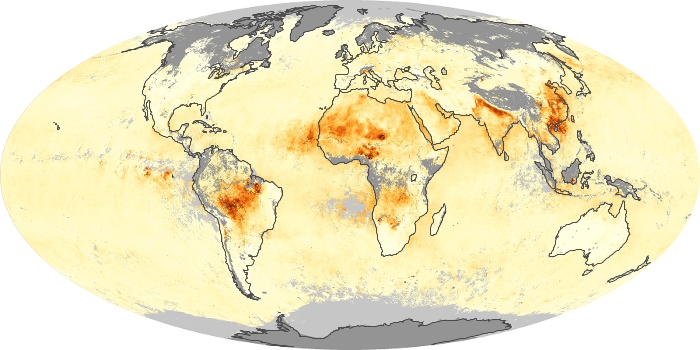
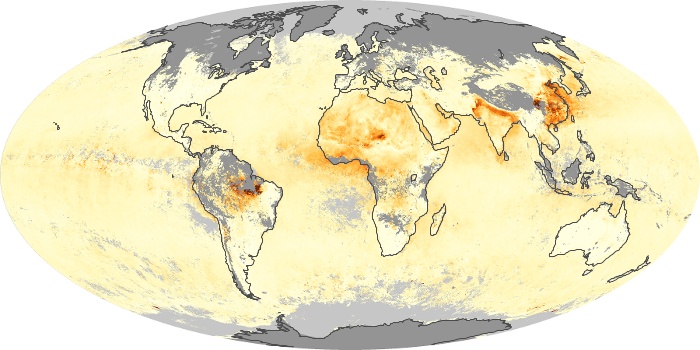
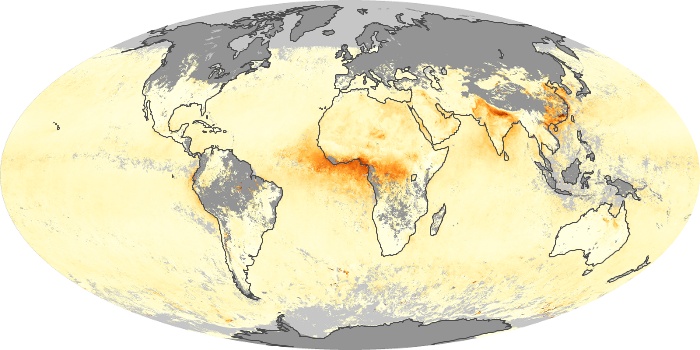
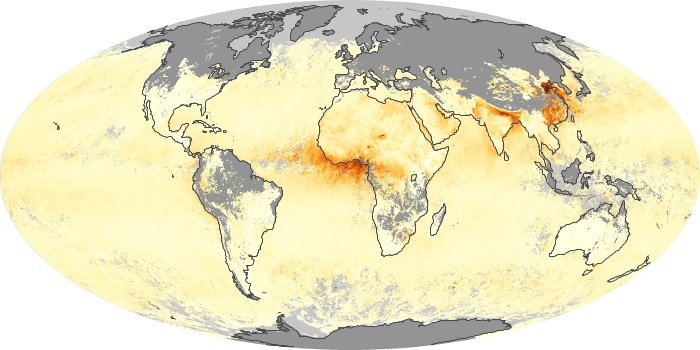
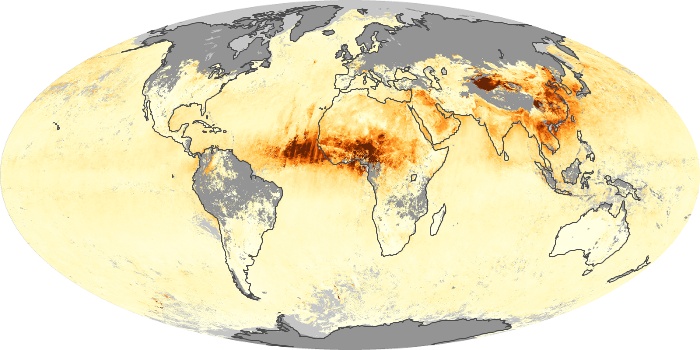
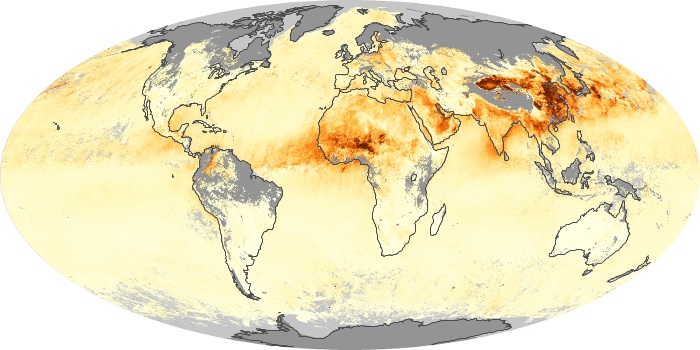
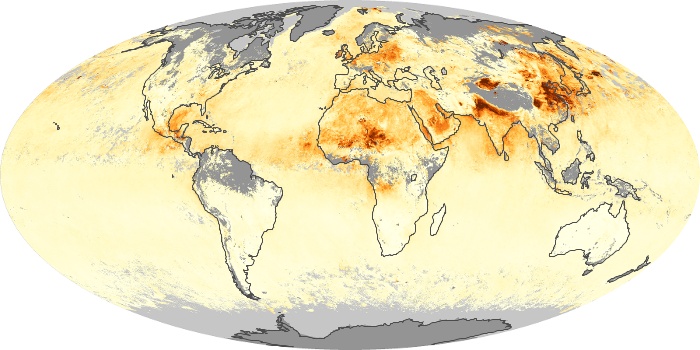
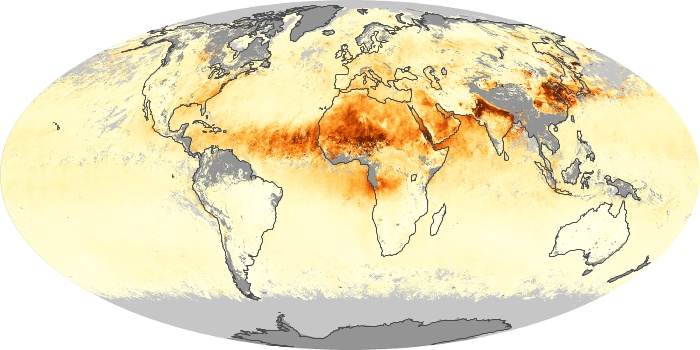
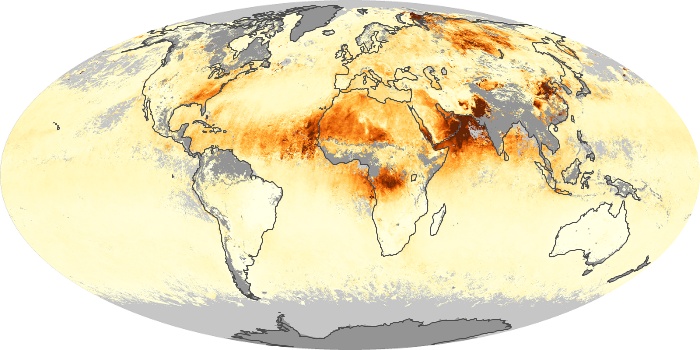
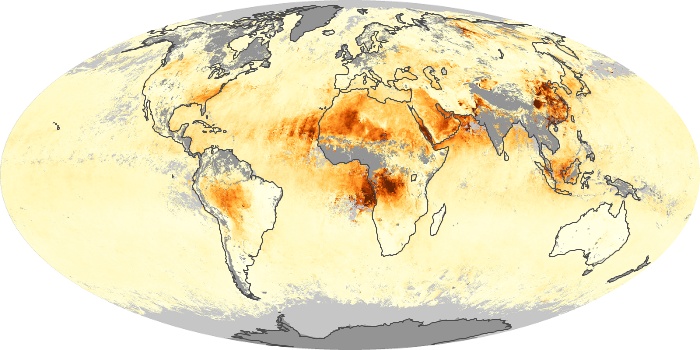
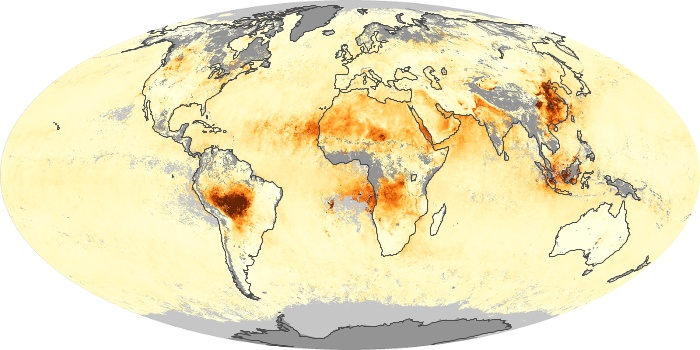
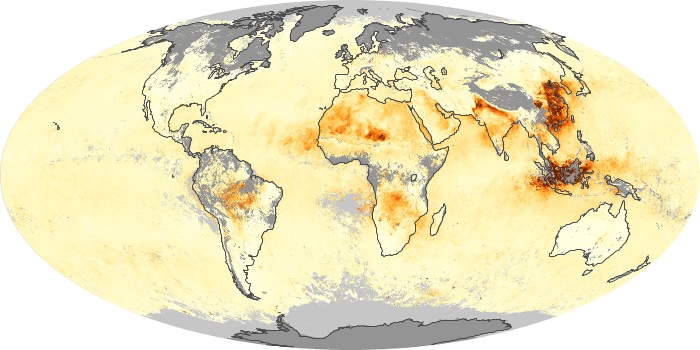
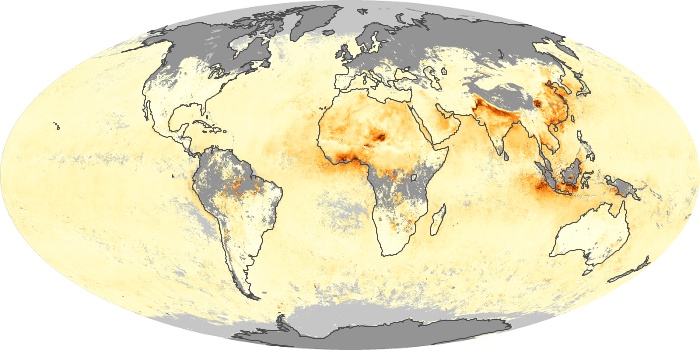
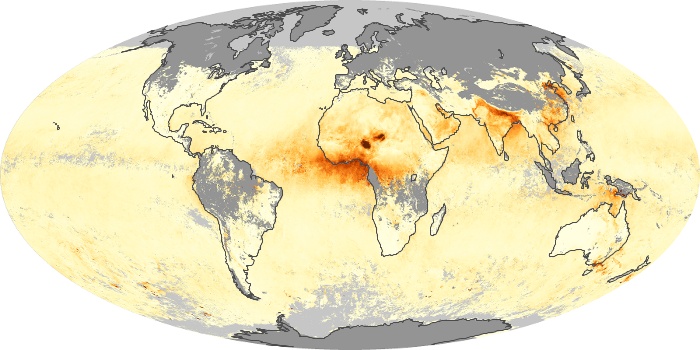
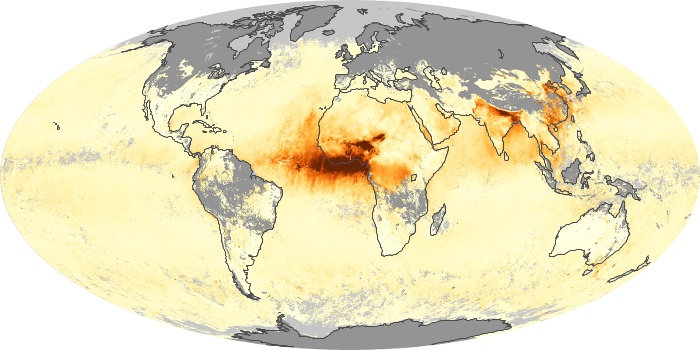
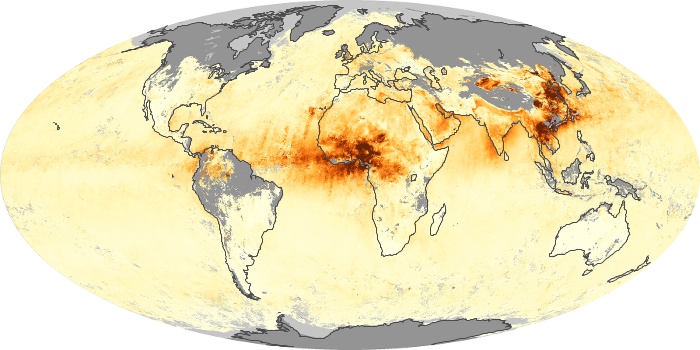
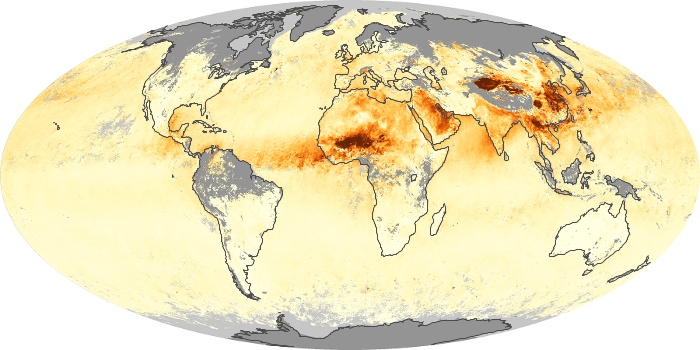
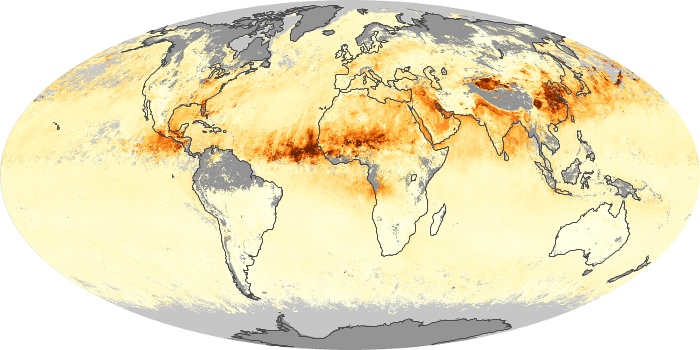
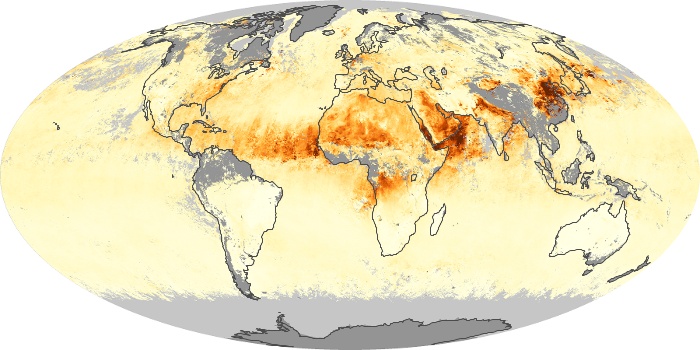
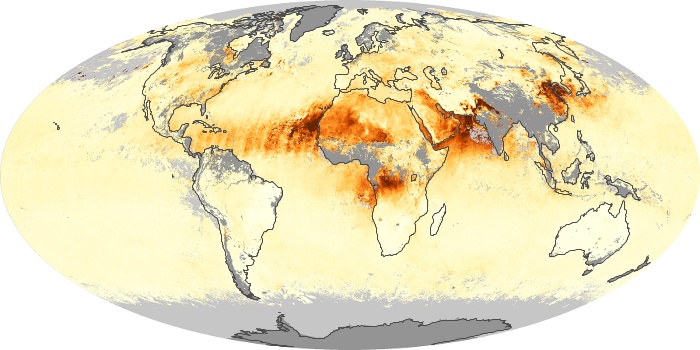
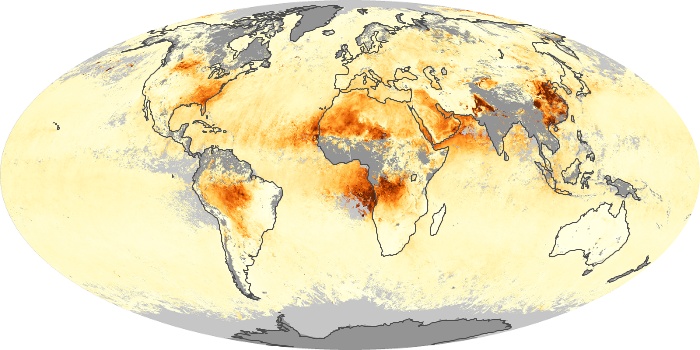
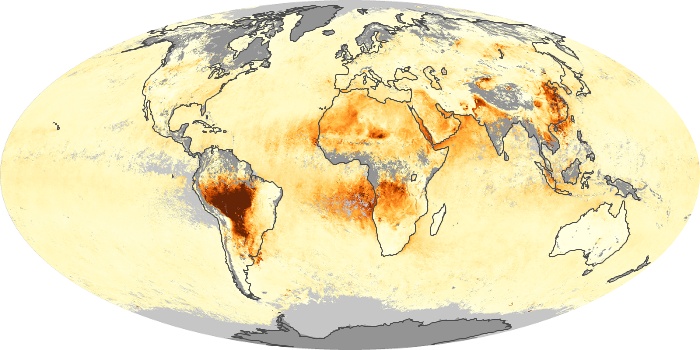
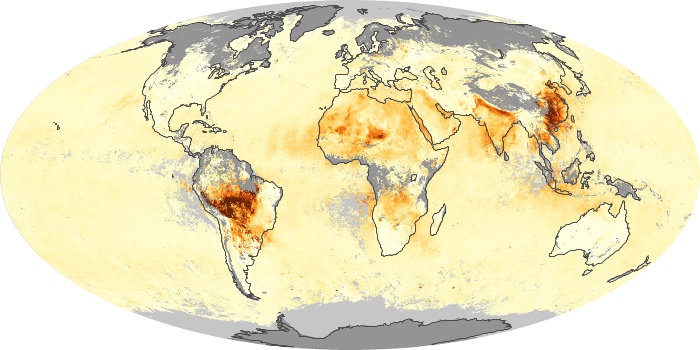
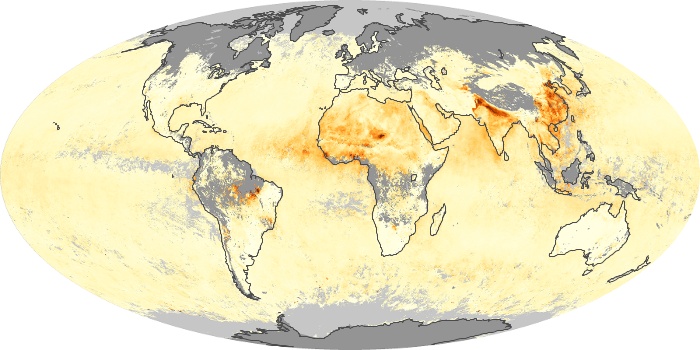
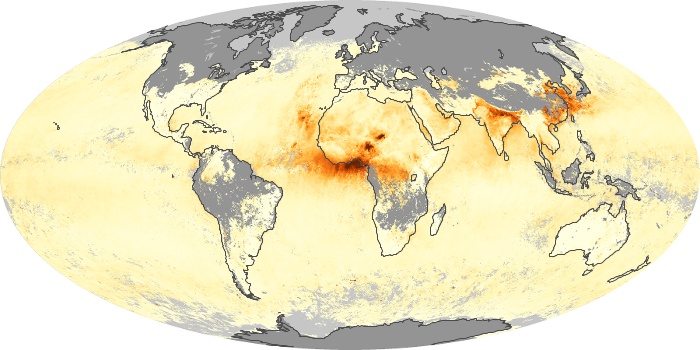
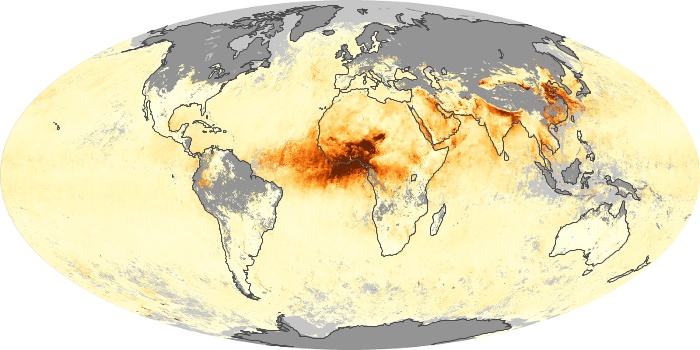
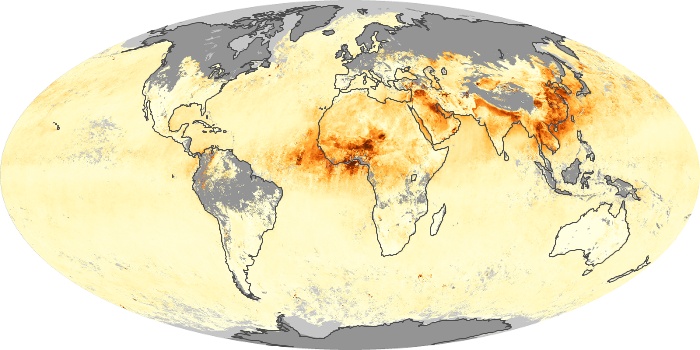
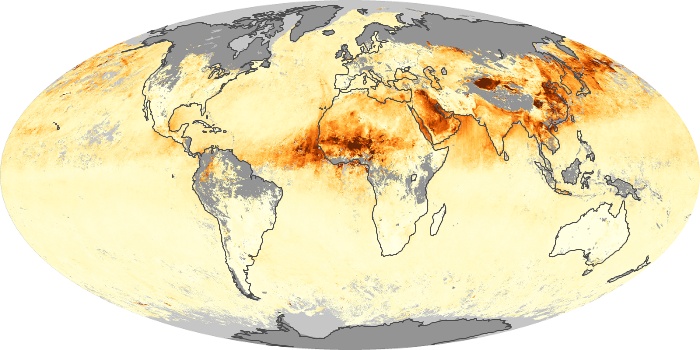
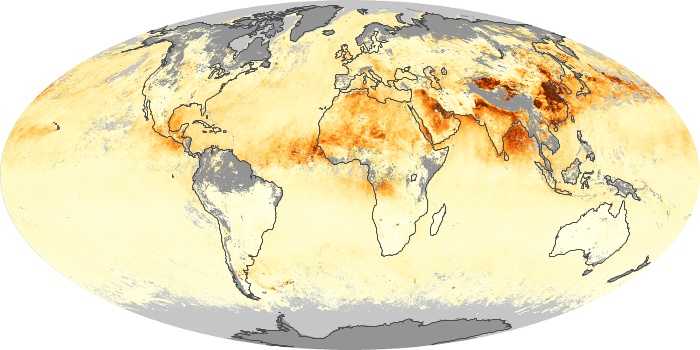
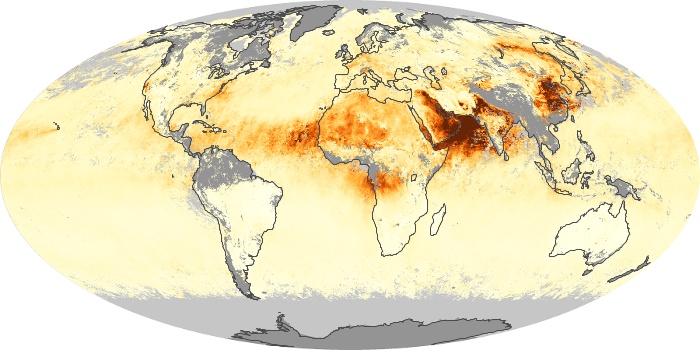
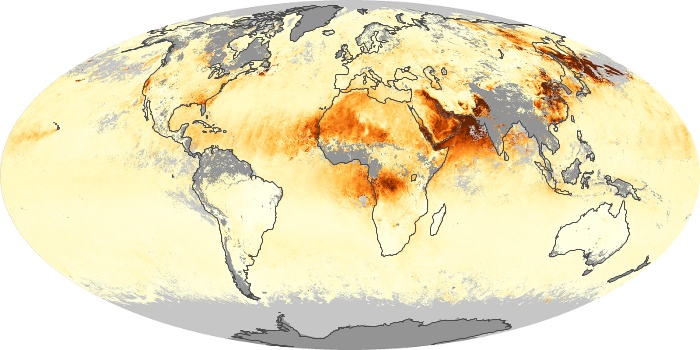
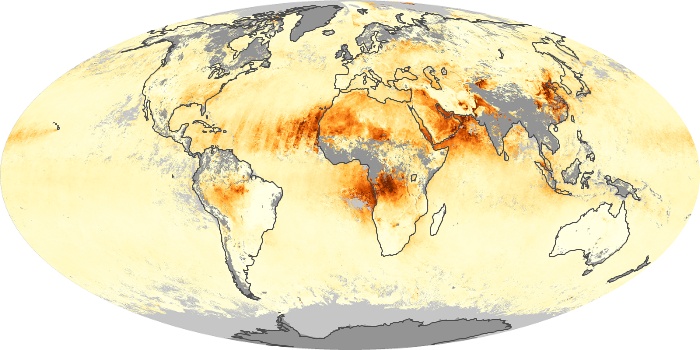
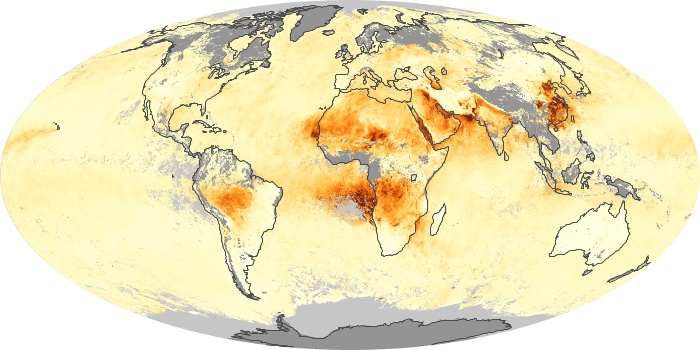
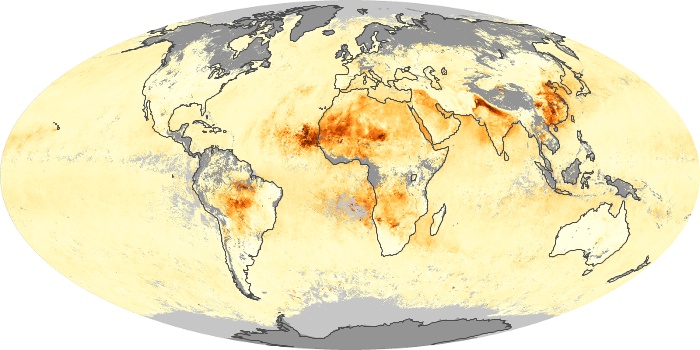
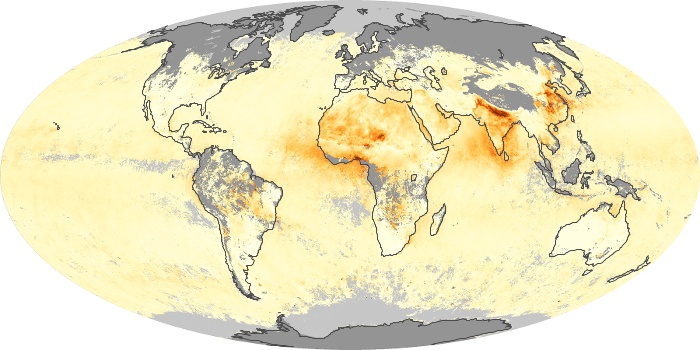
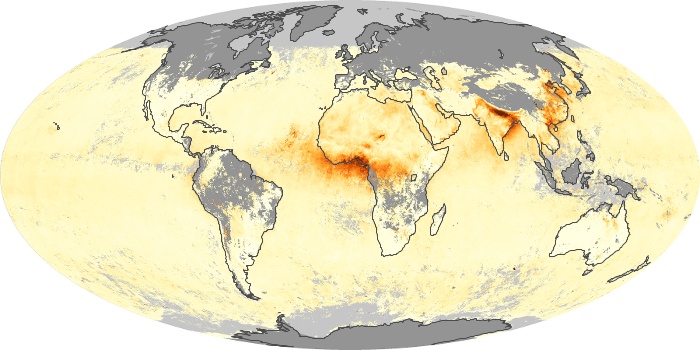
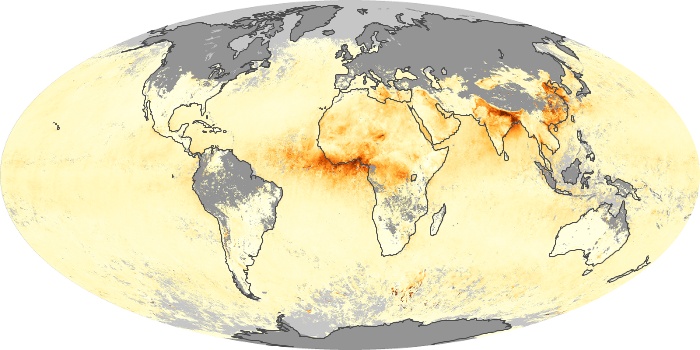
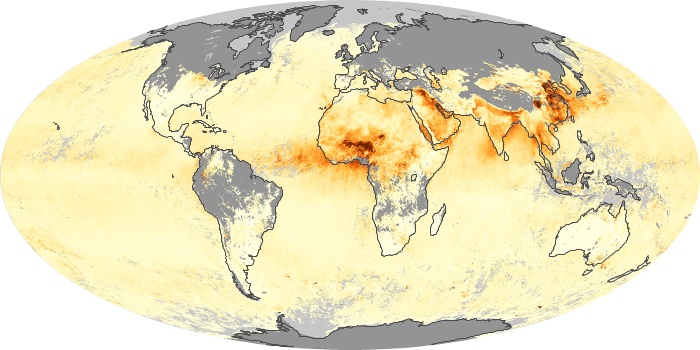
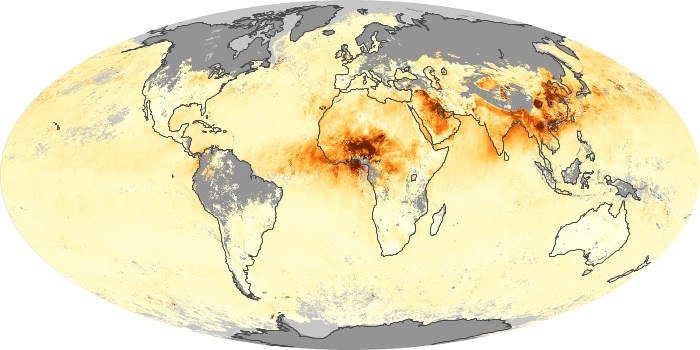
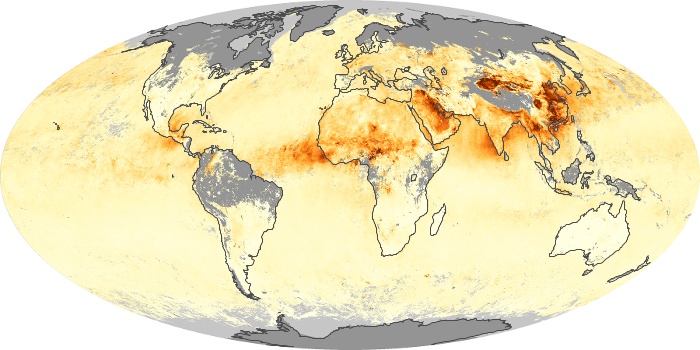
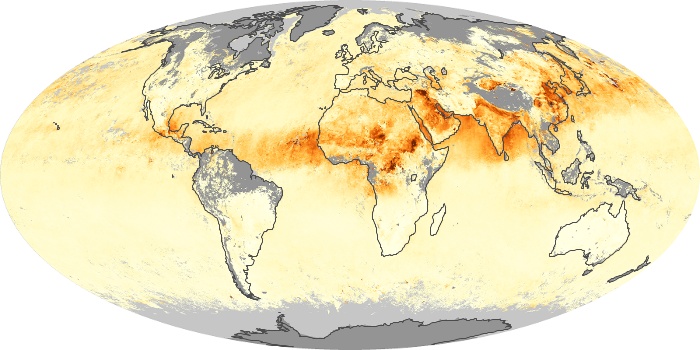
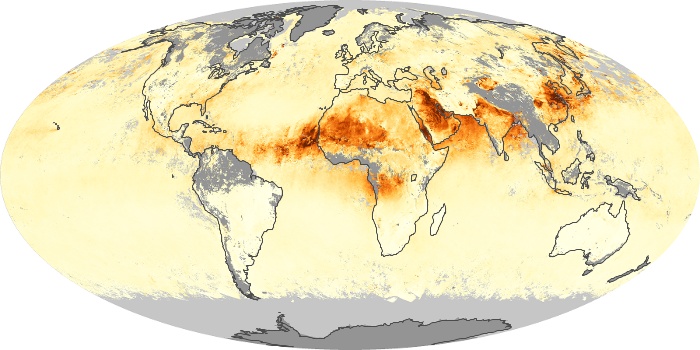
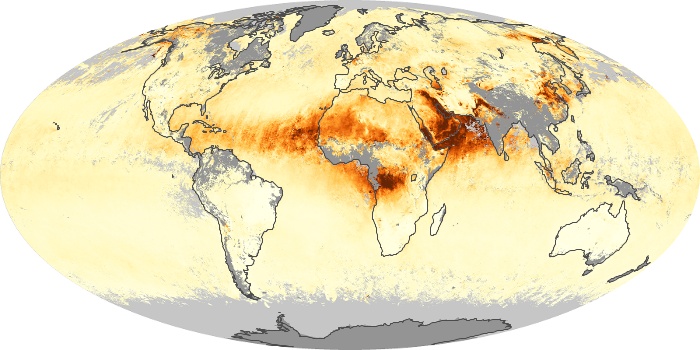
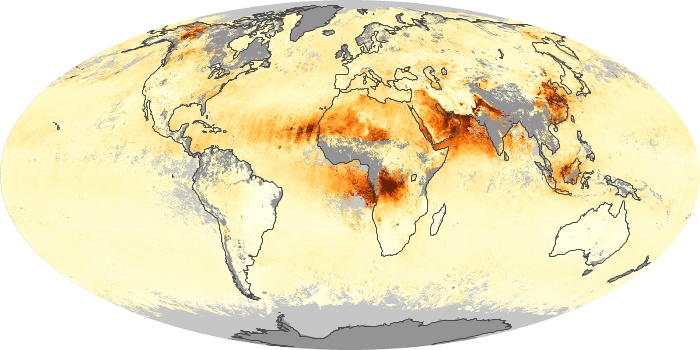
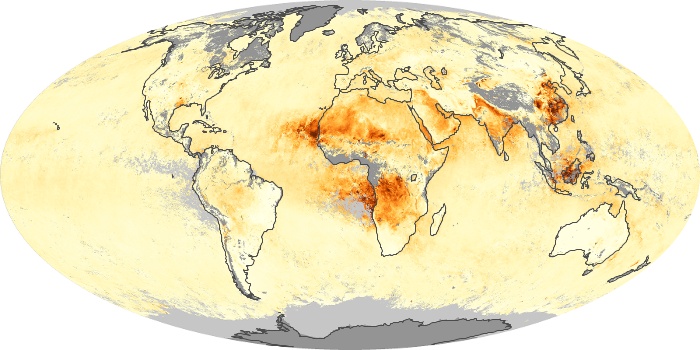
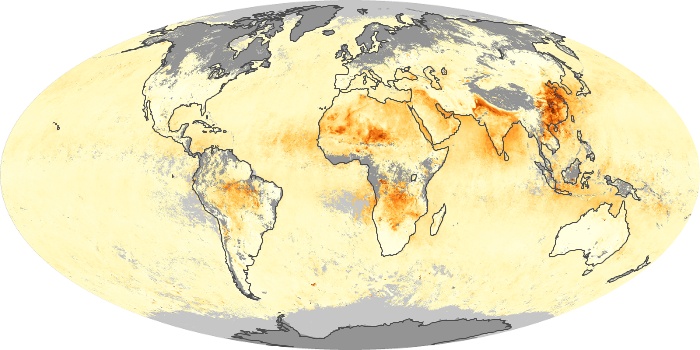
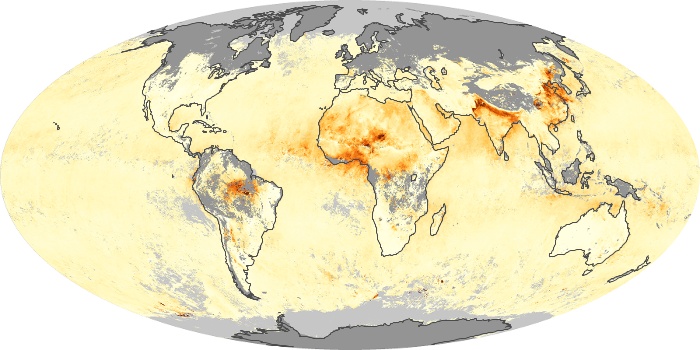
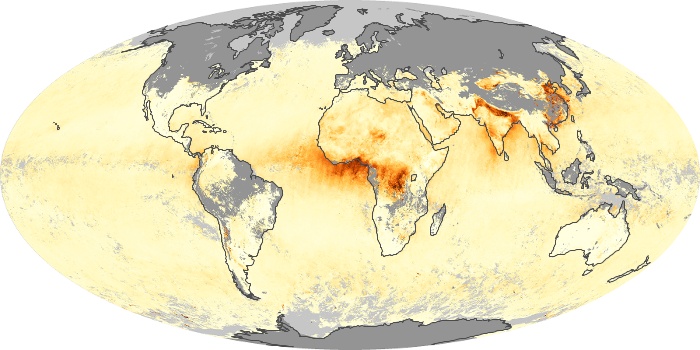
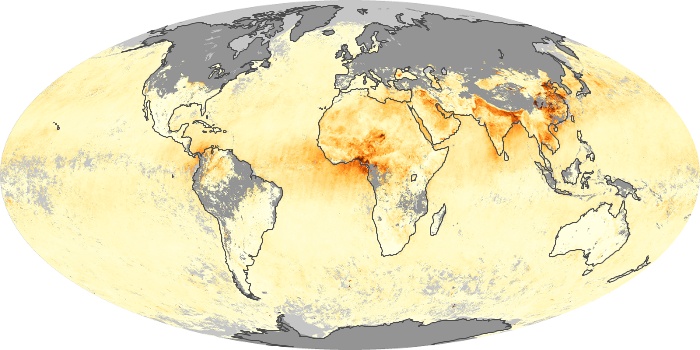
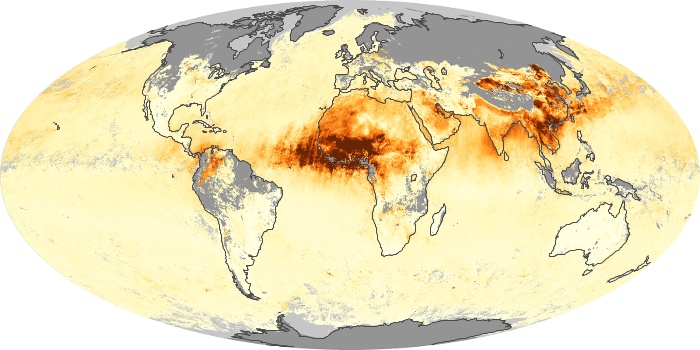
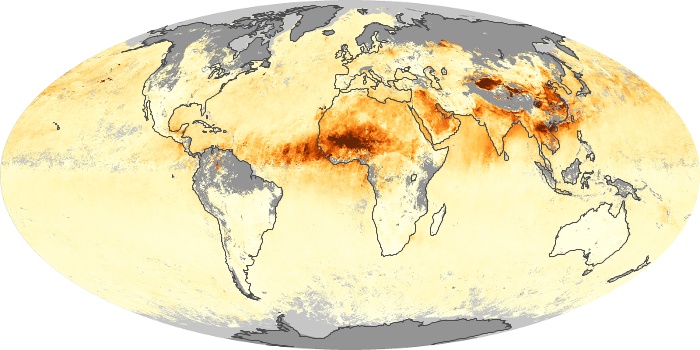
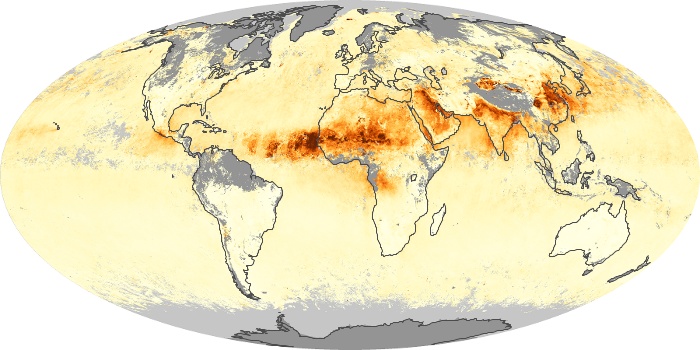
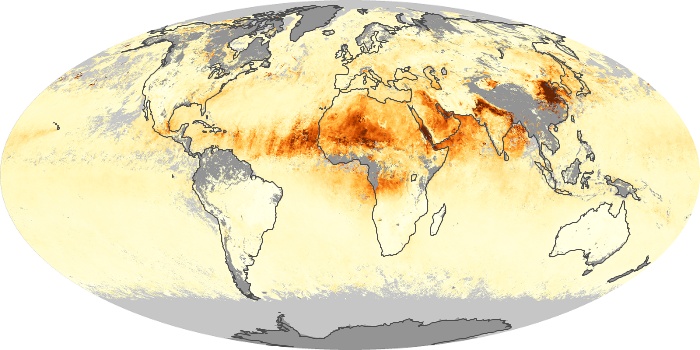
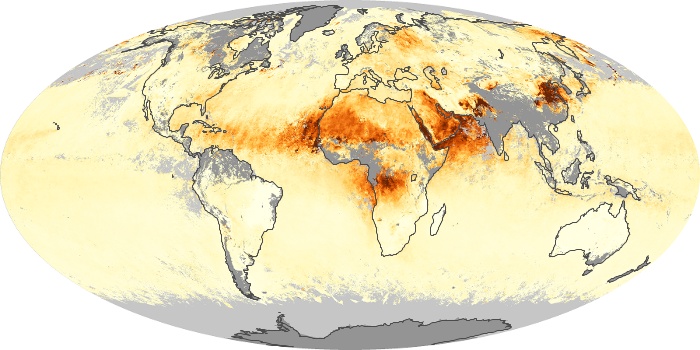
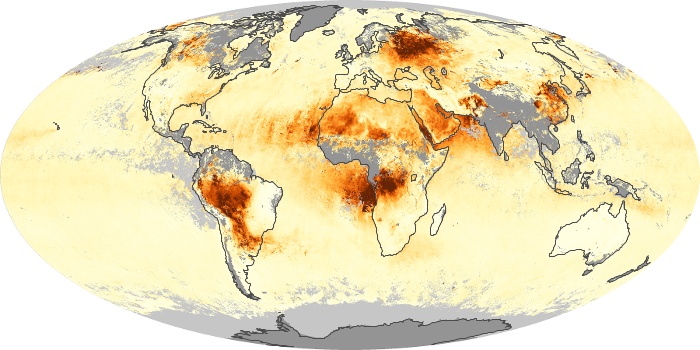
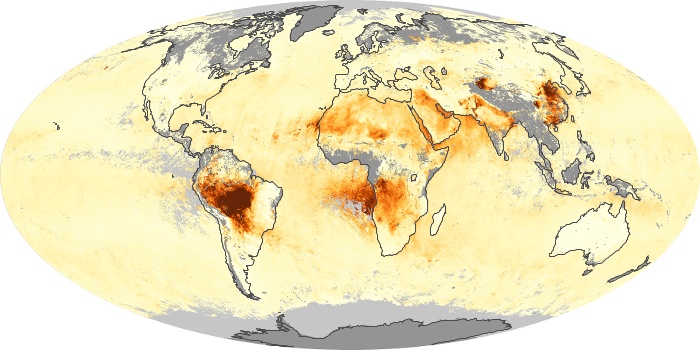
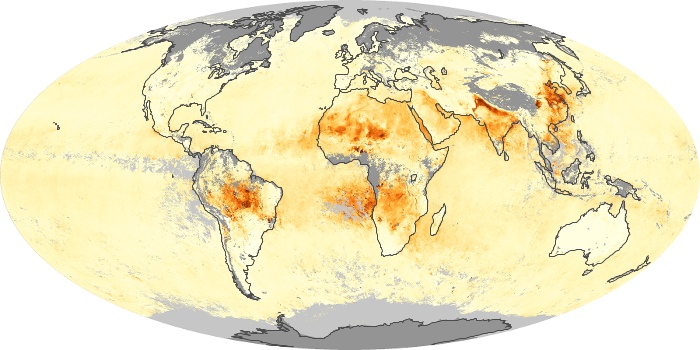
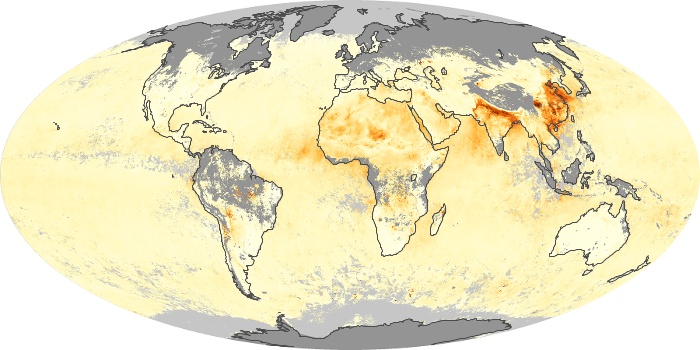
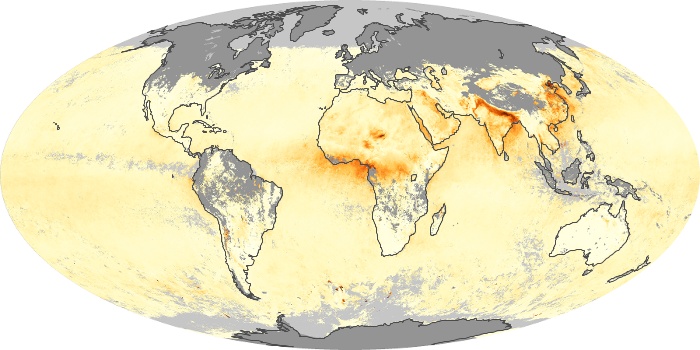
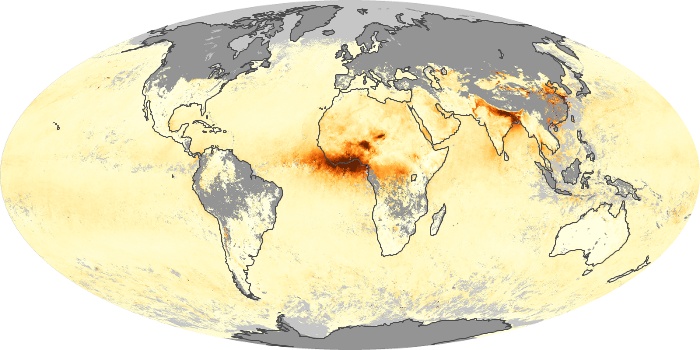
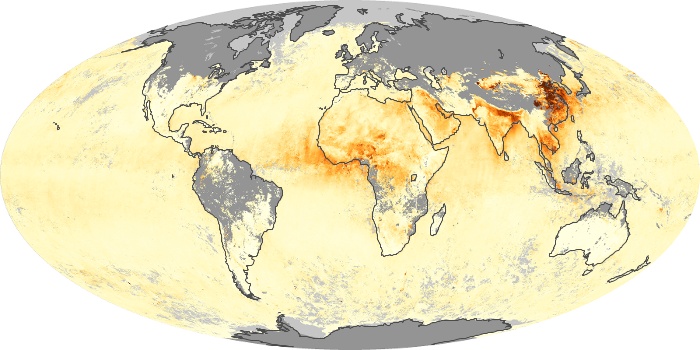
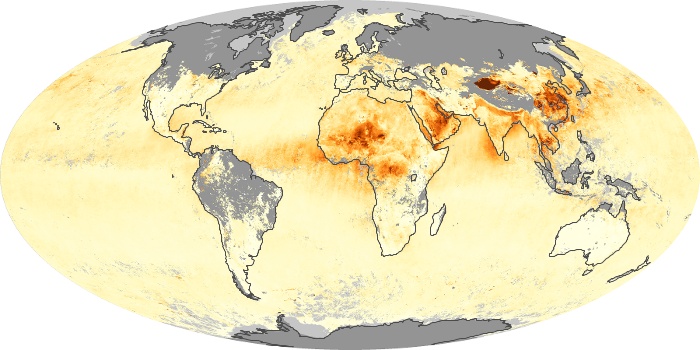
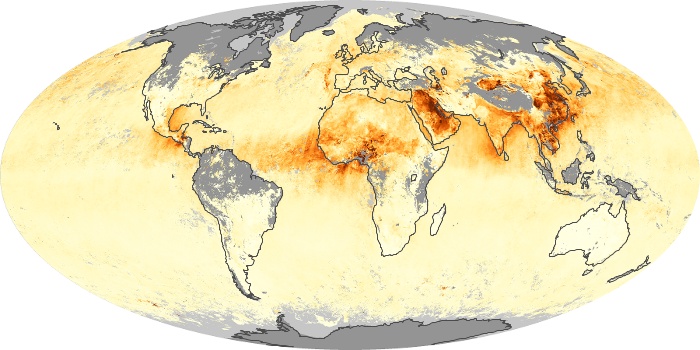
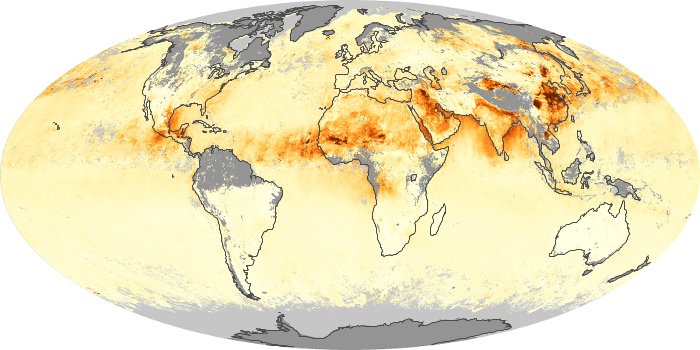
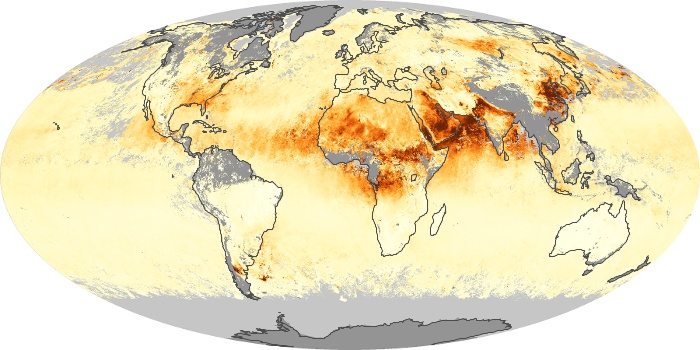
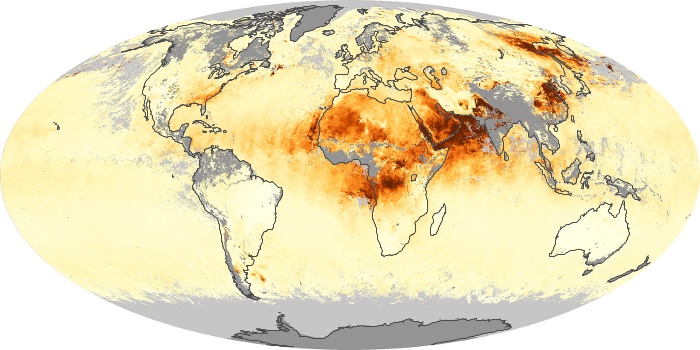
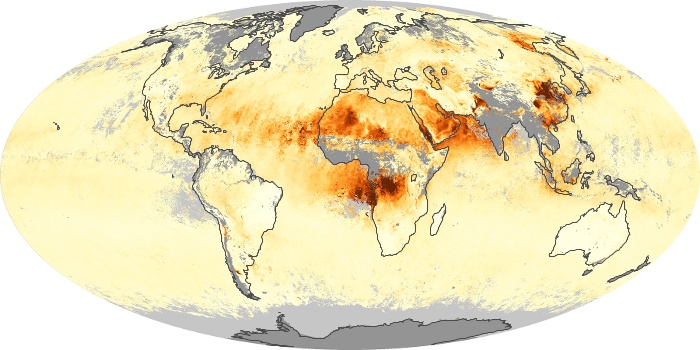
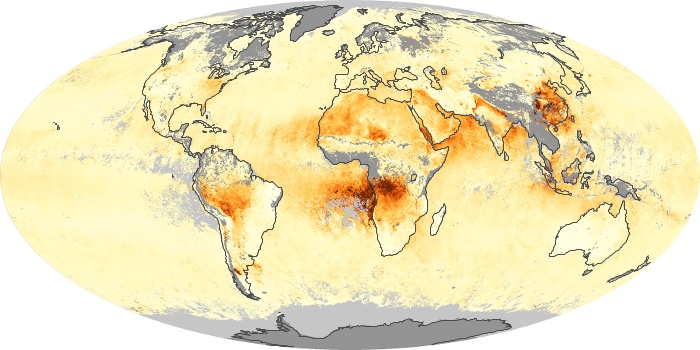
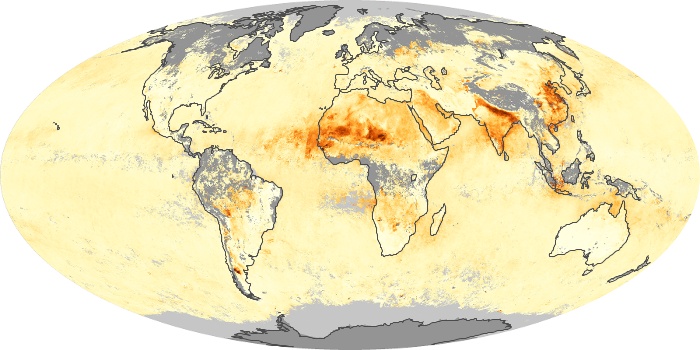
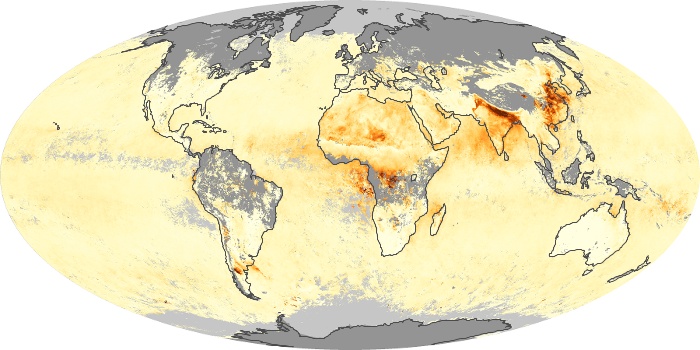
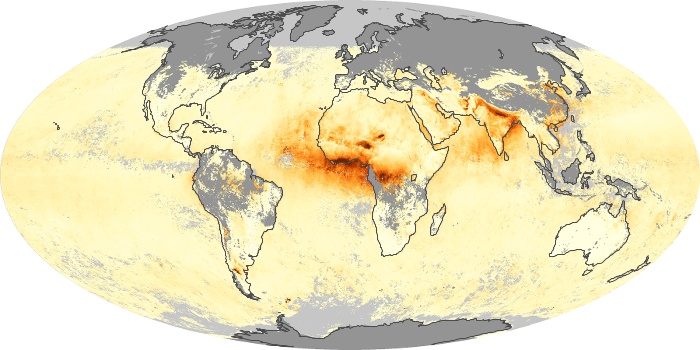
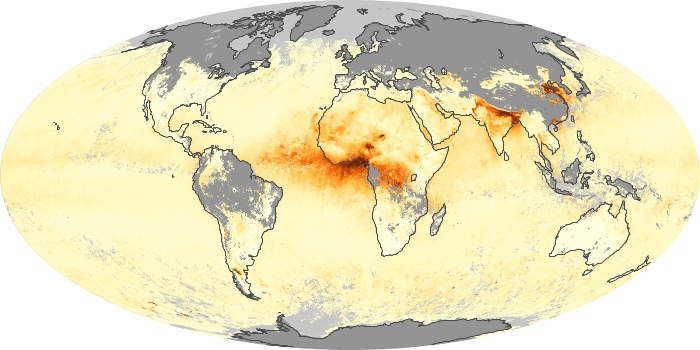
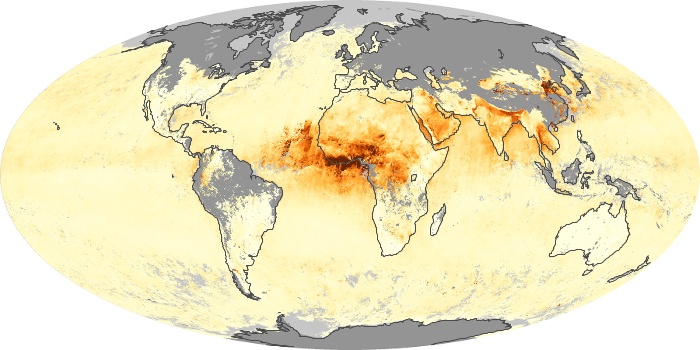
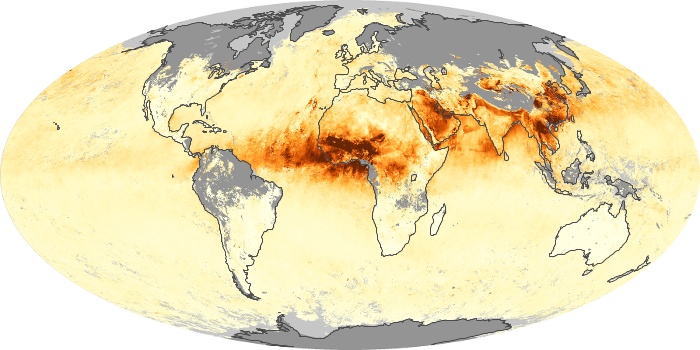
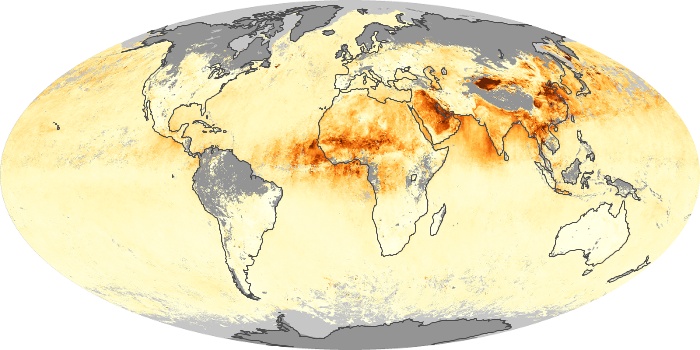
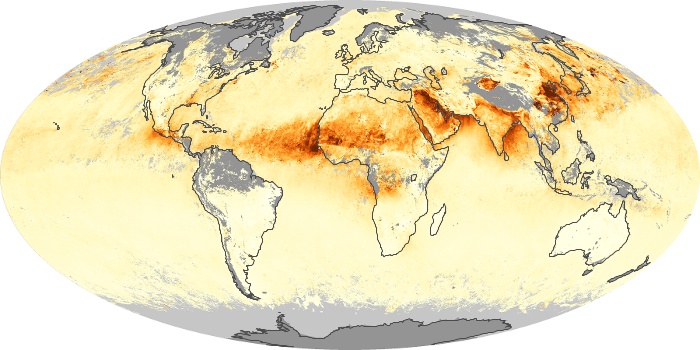
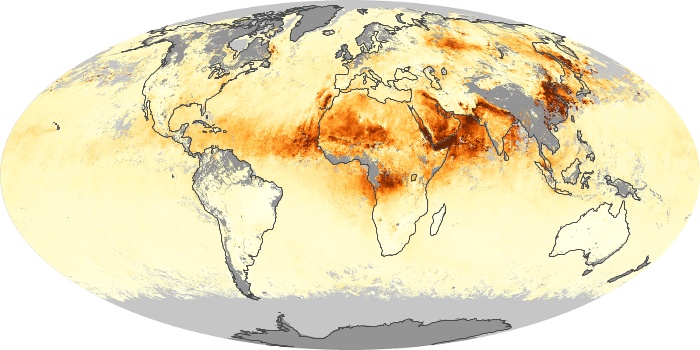
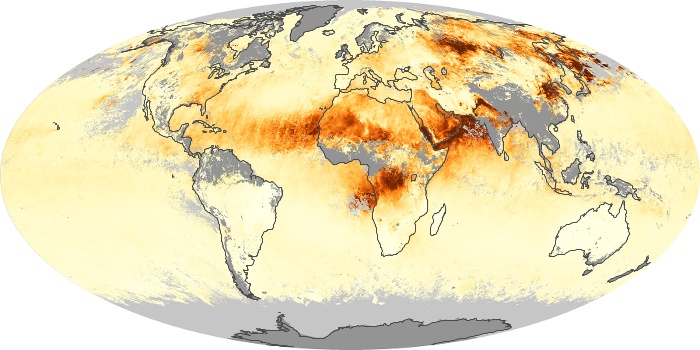
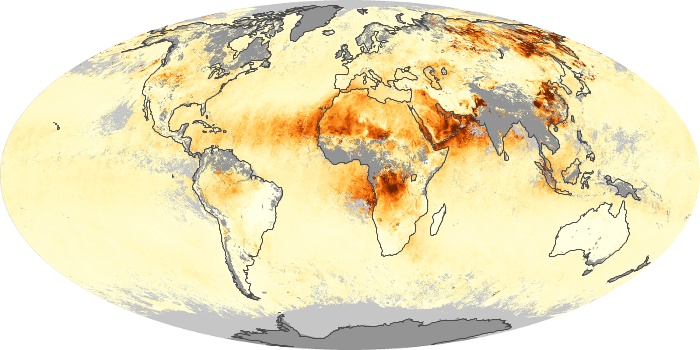
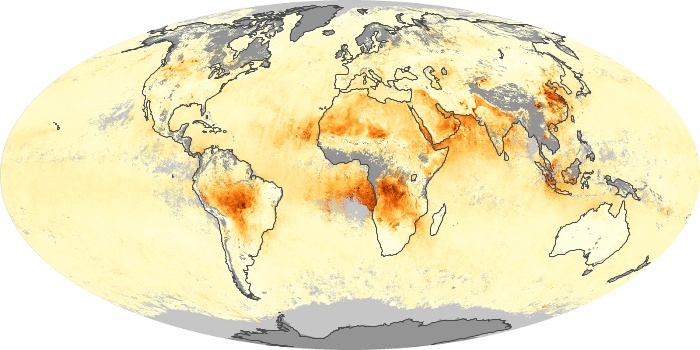
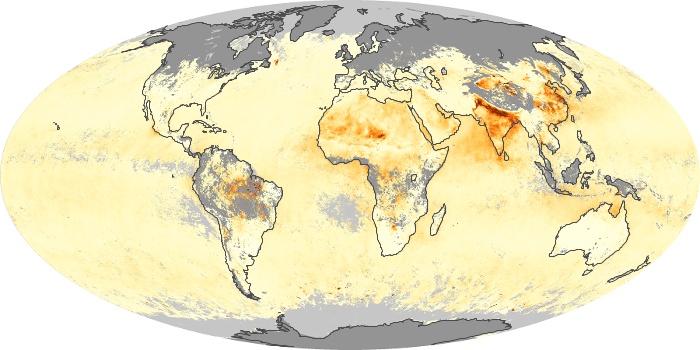
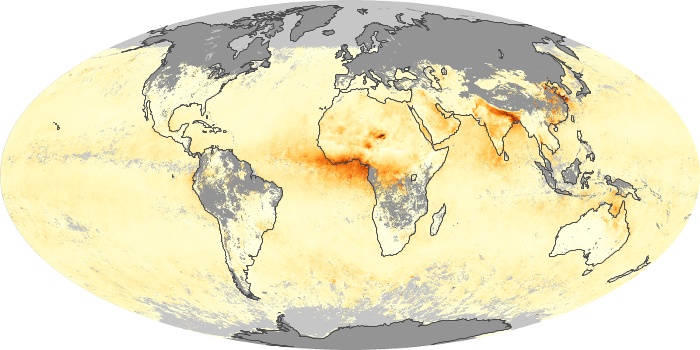
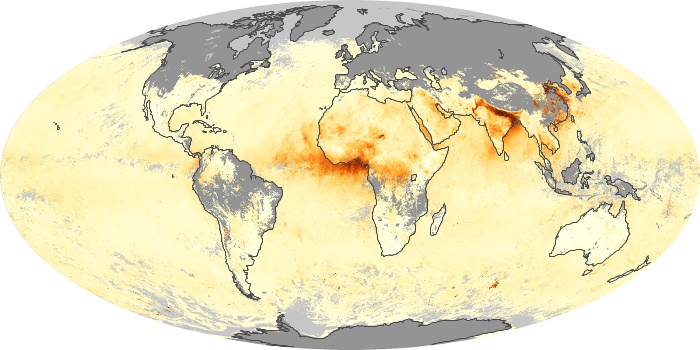
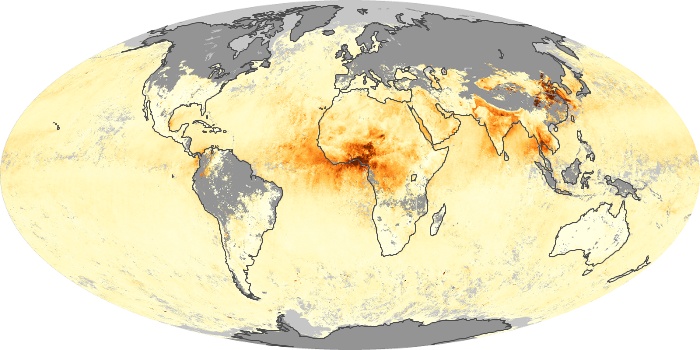
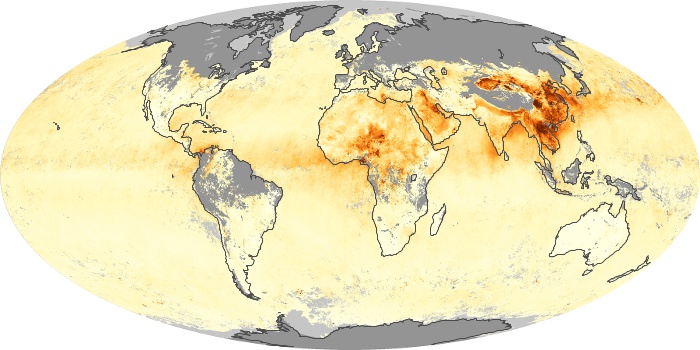
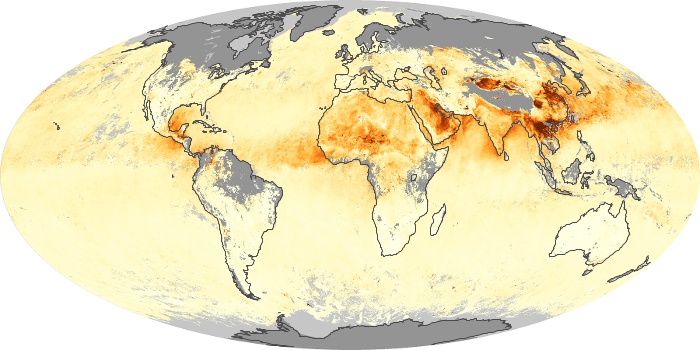
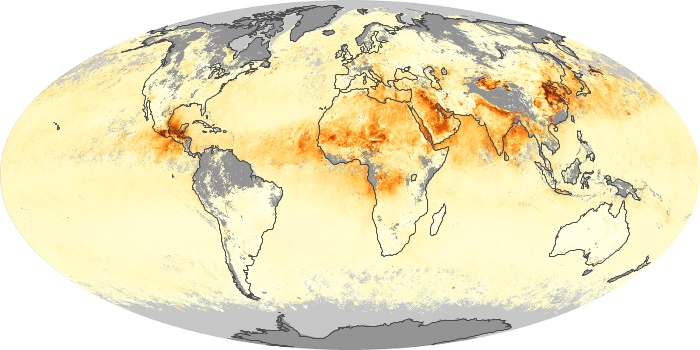
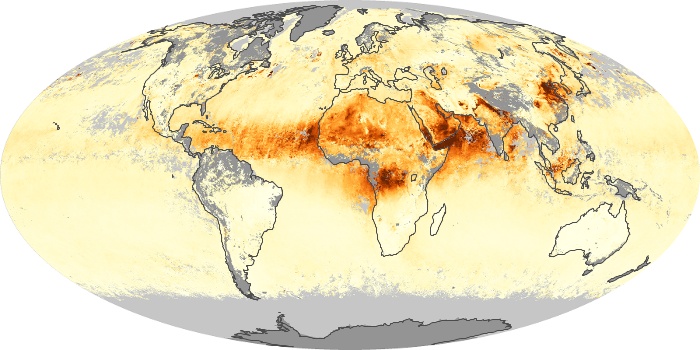
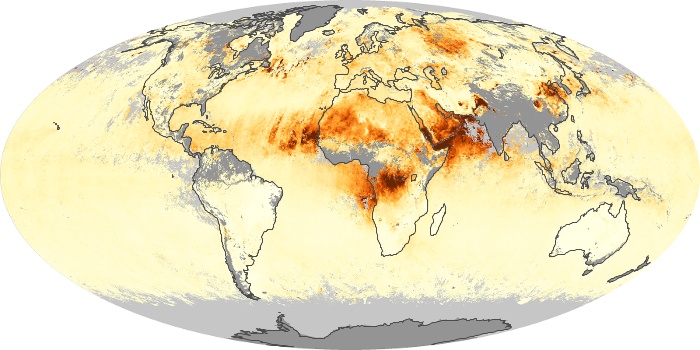
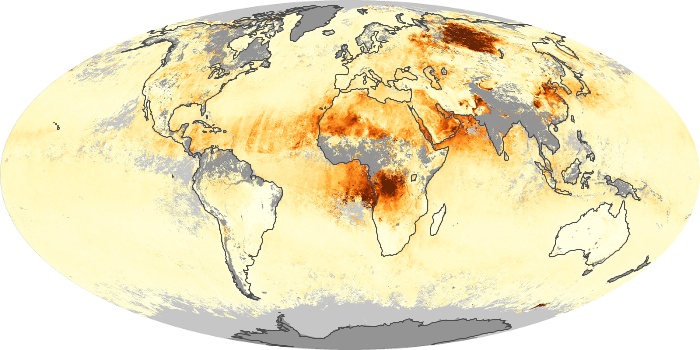
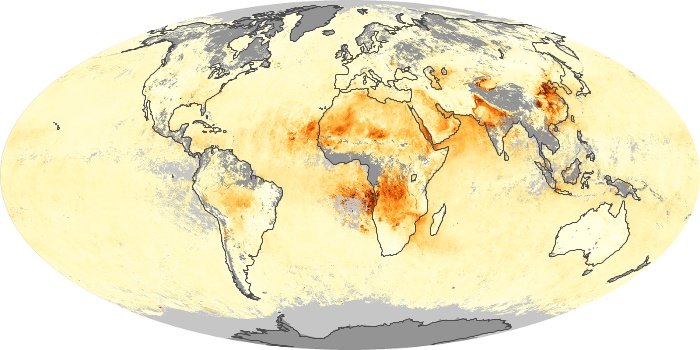
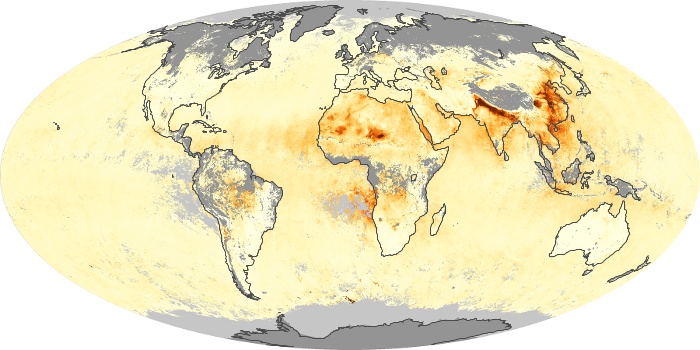
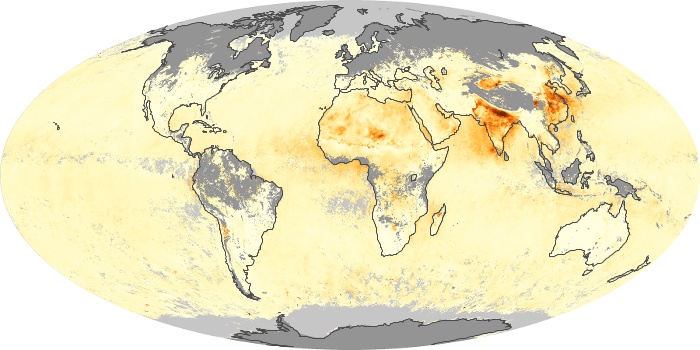
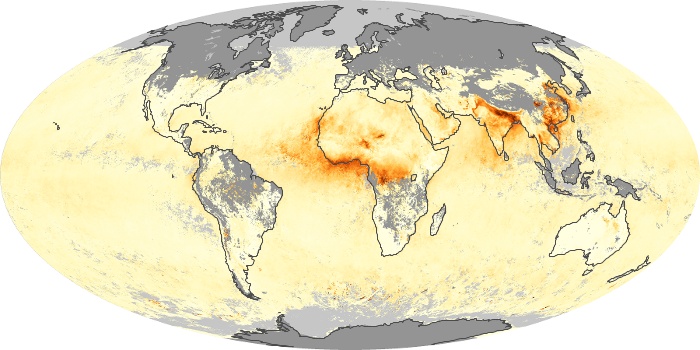
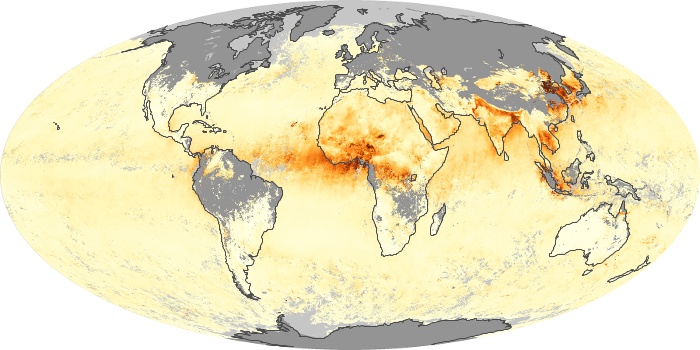
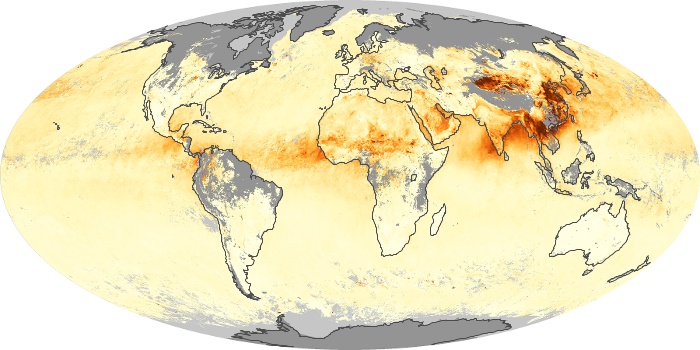
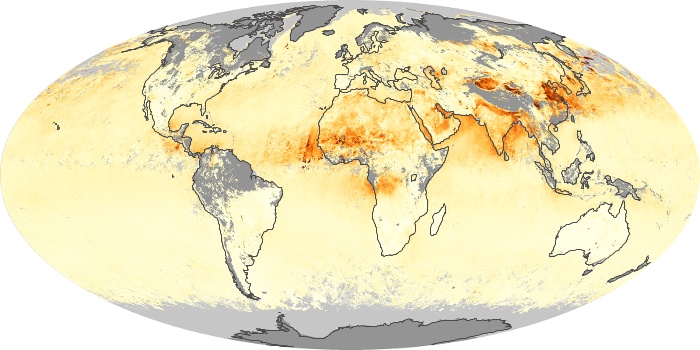
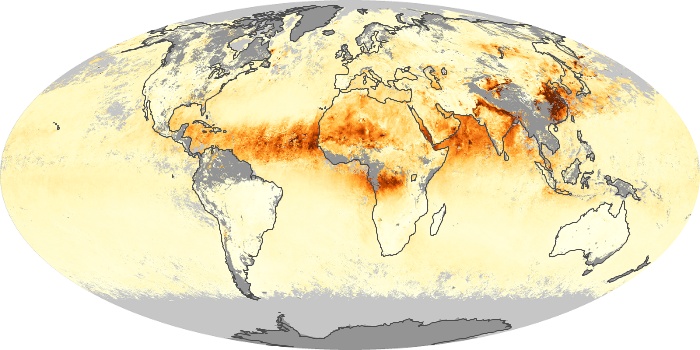
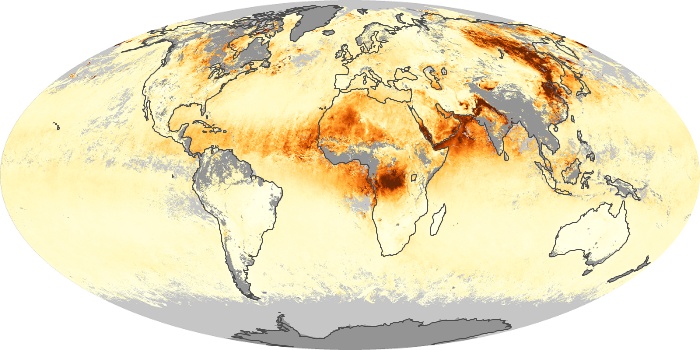
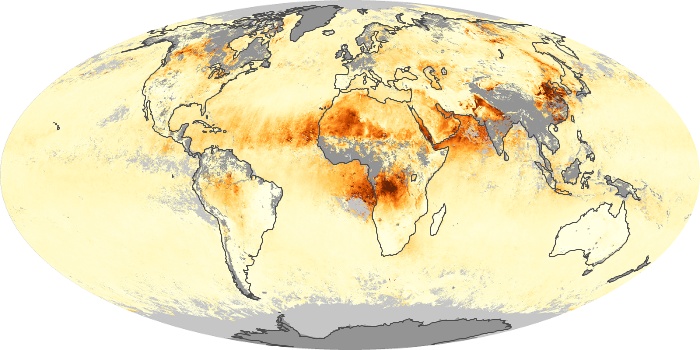
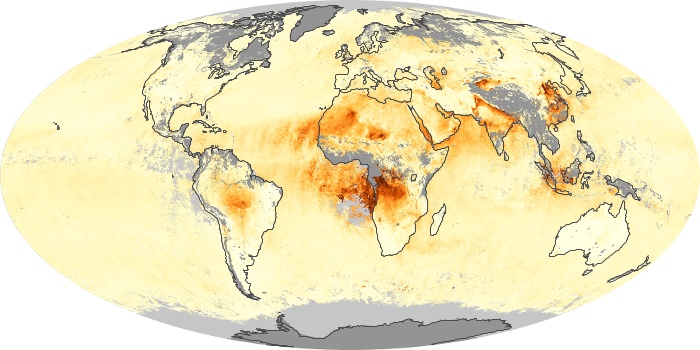
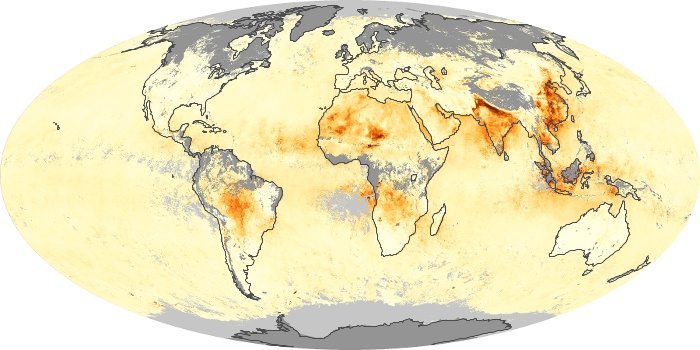
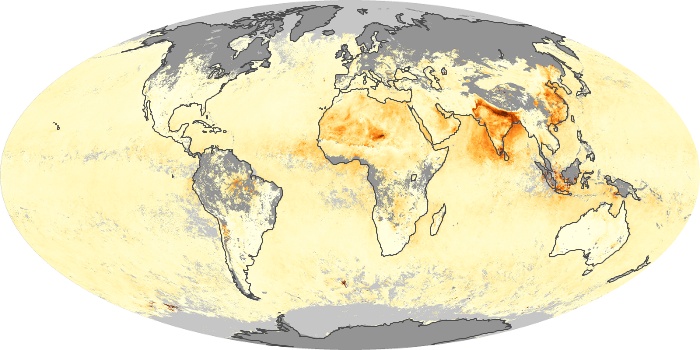
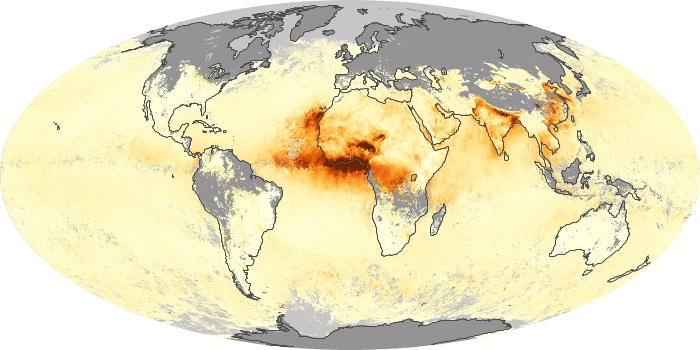
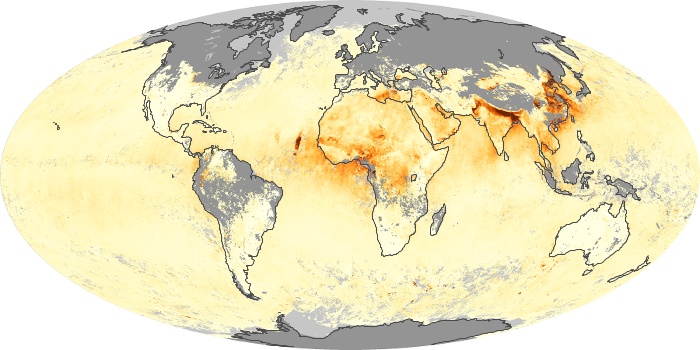
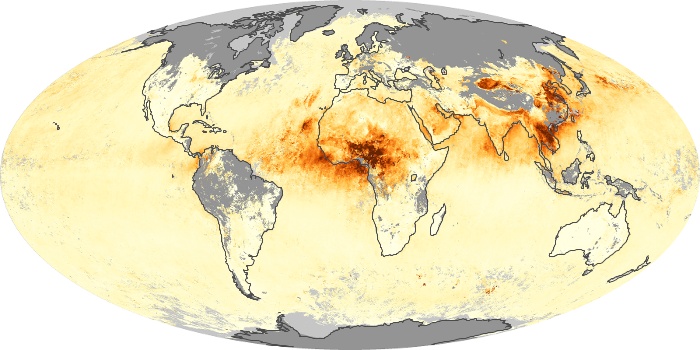
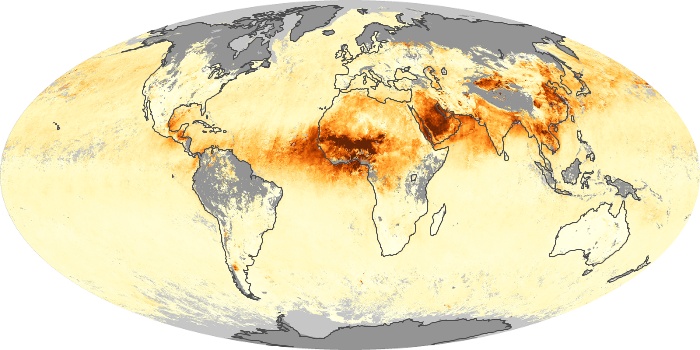
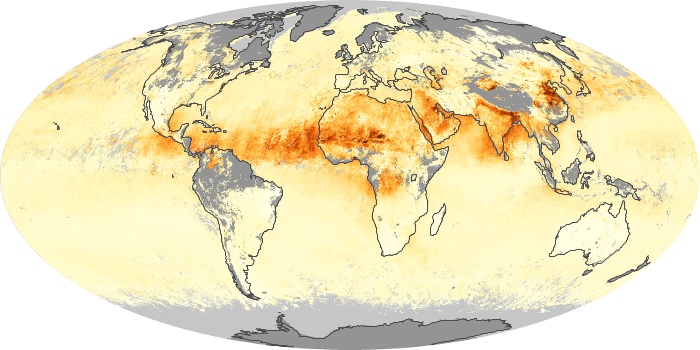
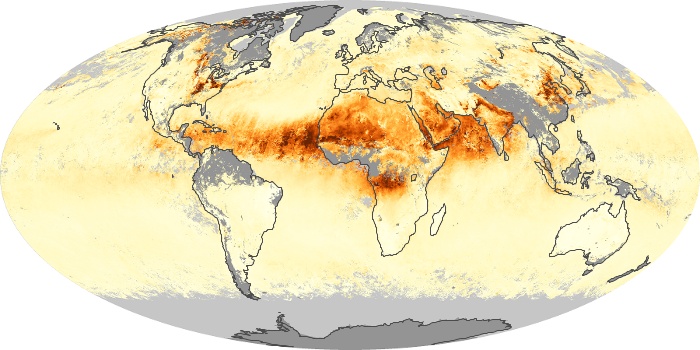
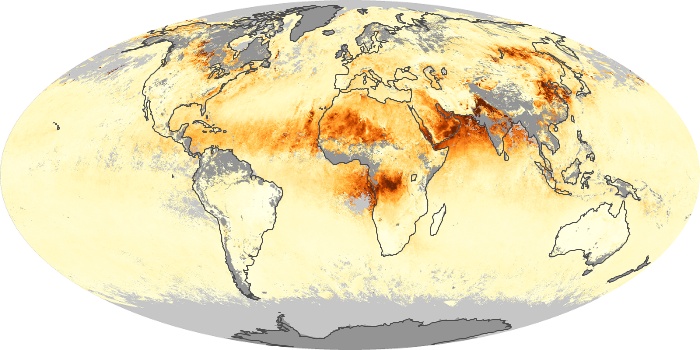
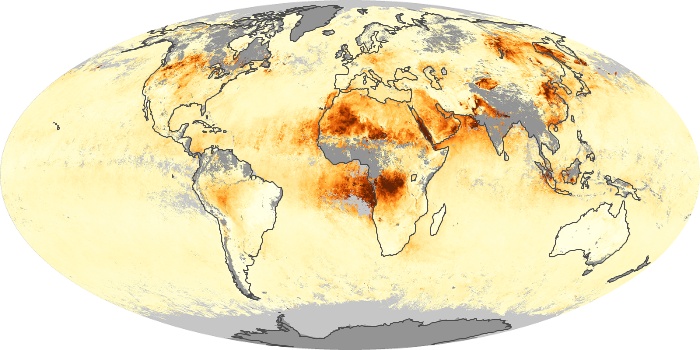
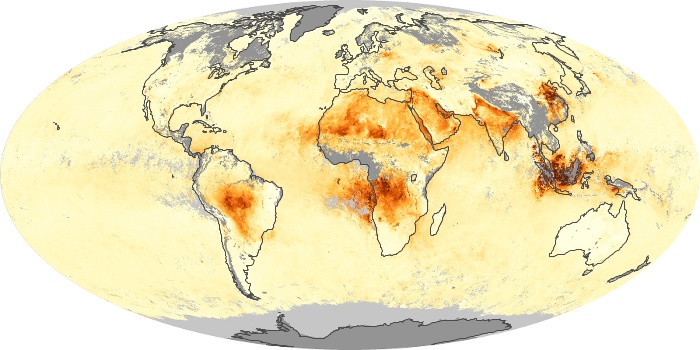
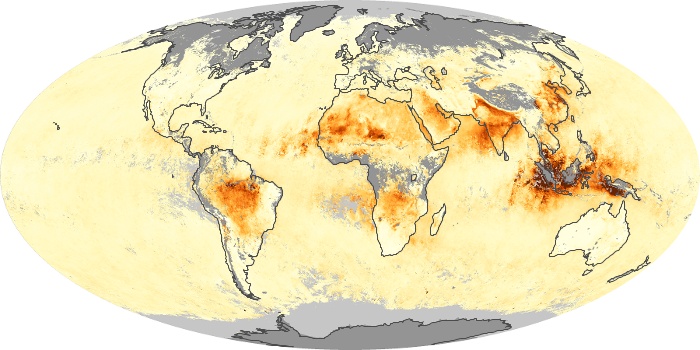
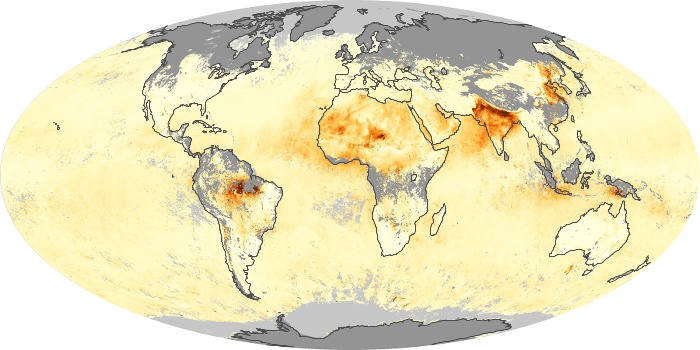
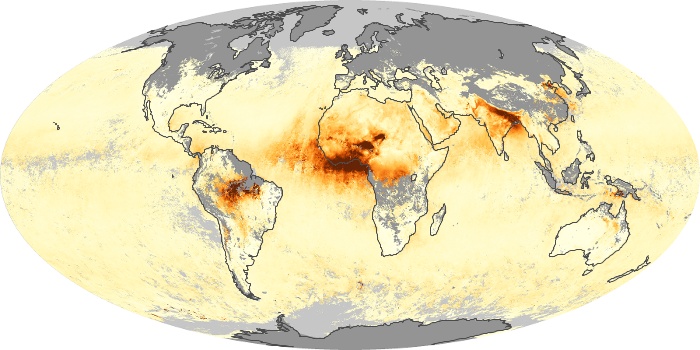
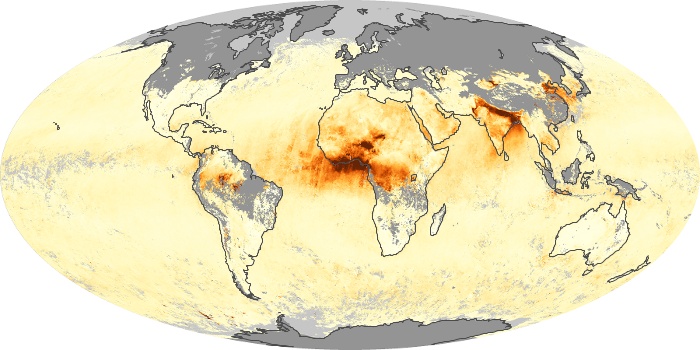
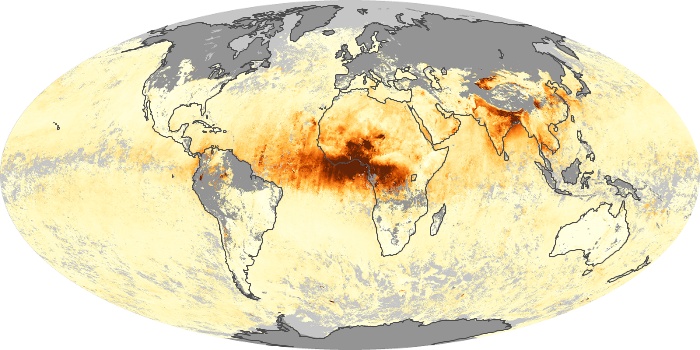
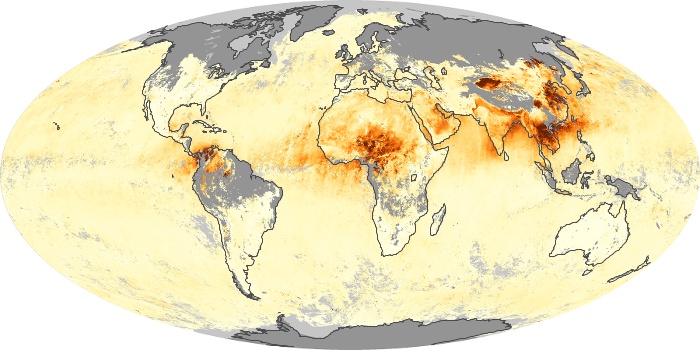
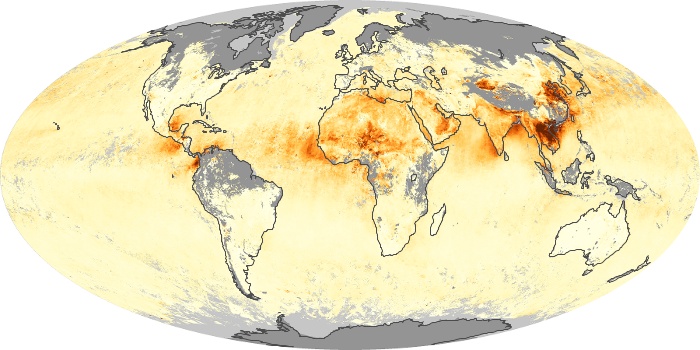
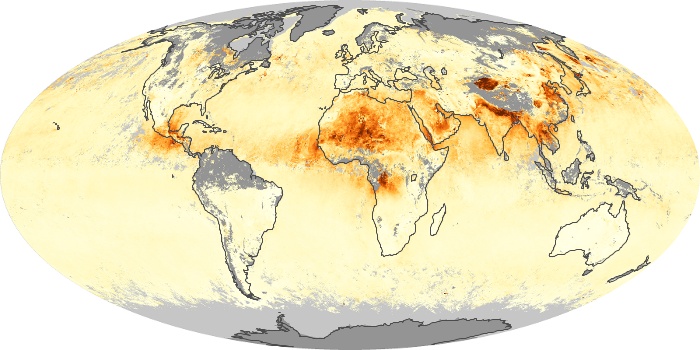
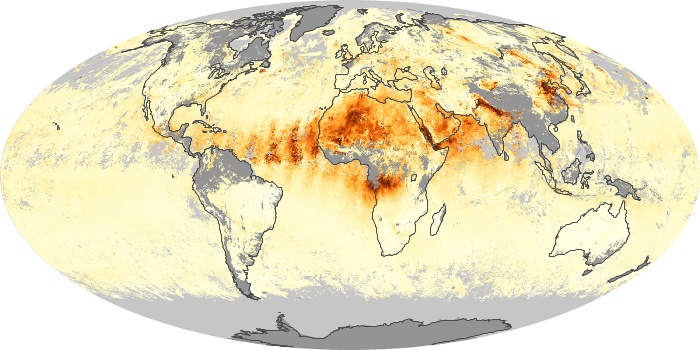
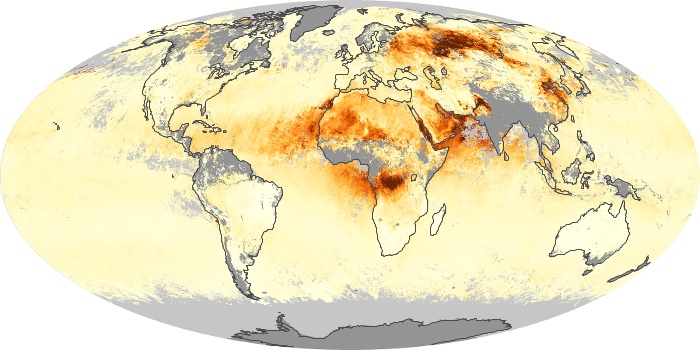
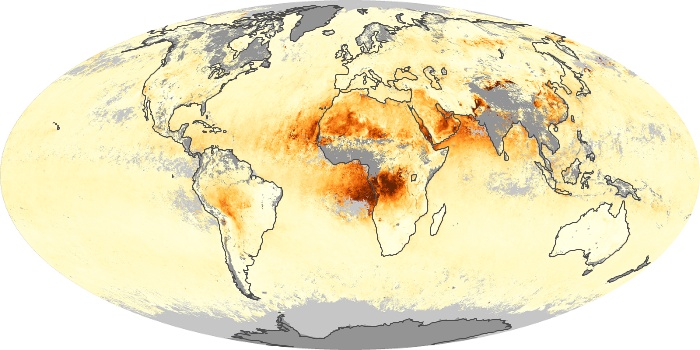
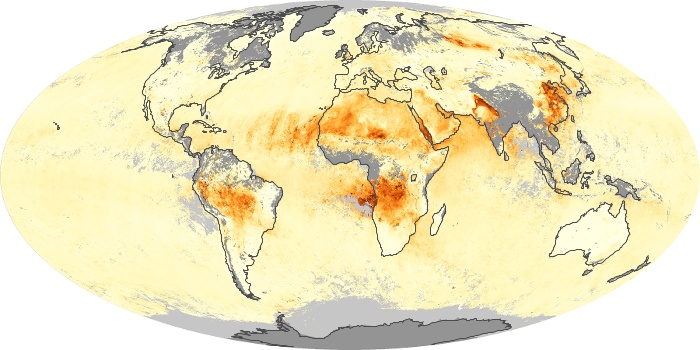
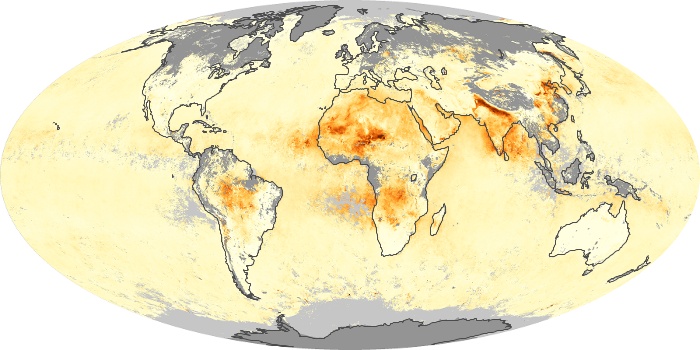
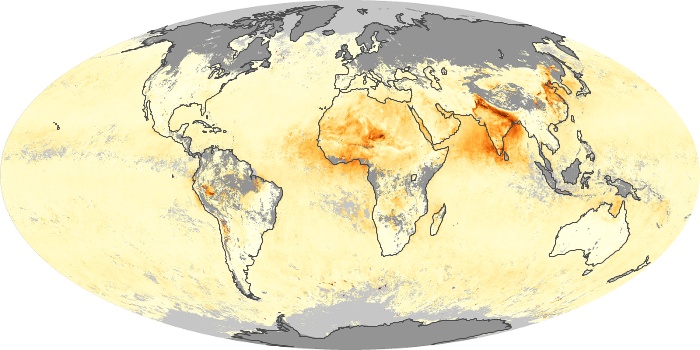
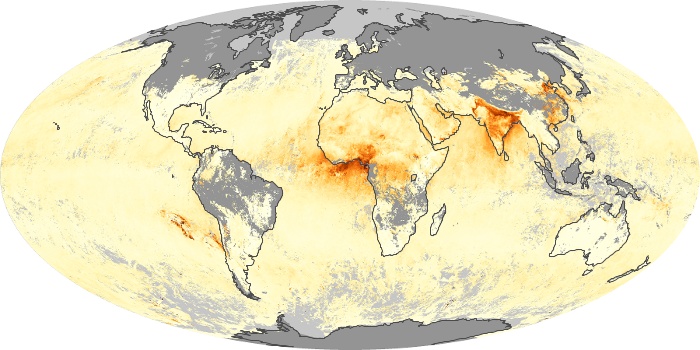
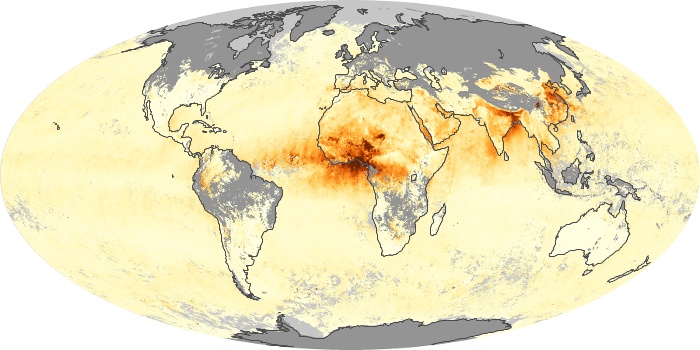
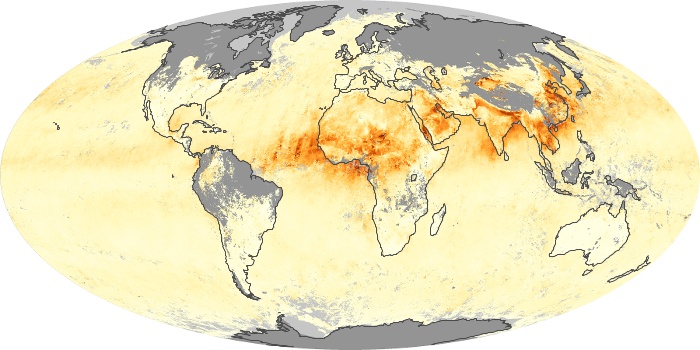
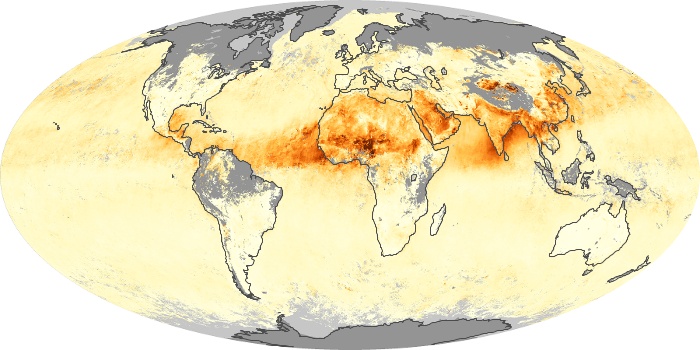
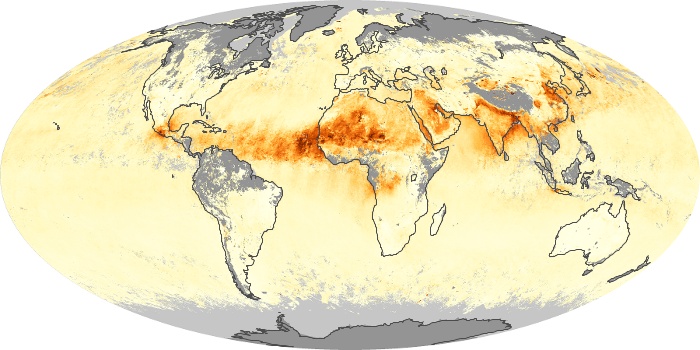
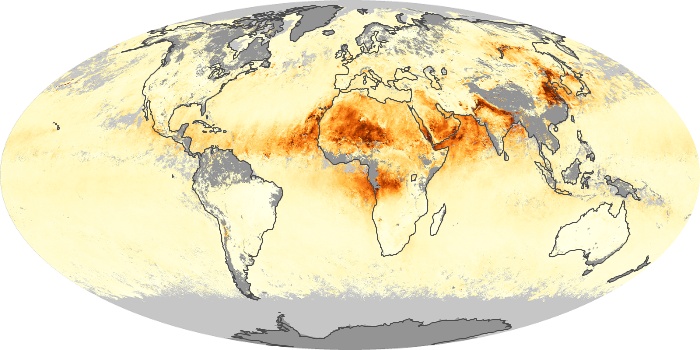
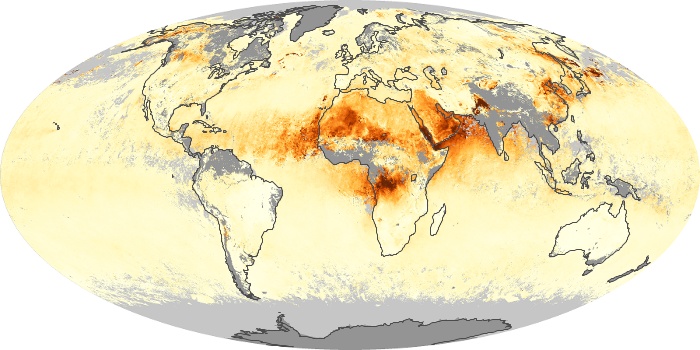
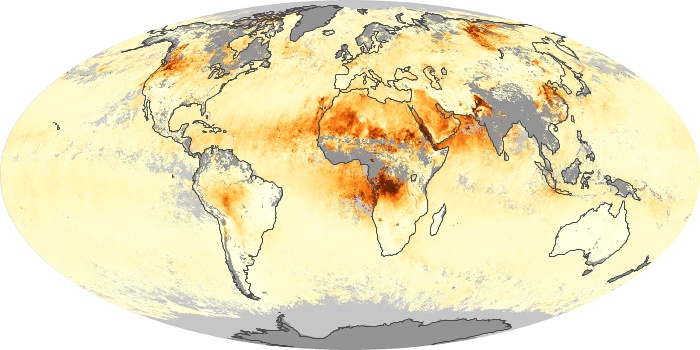
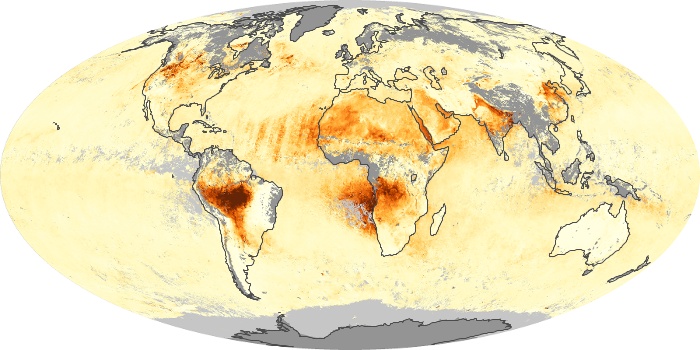
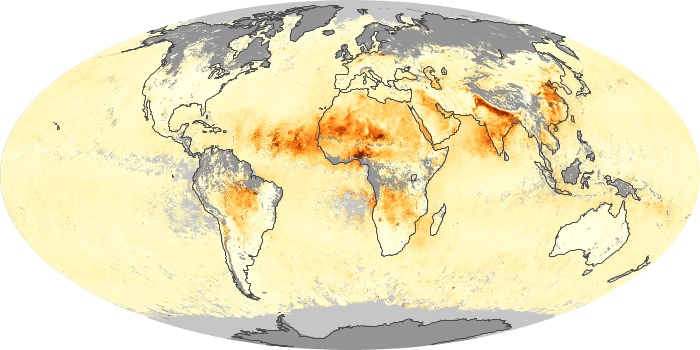
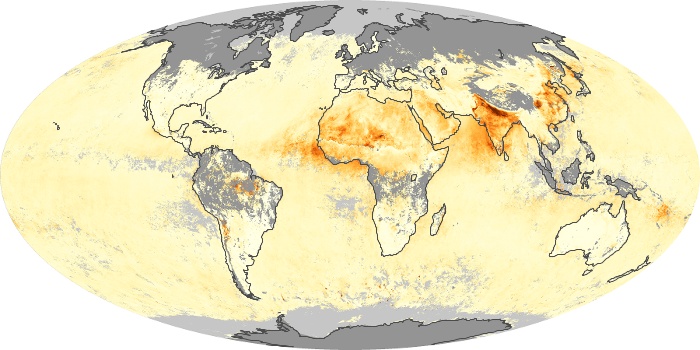
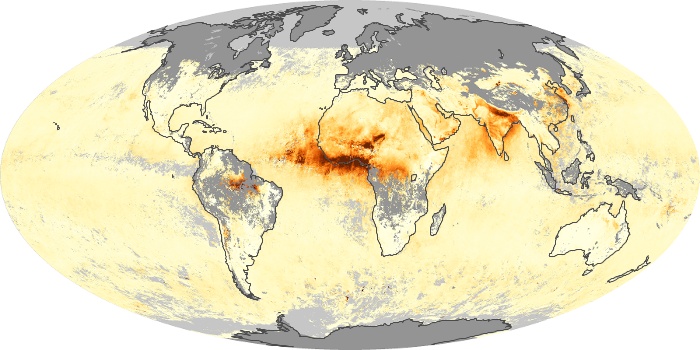
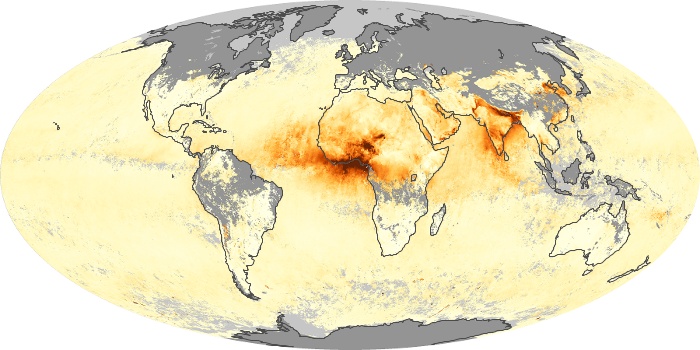
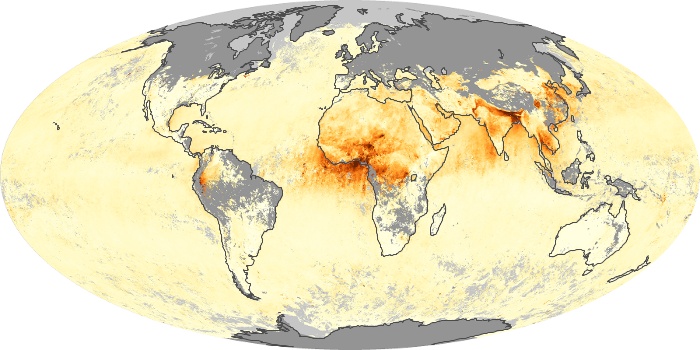
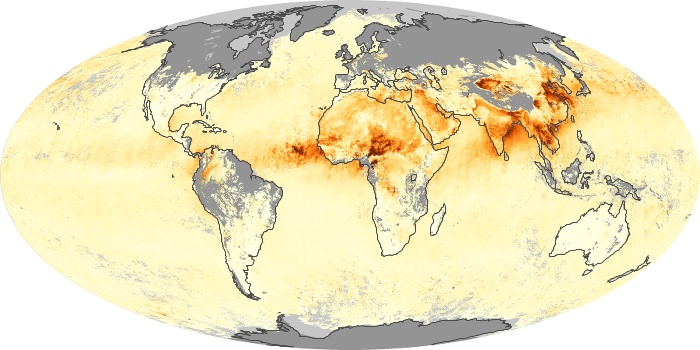
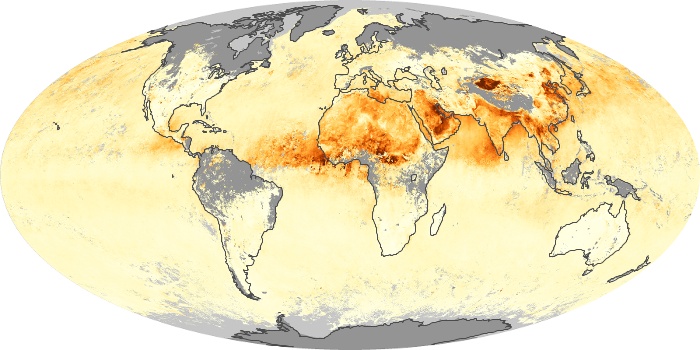
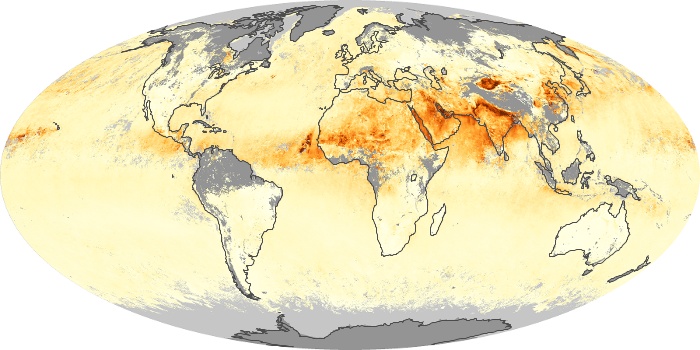
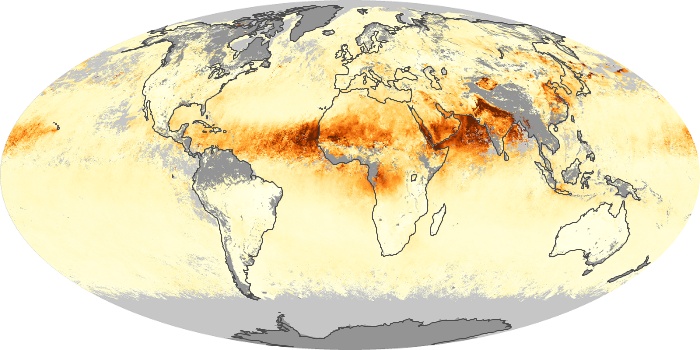
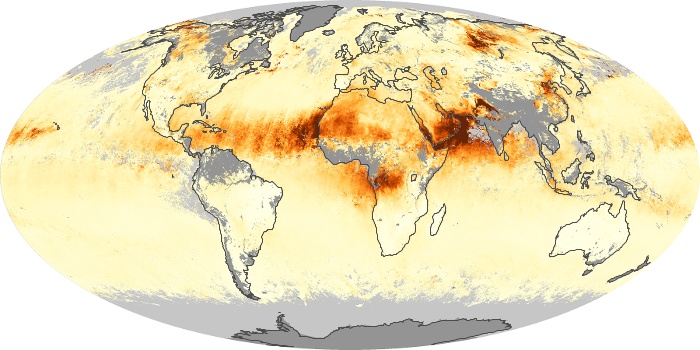
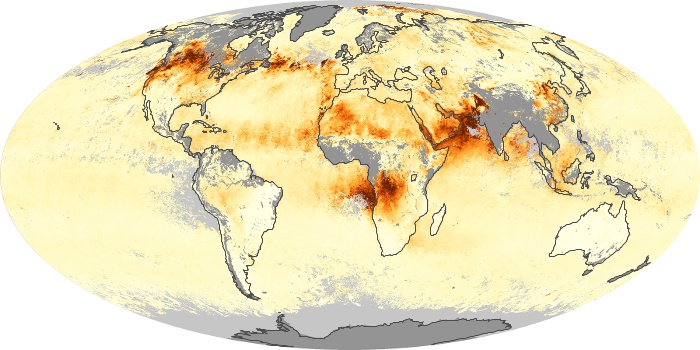
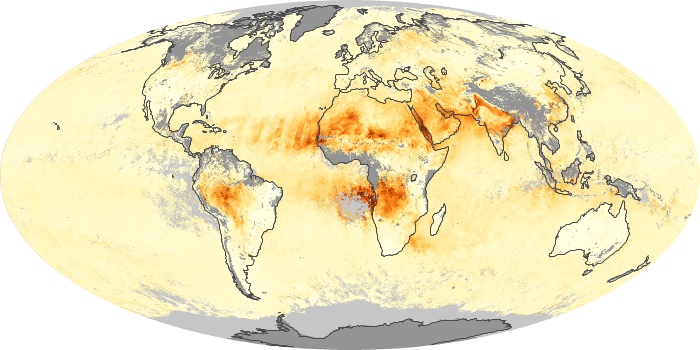
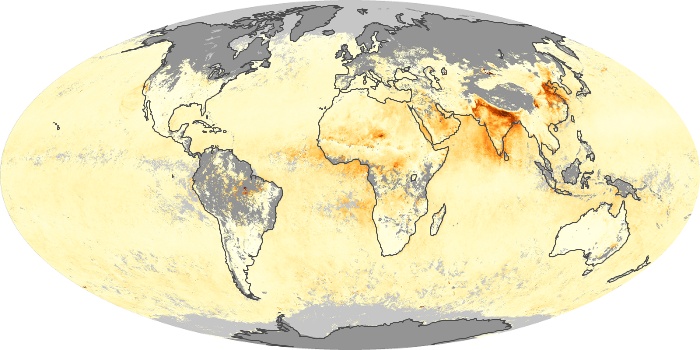
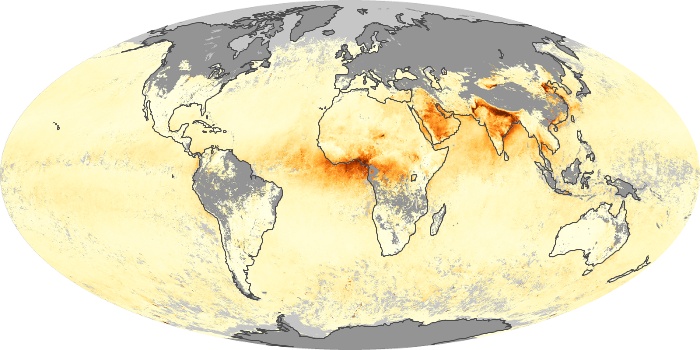
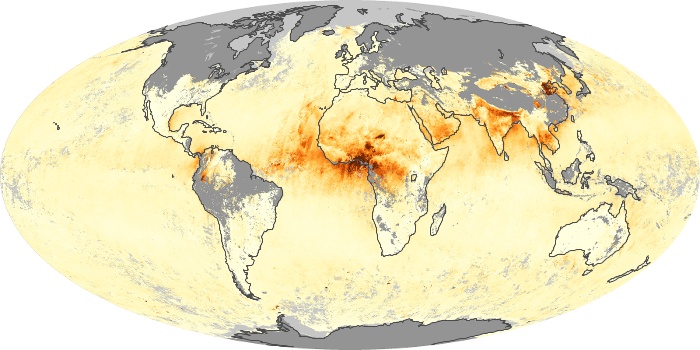
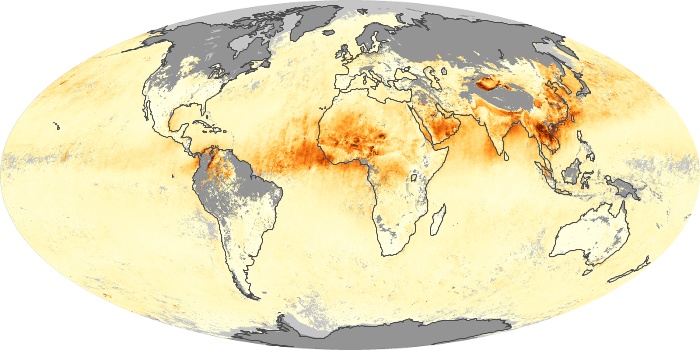
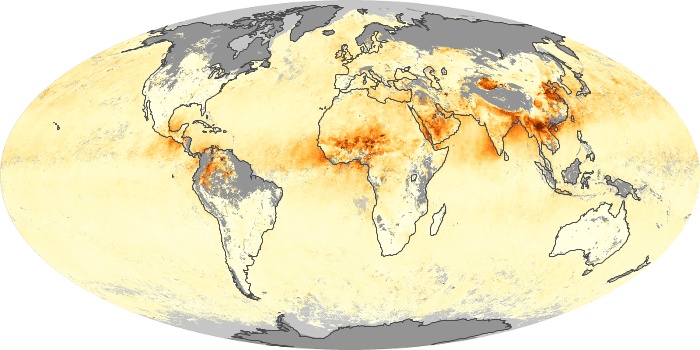
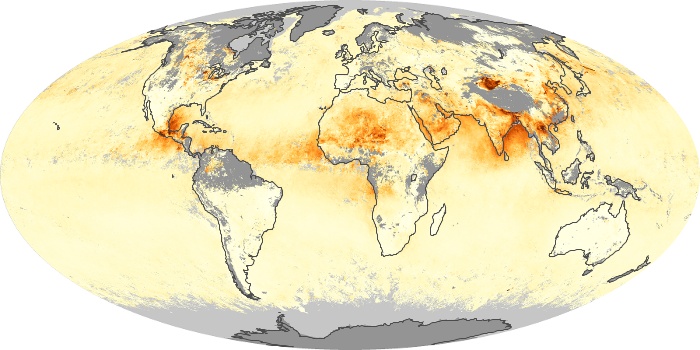
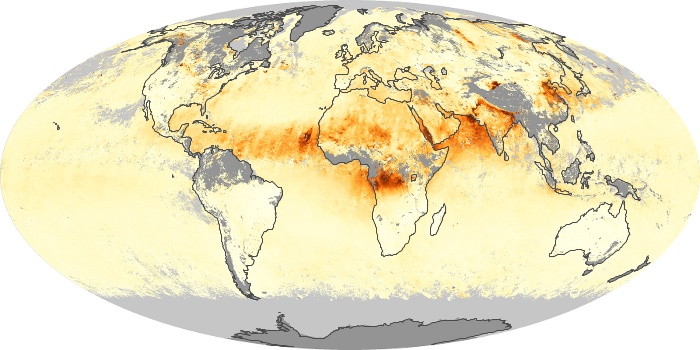
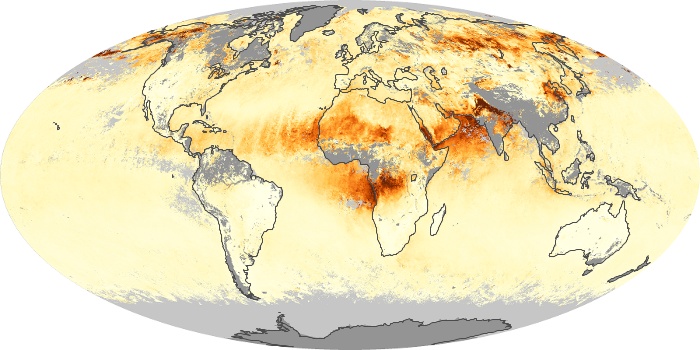
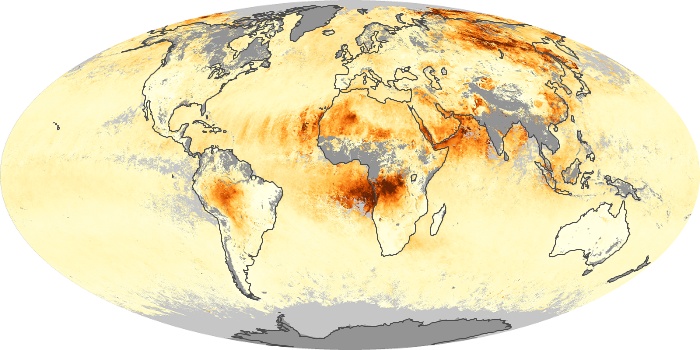
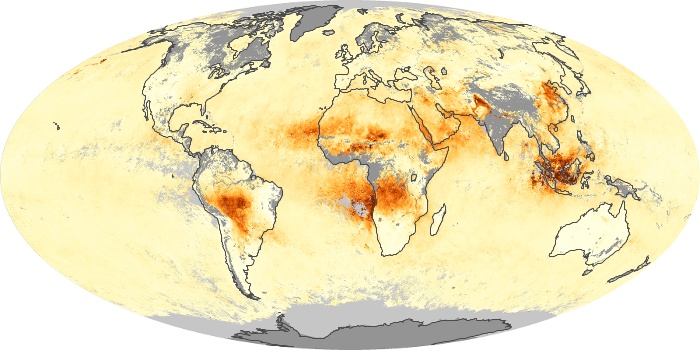
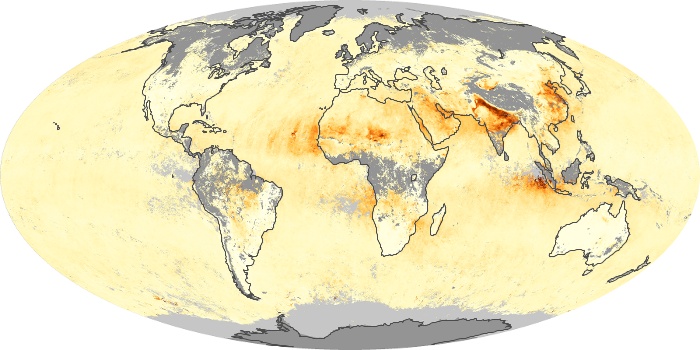
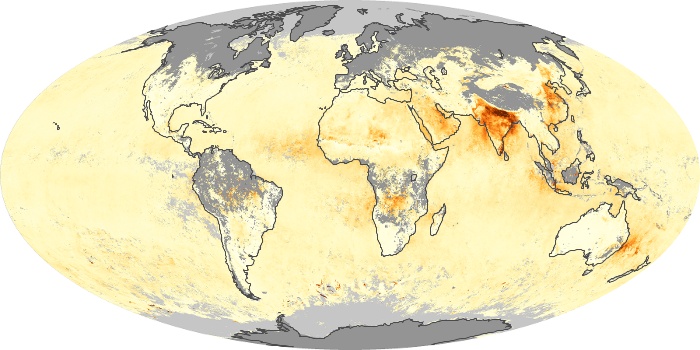
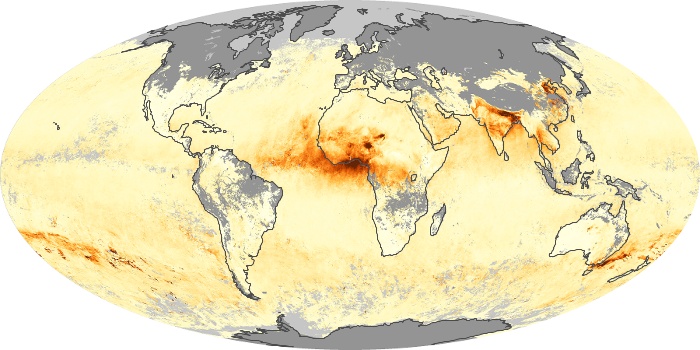
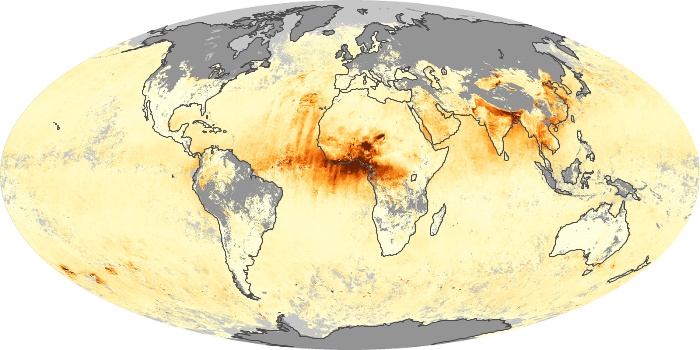
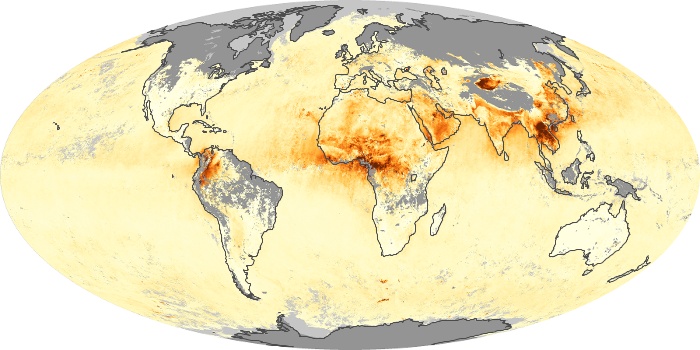
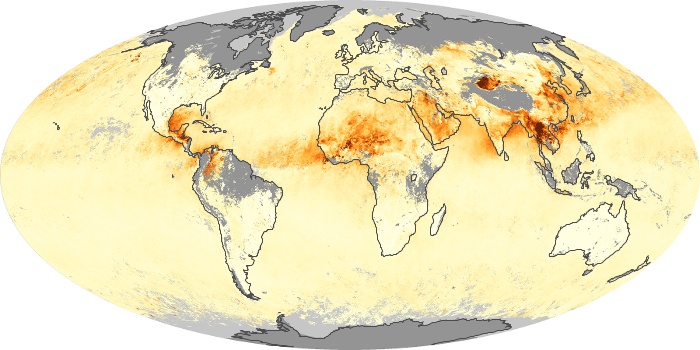
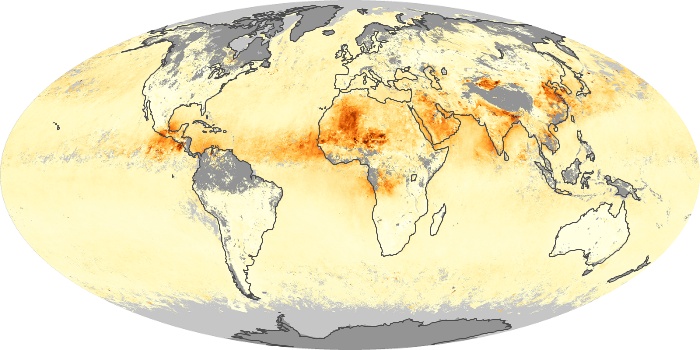
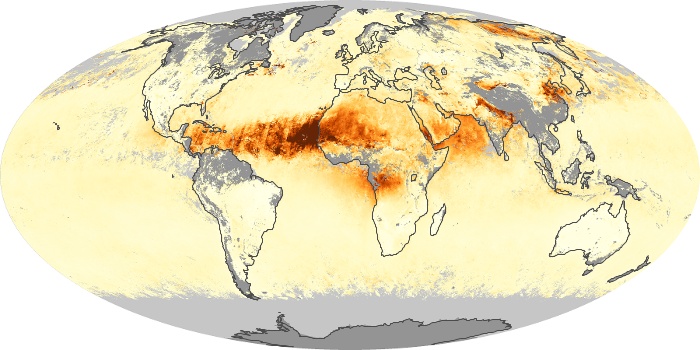
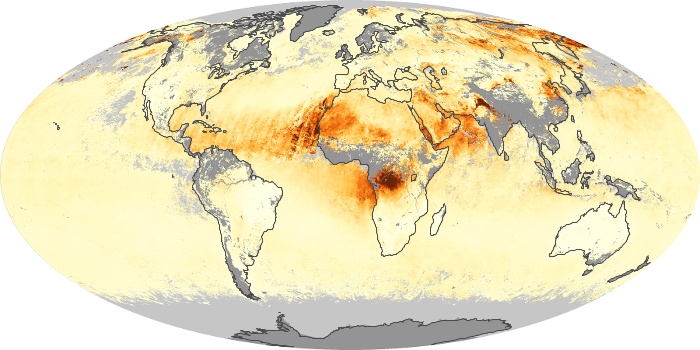
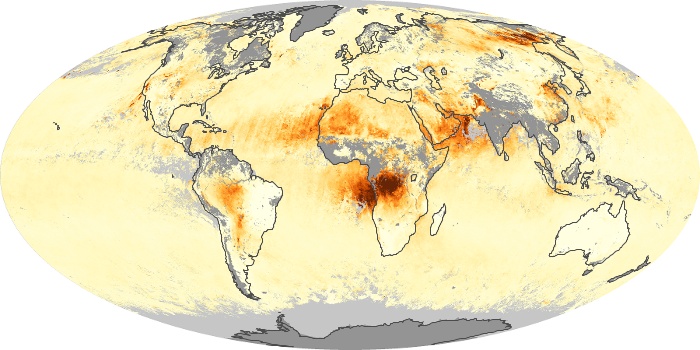
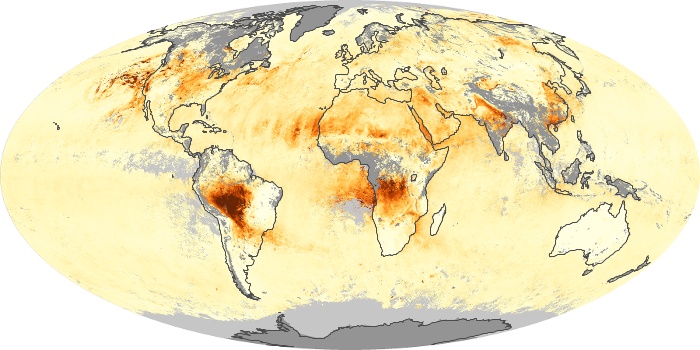
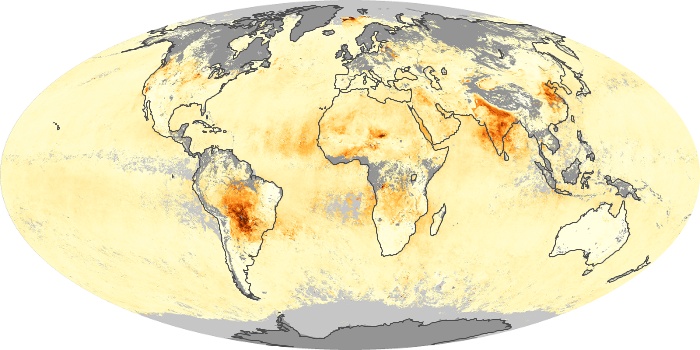
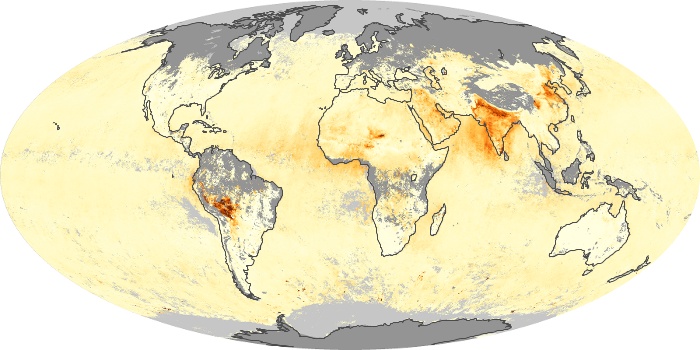
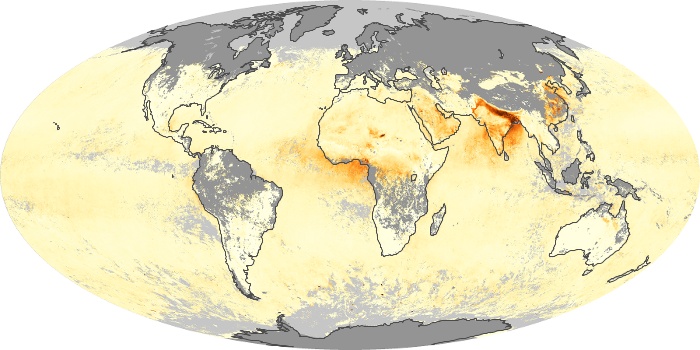
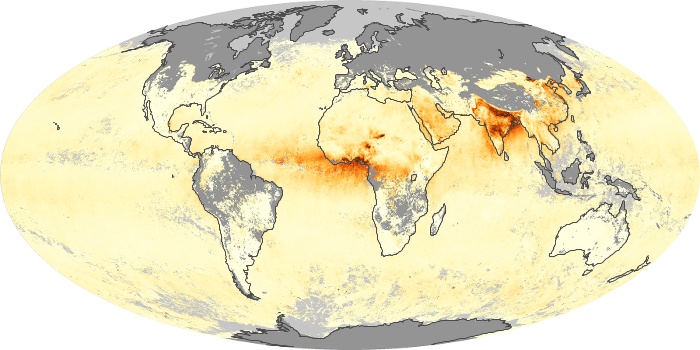
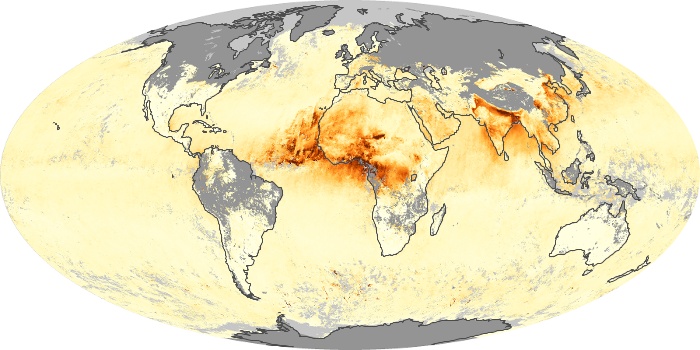
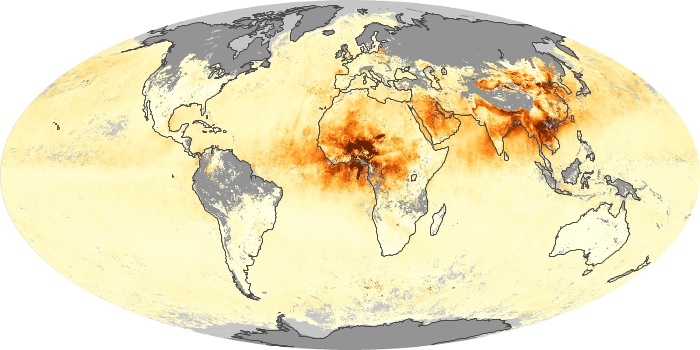
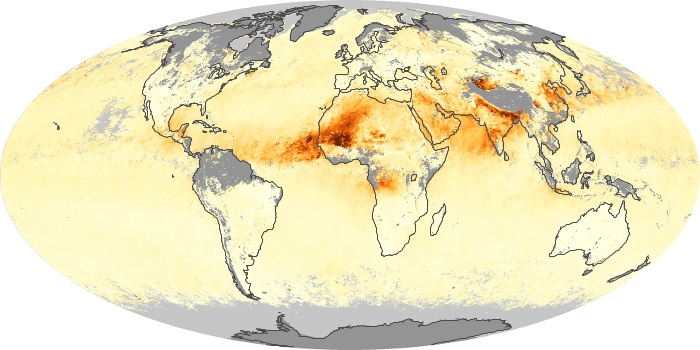
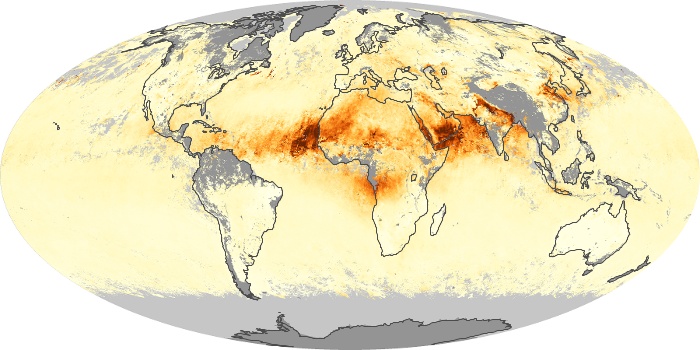
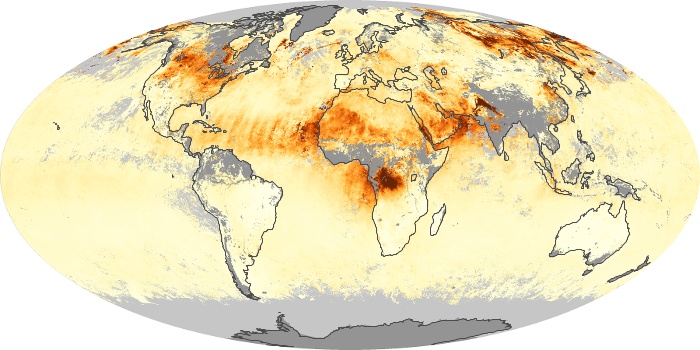
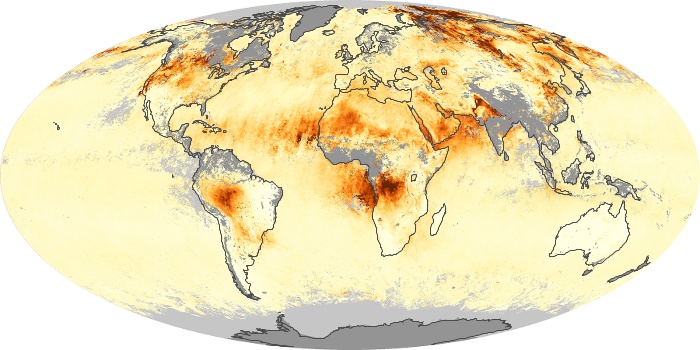
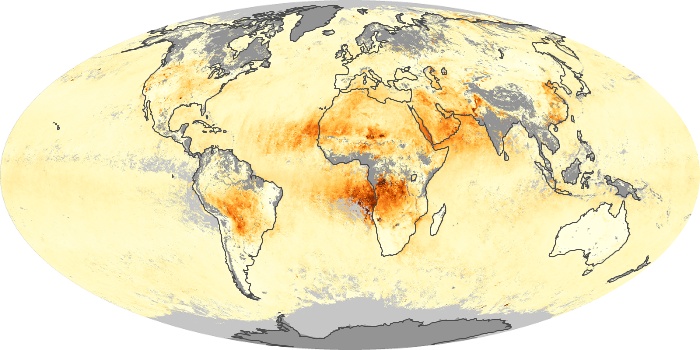
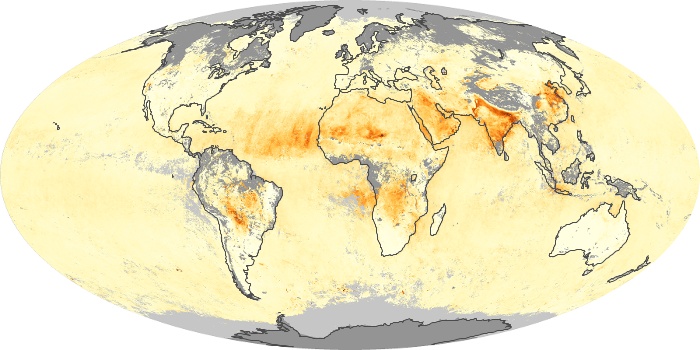
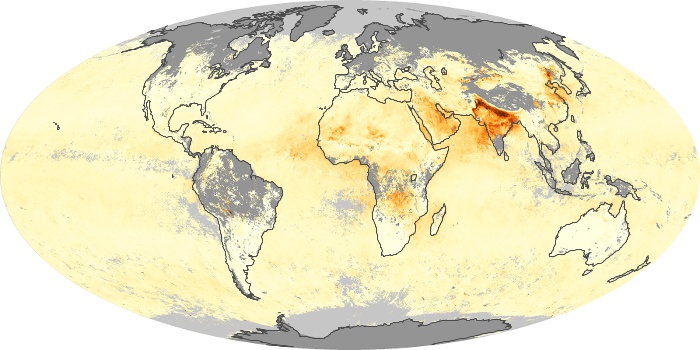
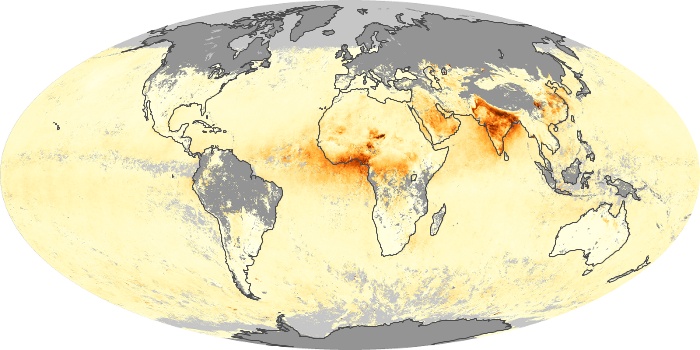
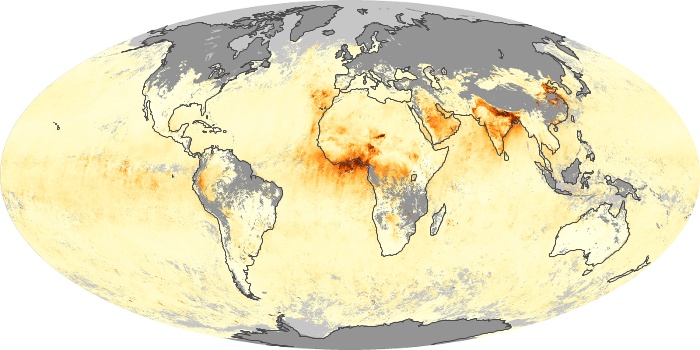
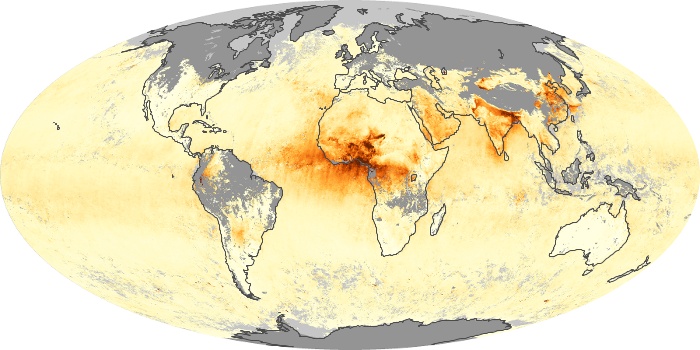
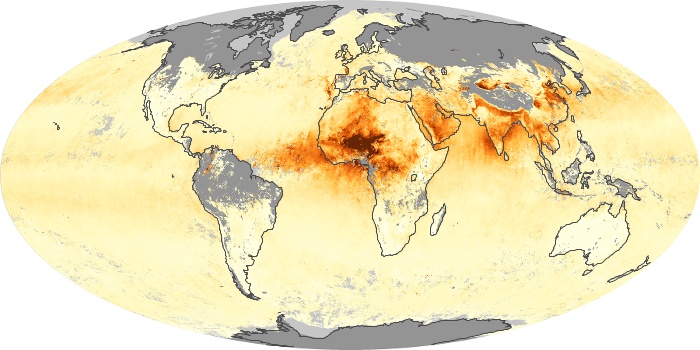
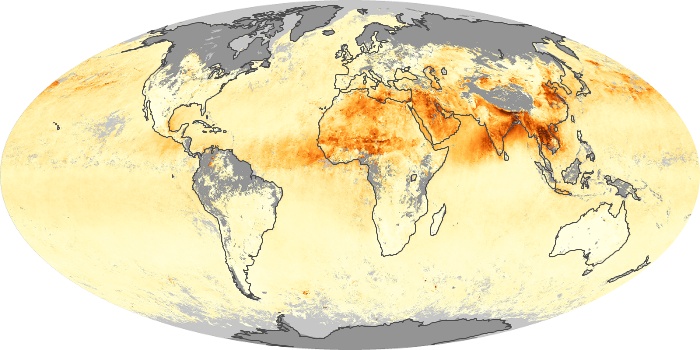
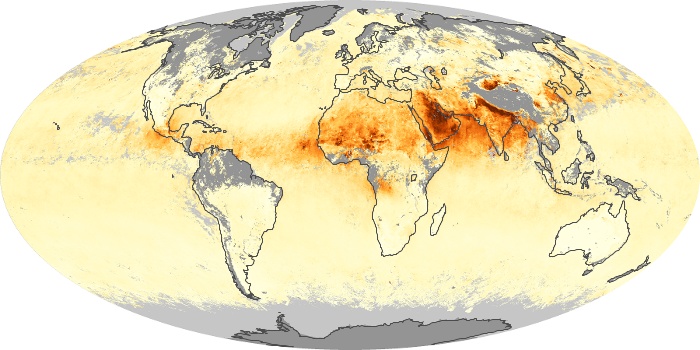
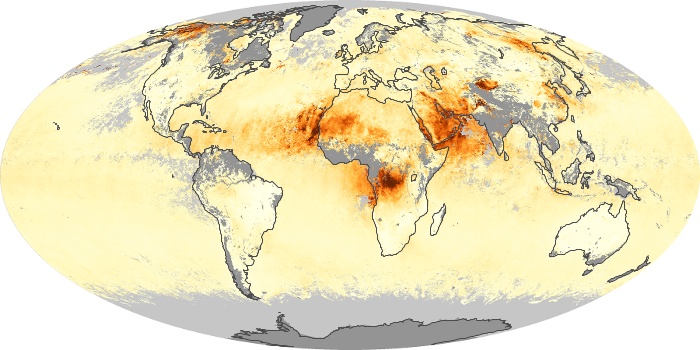
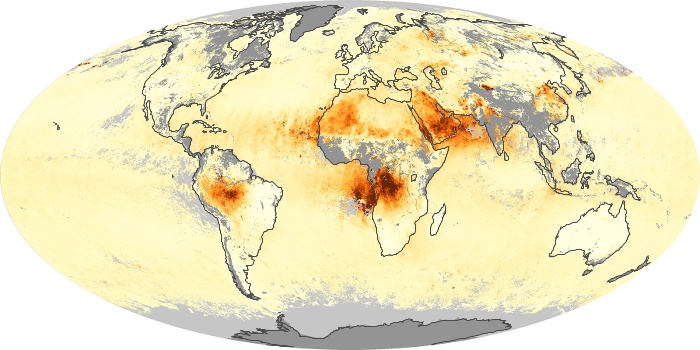
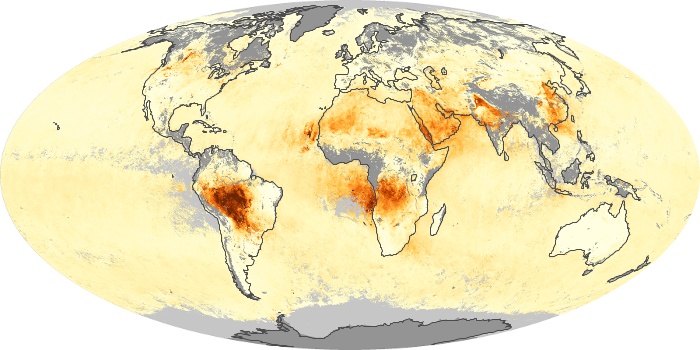
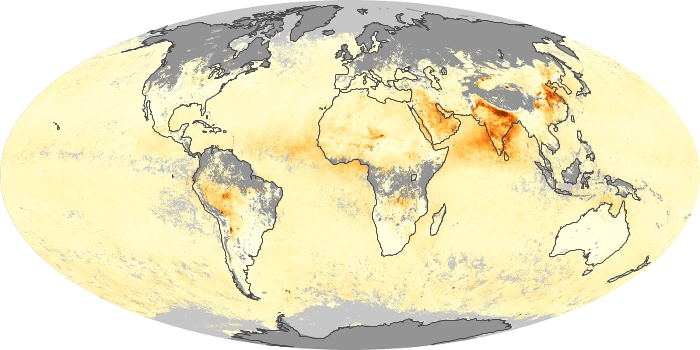
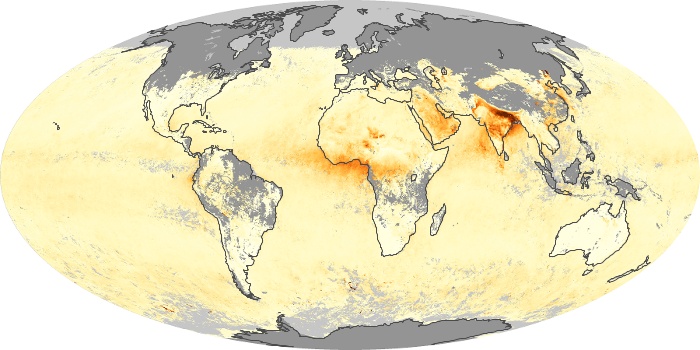
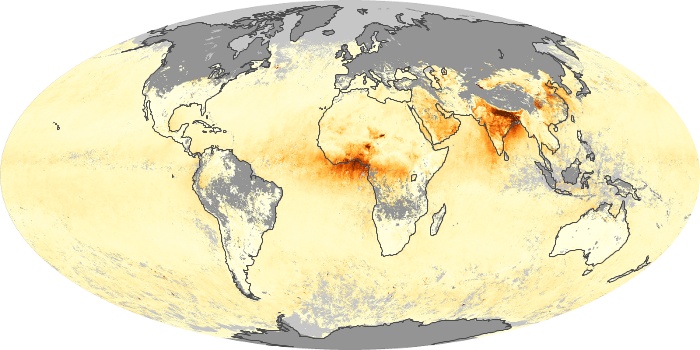
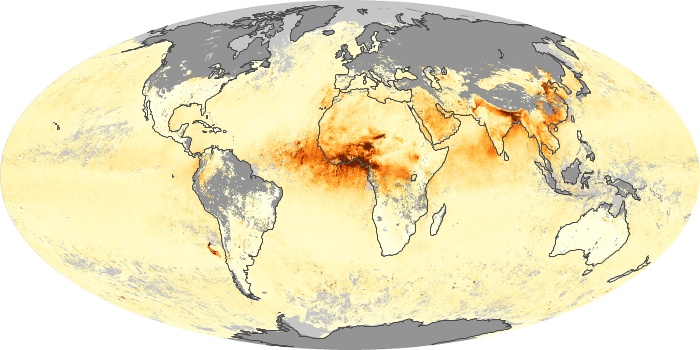
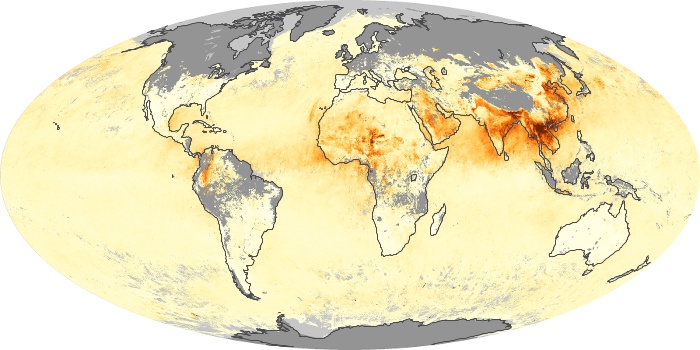
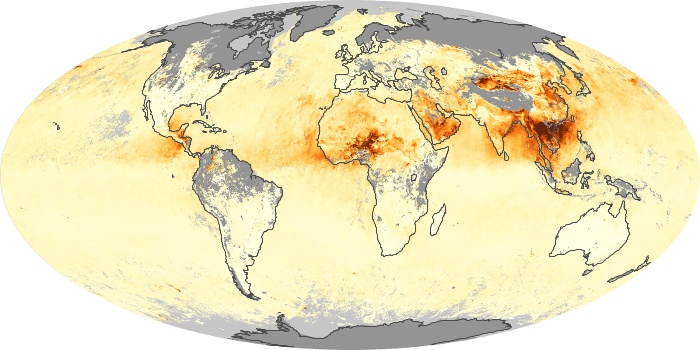
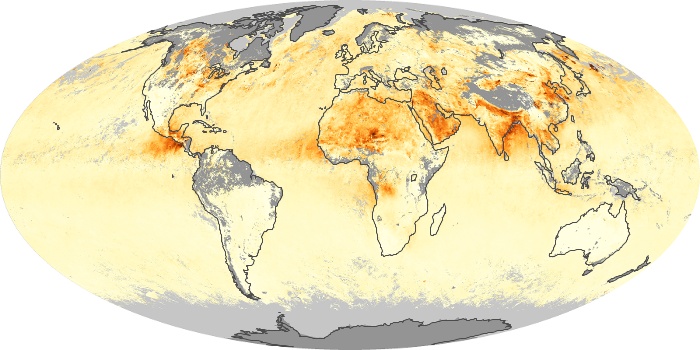
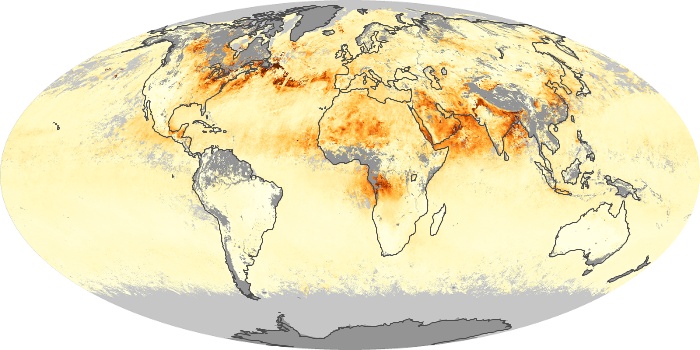
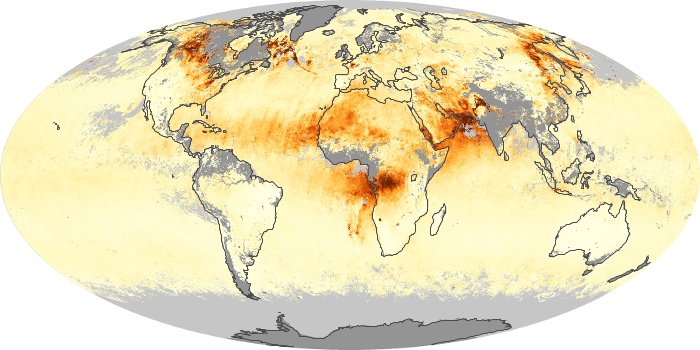
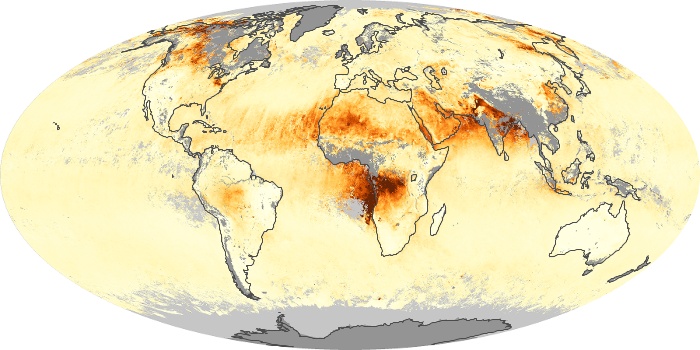
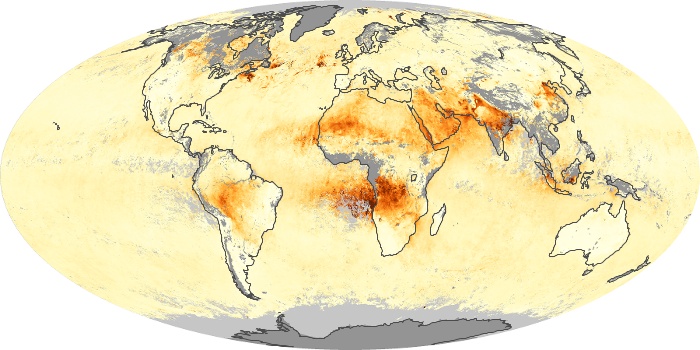
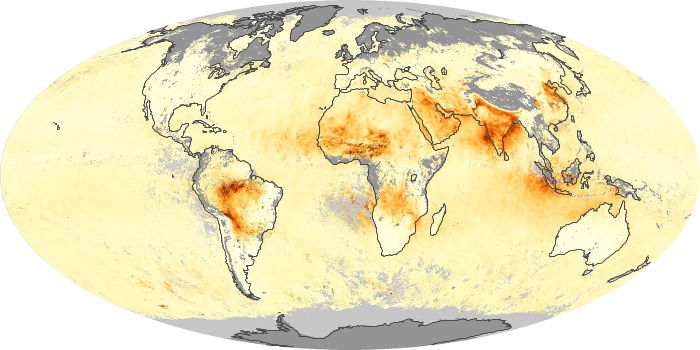
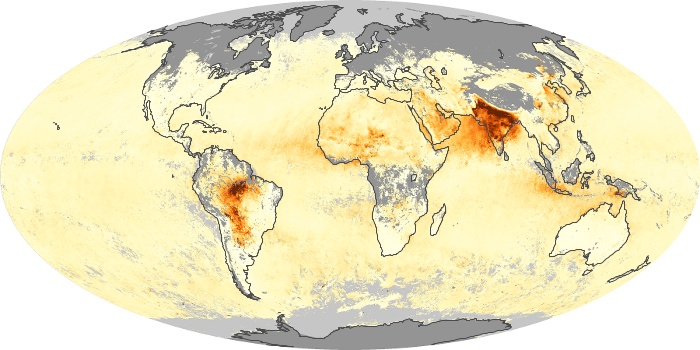
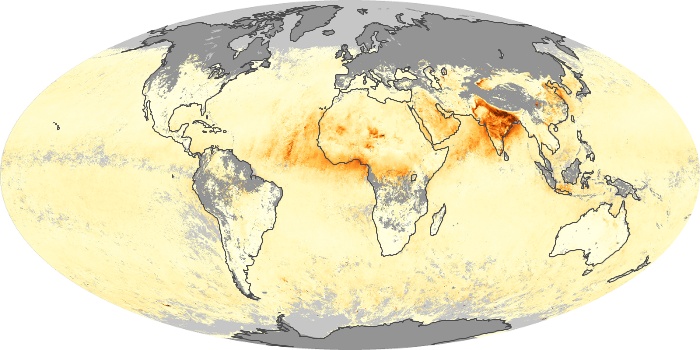
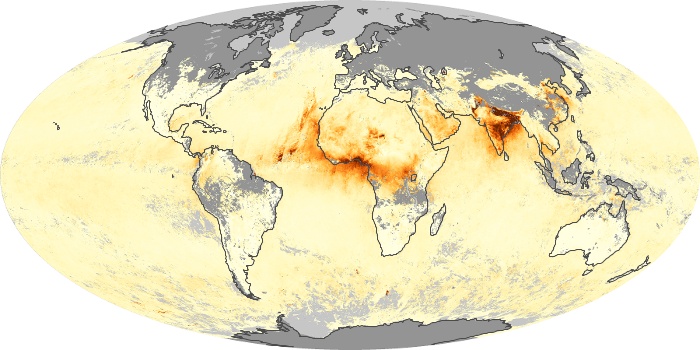
The aerosol maps show average monthly aerosol amounts around the world based on observations from the MODIS sensor on NASA's Terra satellite. Satellite measurements of aerosols, called aerosol optical thickness, are based on the fact that the particles change the way the atmosphere reflects and absorbs visible and infrared light. An optical thickness of less than 0.1 (palest yellow) indicates a crystal clear sky with maximum visibility, whereas a value of 1 (reddish brown) indicates very hazy conditions.
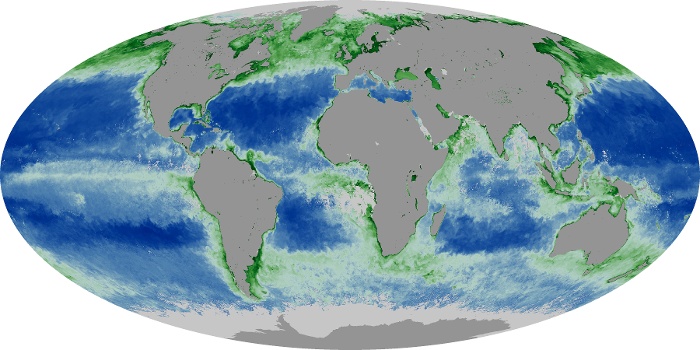
View, download, or analyze more of these data from NASA Earth Observations (NEO):
Sea Surface Temperature
Aerosol Optical Depth