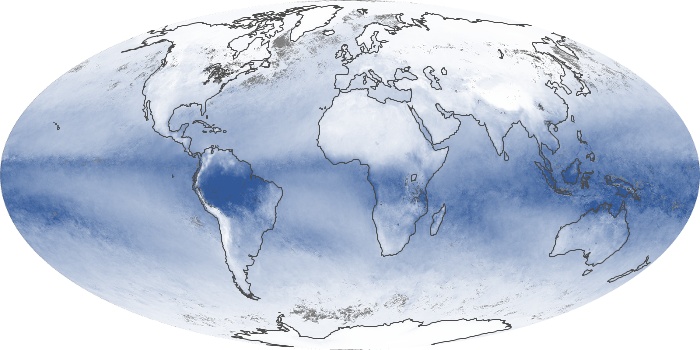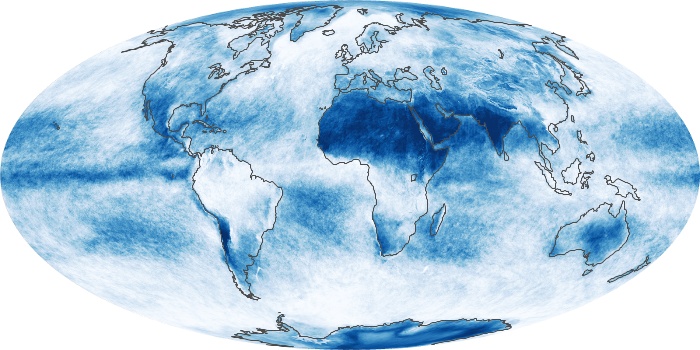
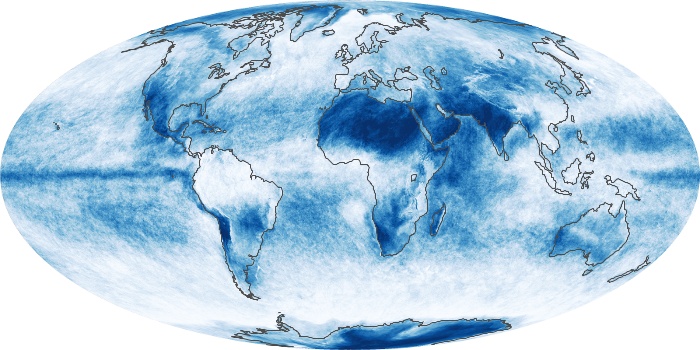
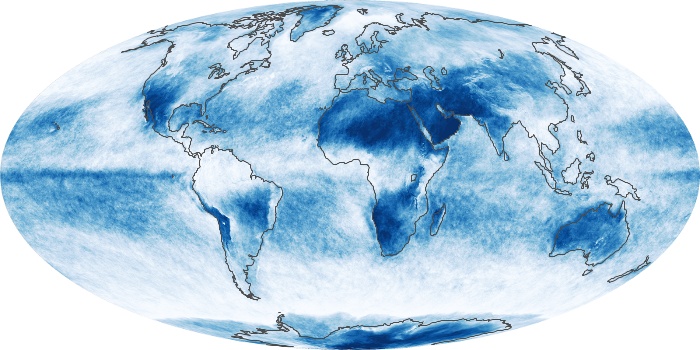
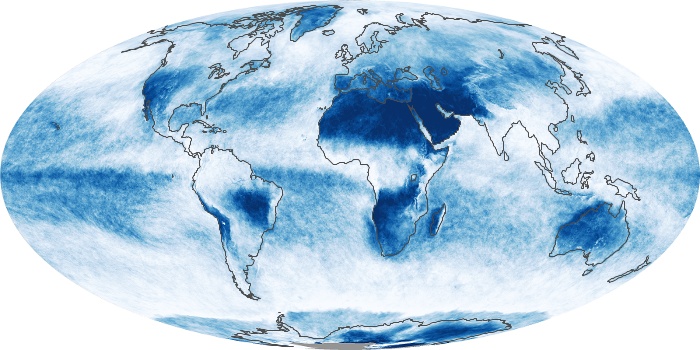

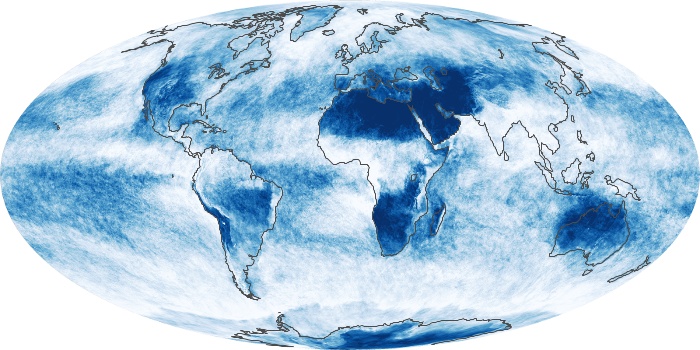
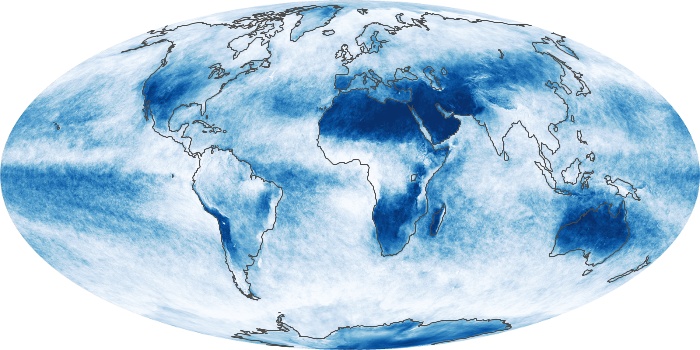
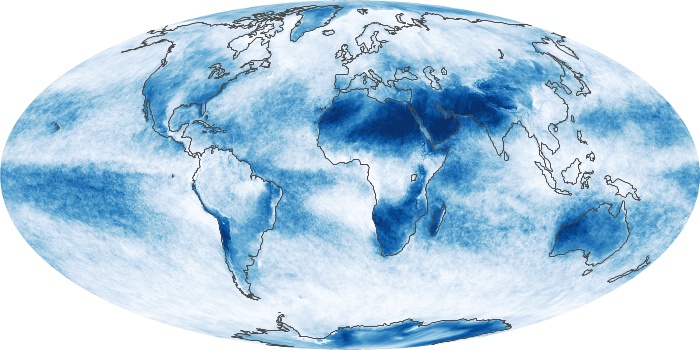
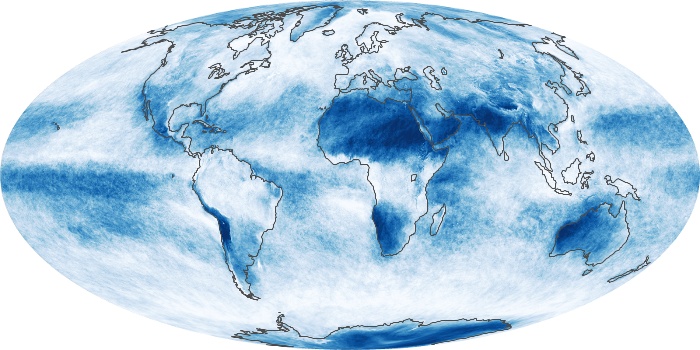
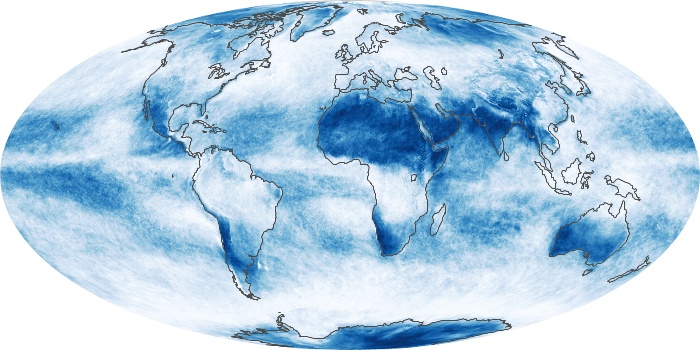
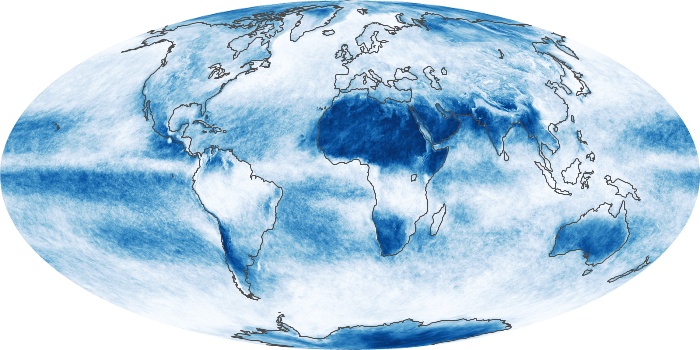
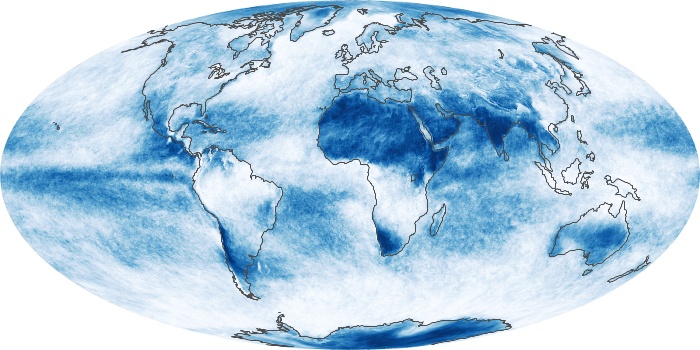
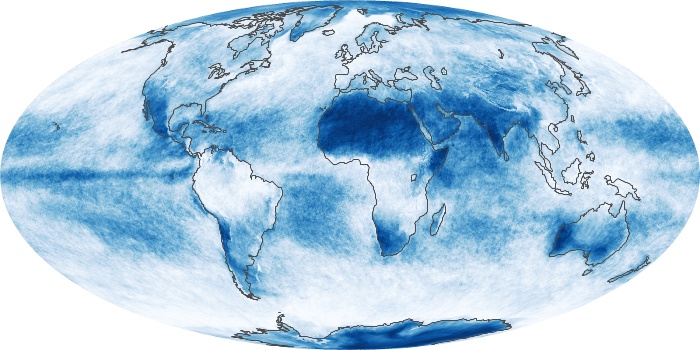
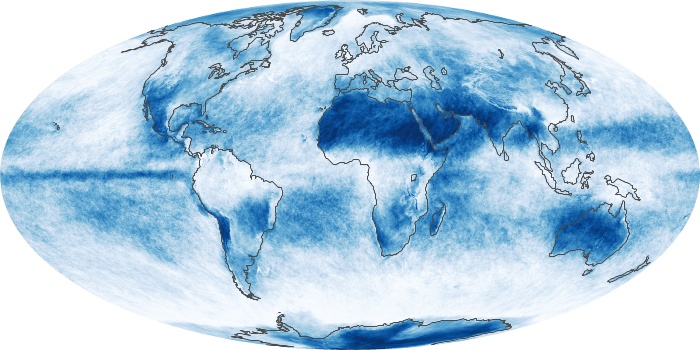
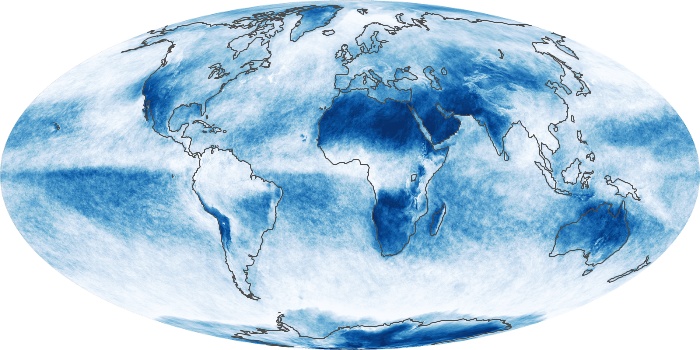
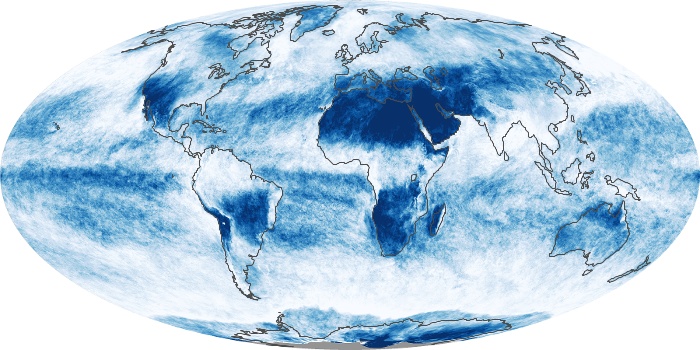
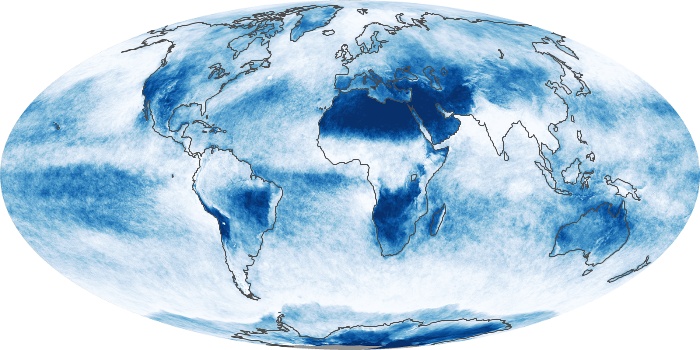
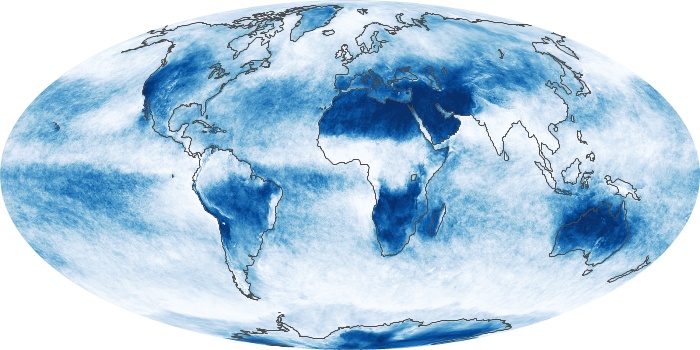
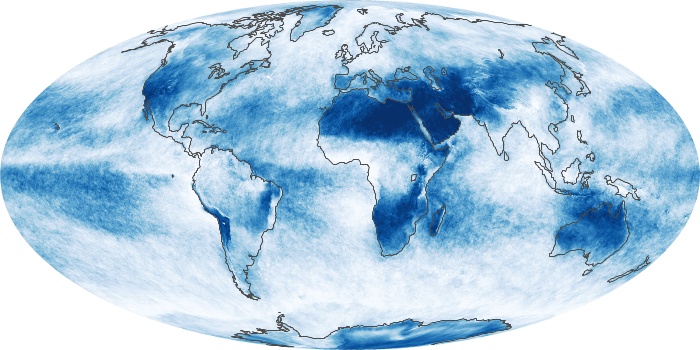
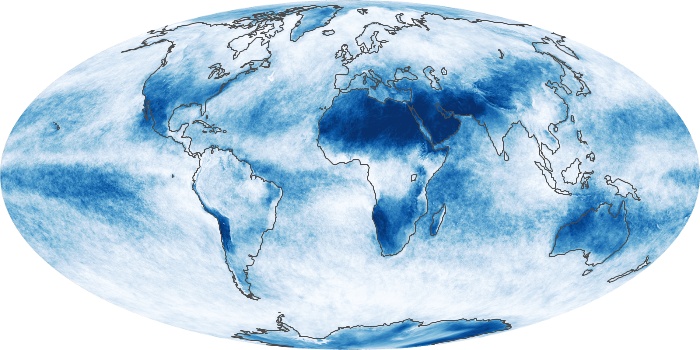
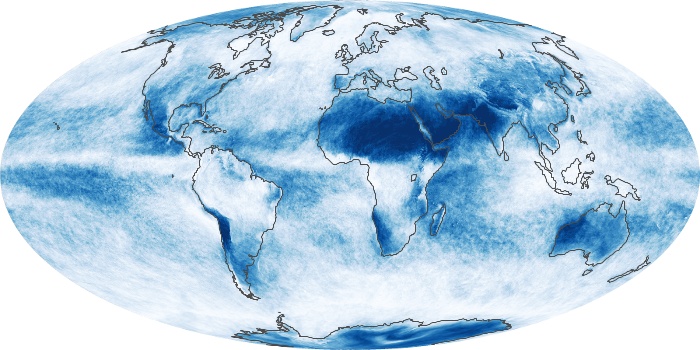
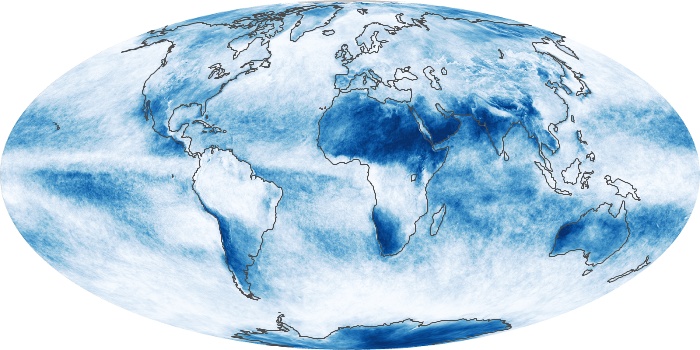
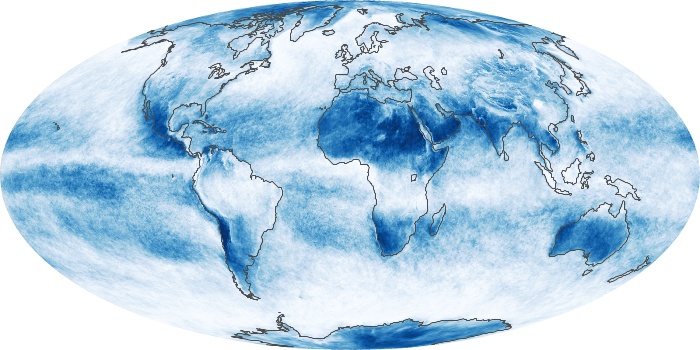
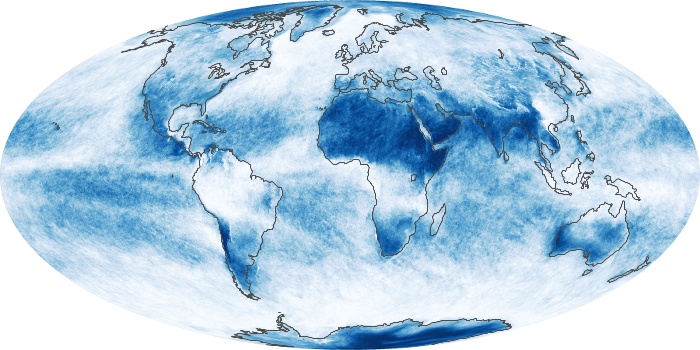
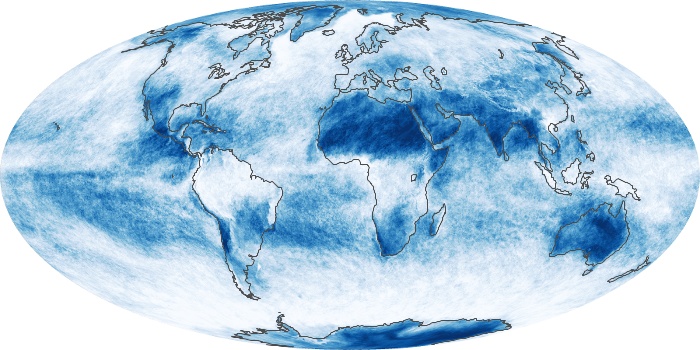
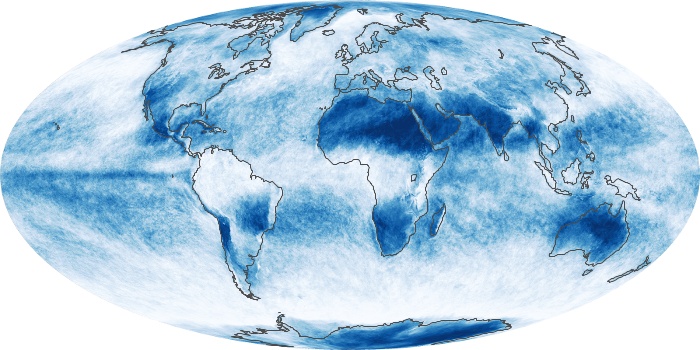
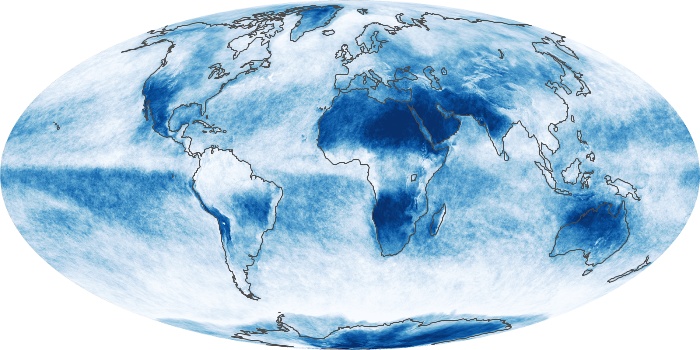
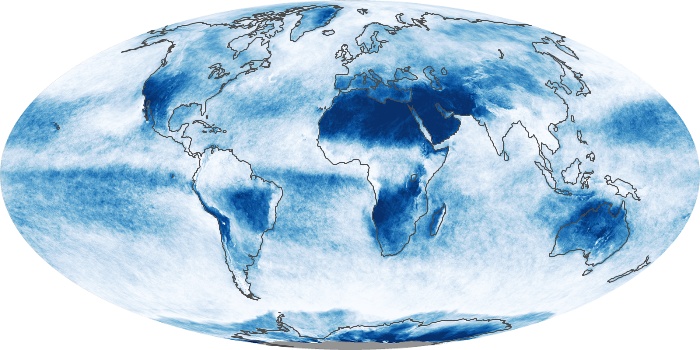
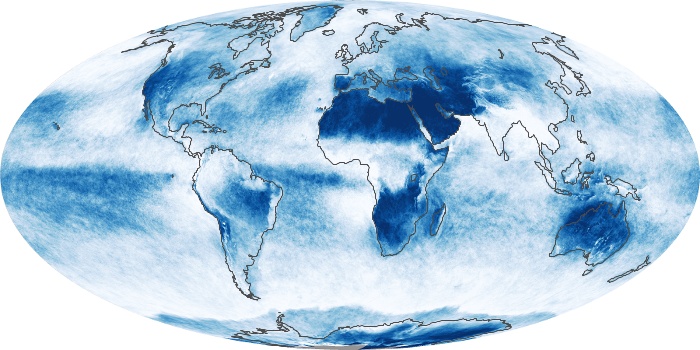
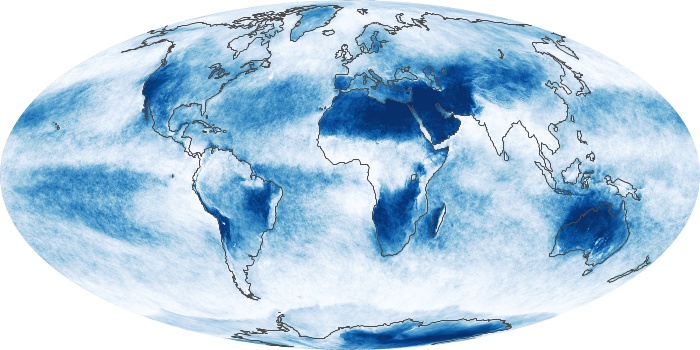
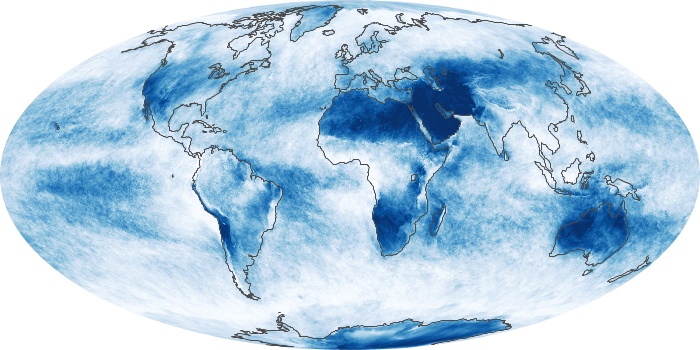
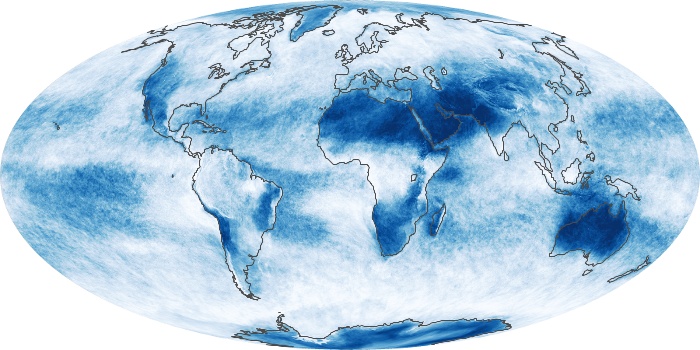
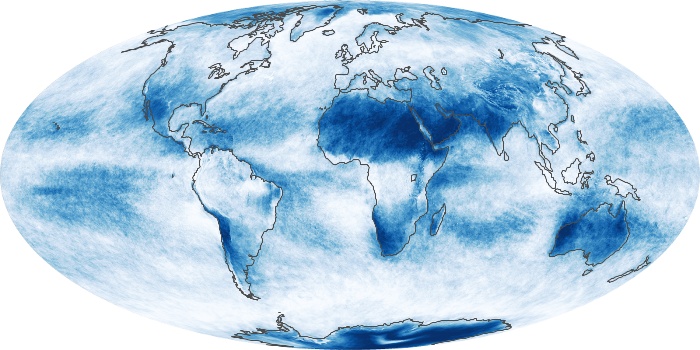
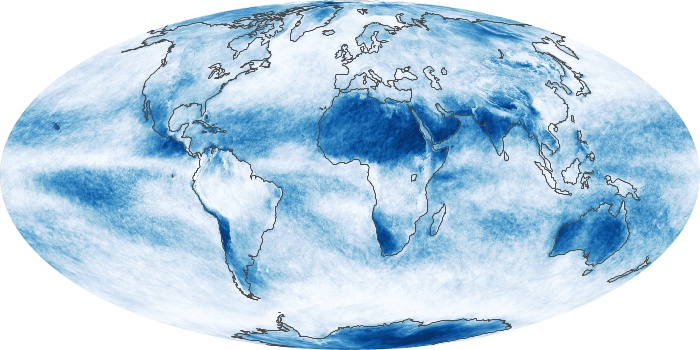
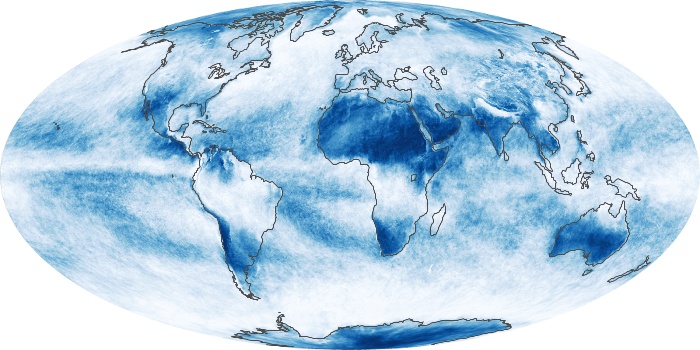
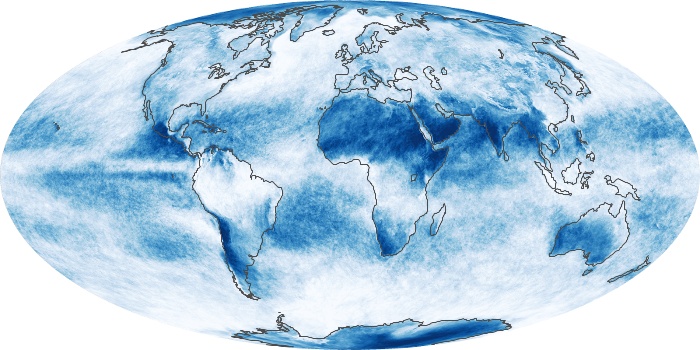
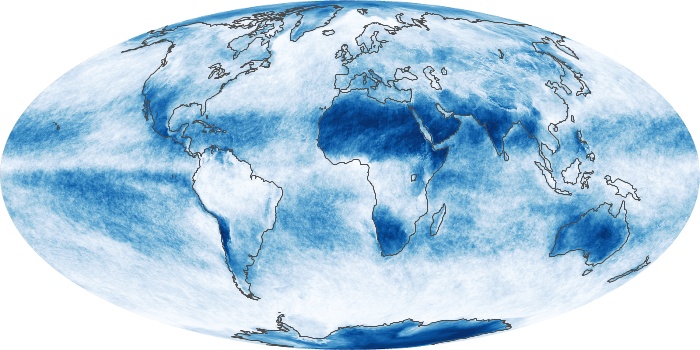
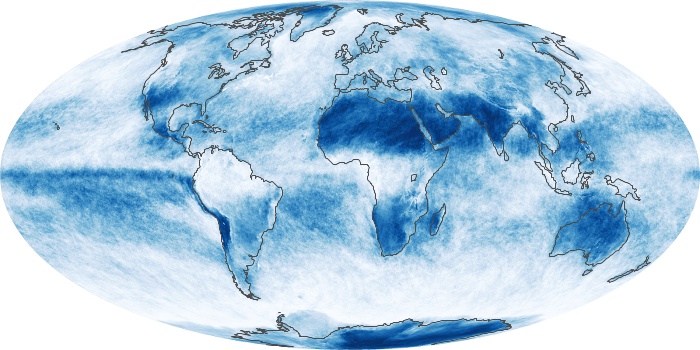
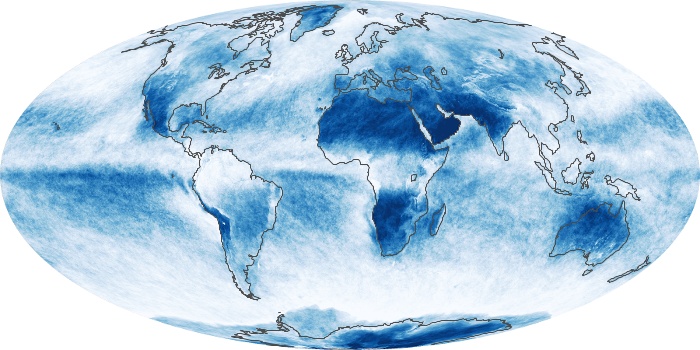
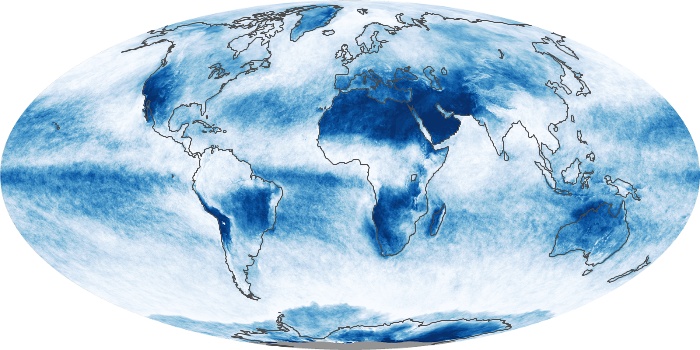
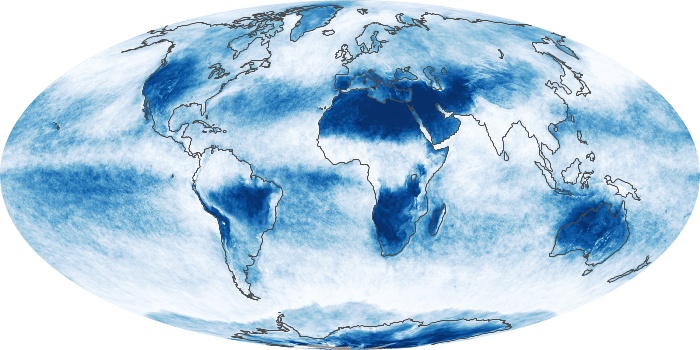
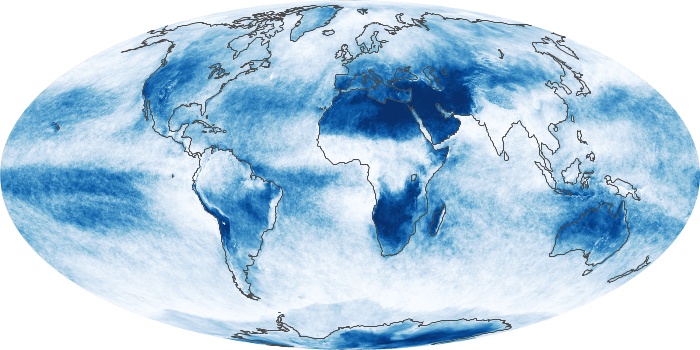
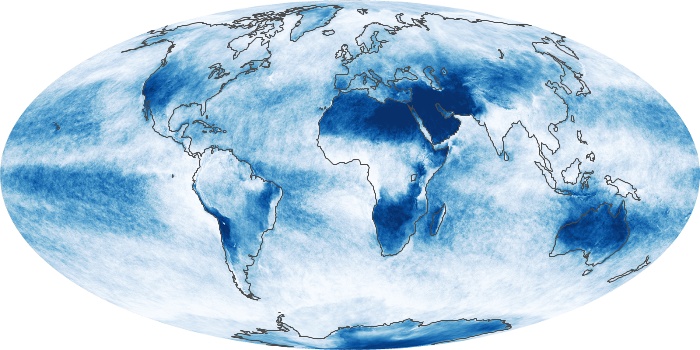
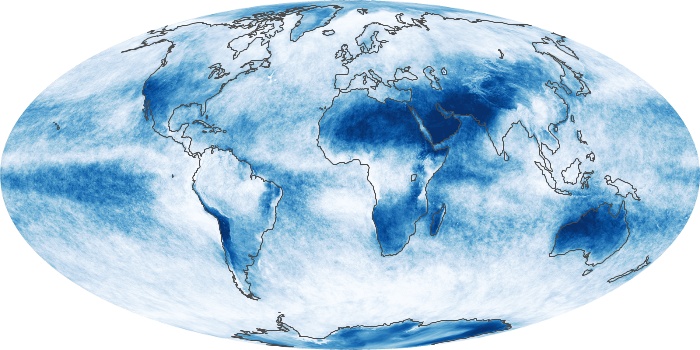
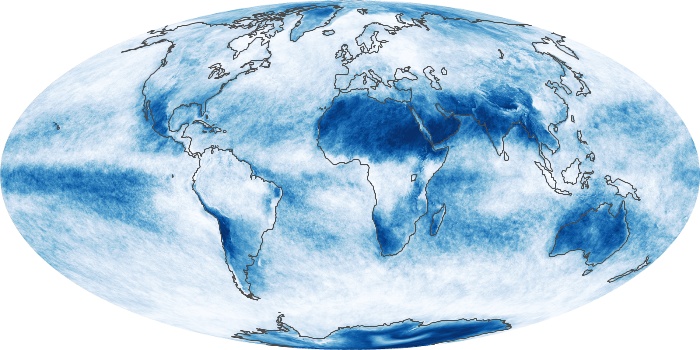
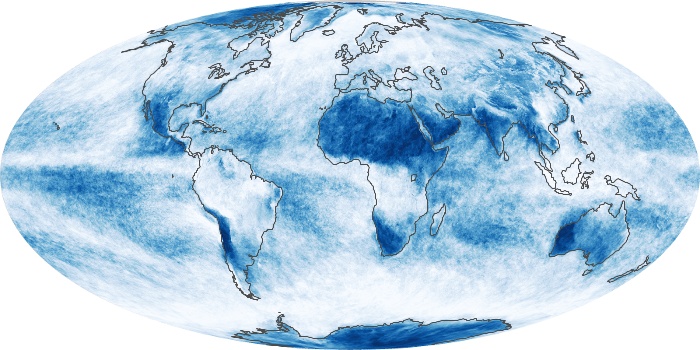
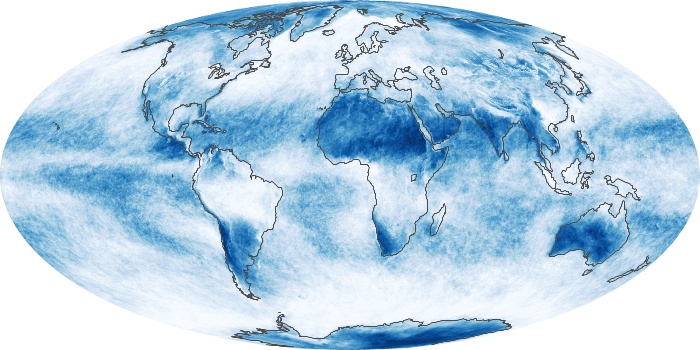
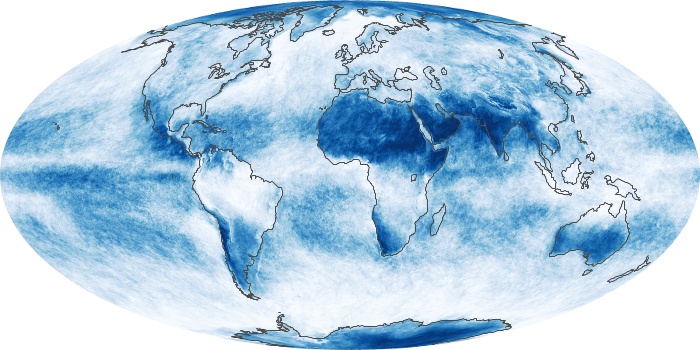
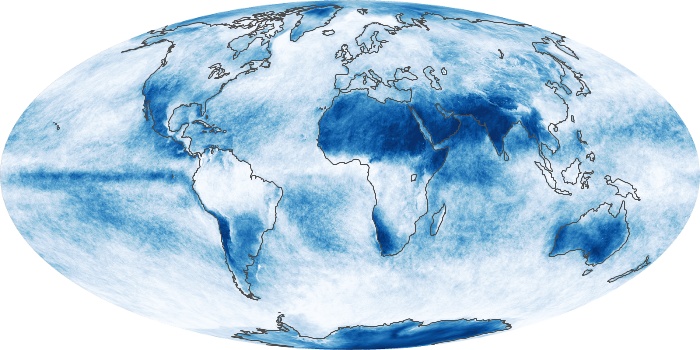
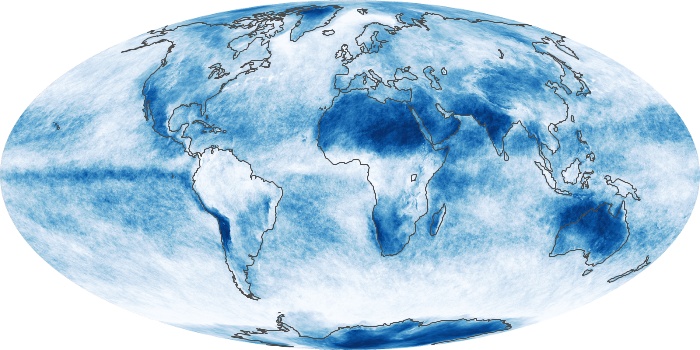
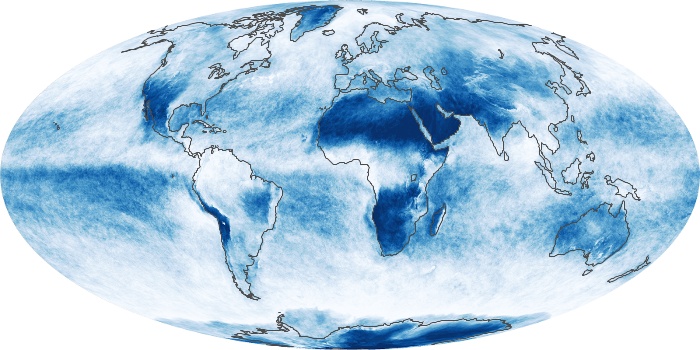
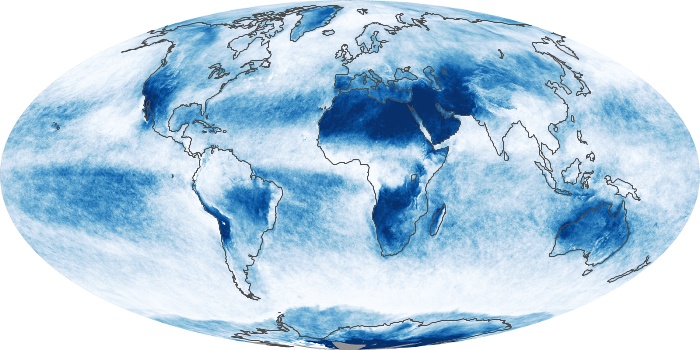
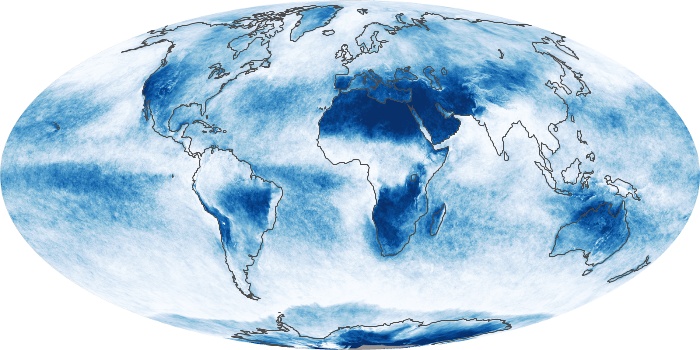
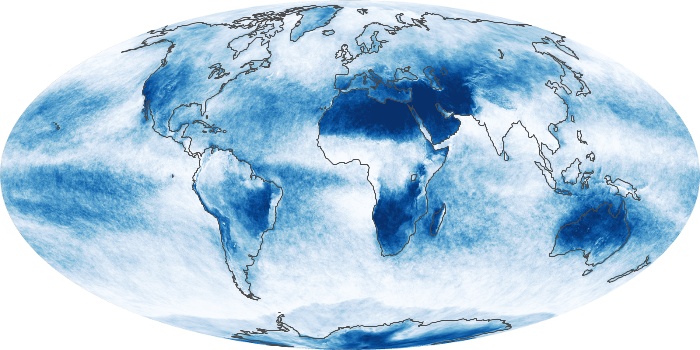
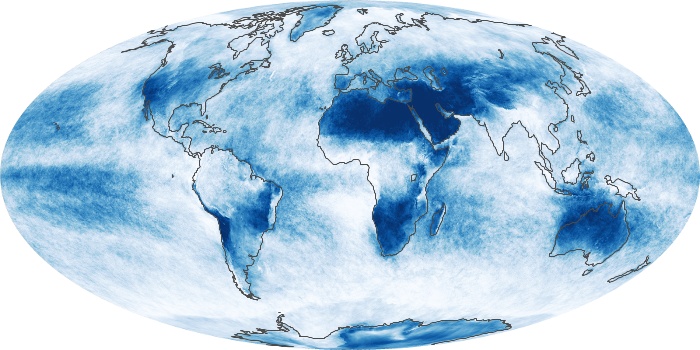
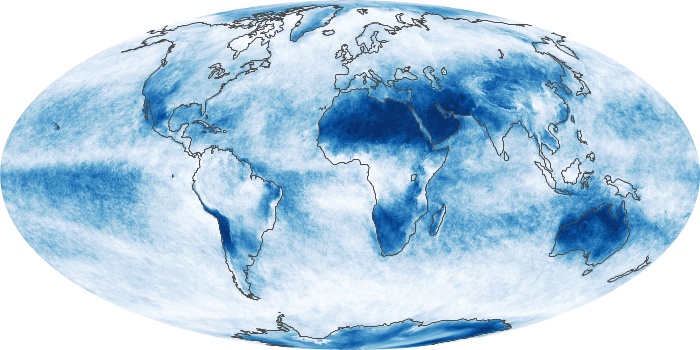
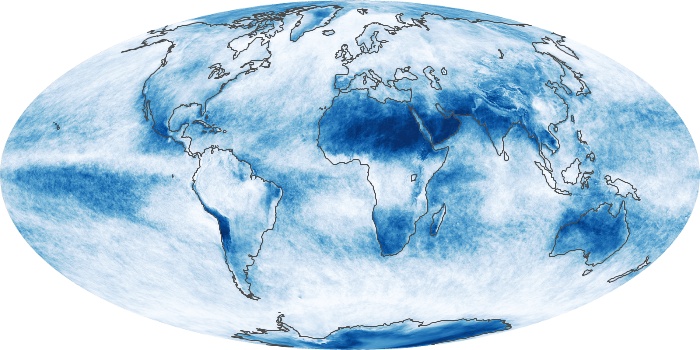
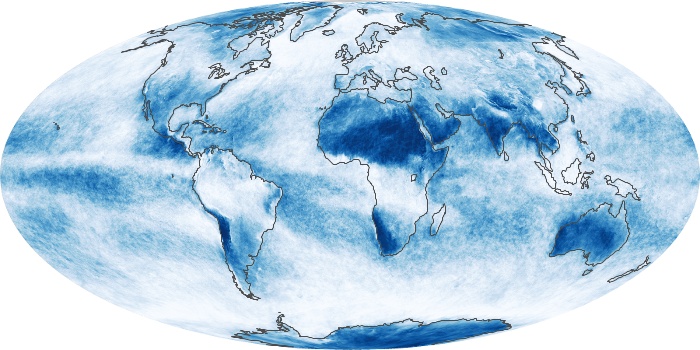
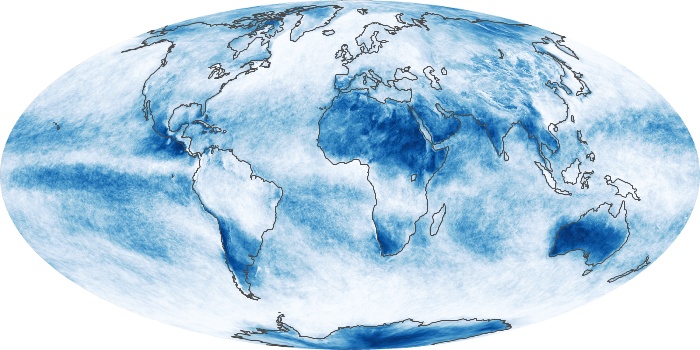
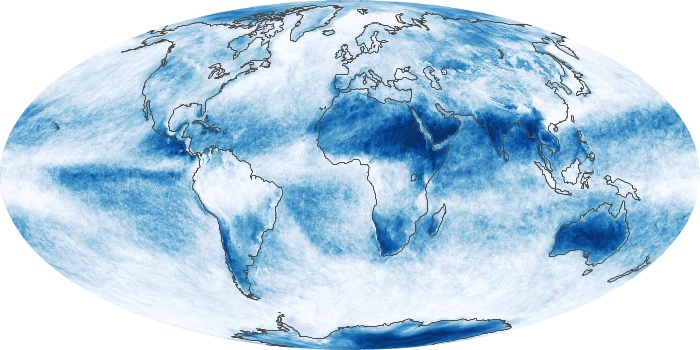
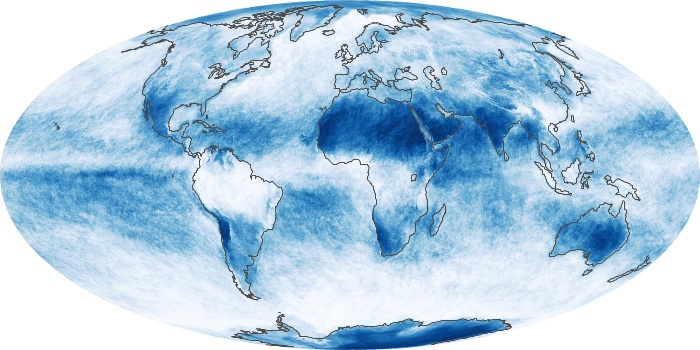
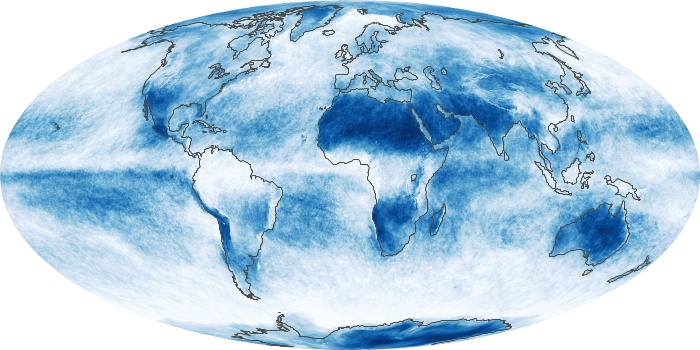
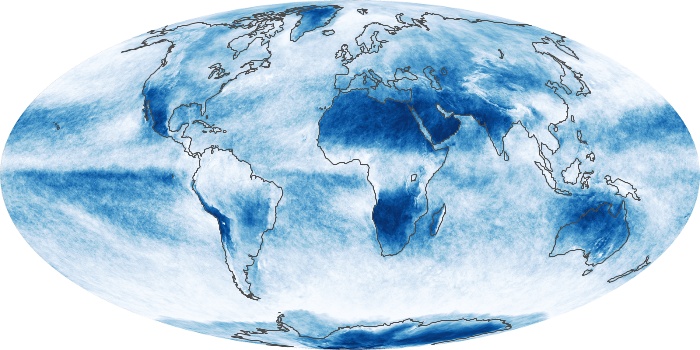
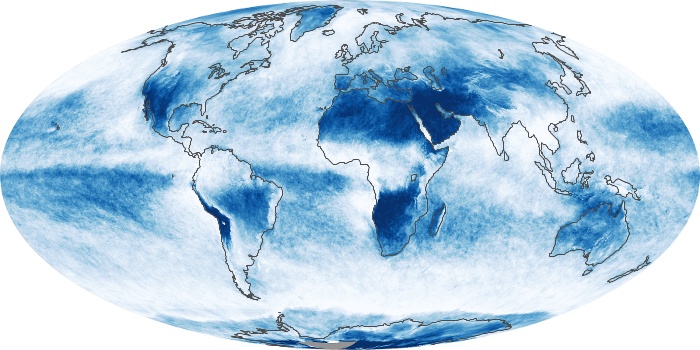
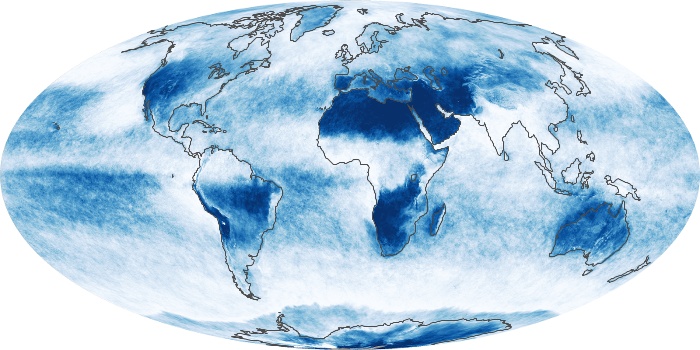
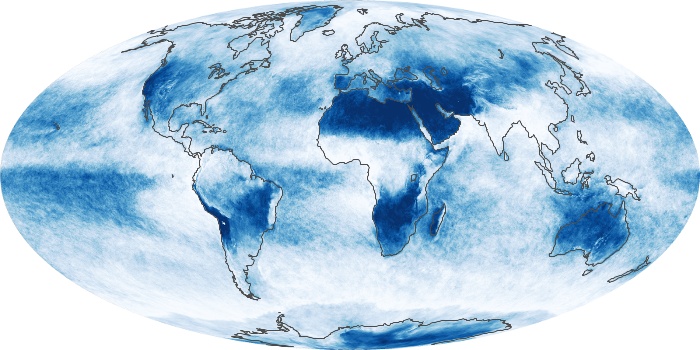
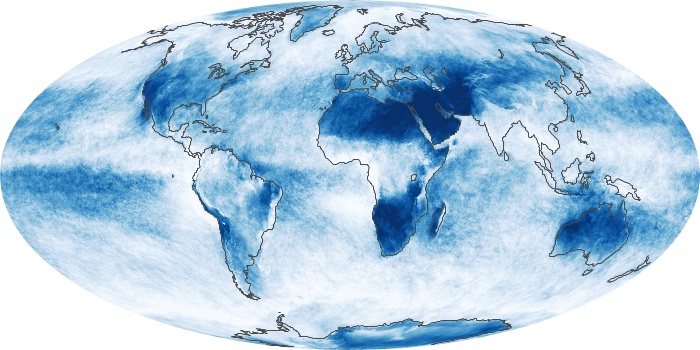
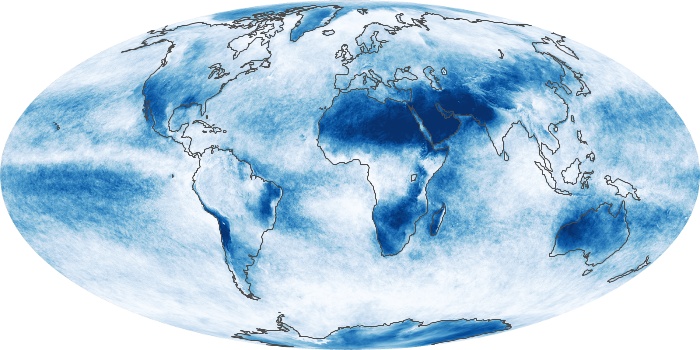

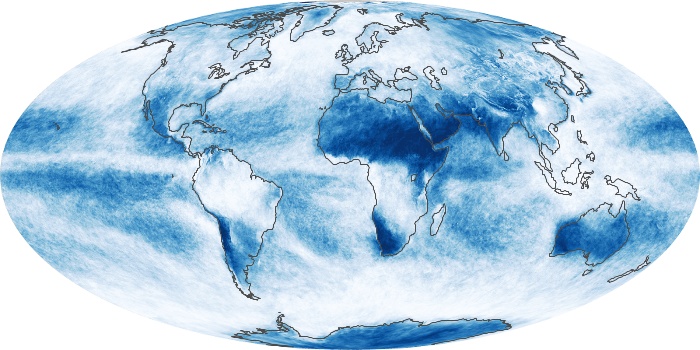
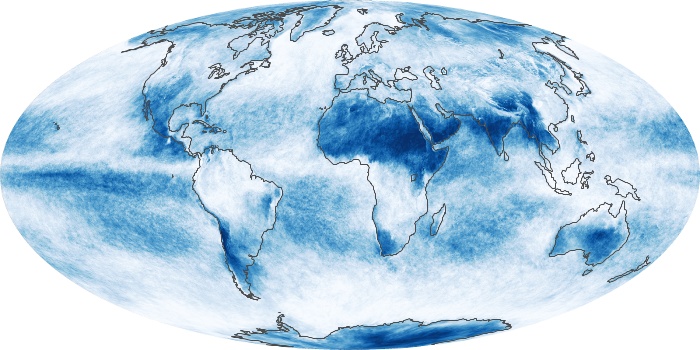
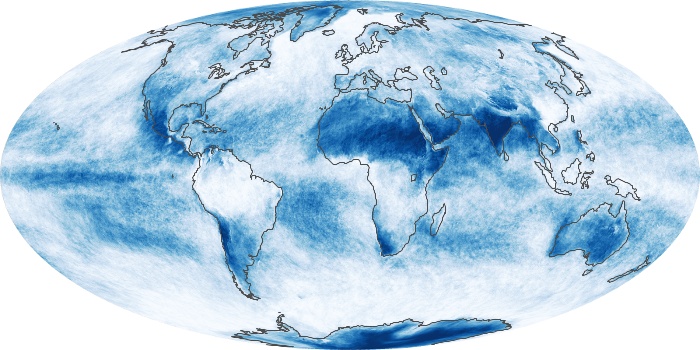
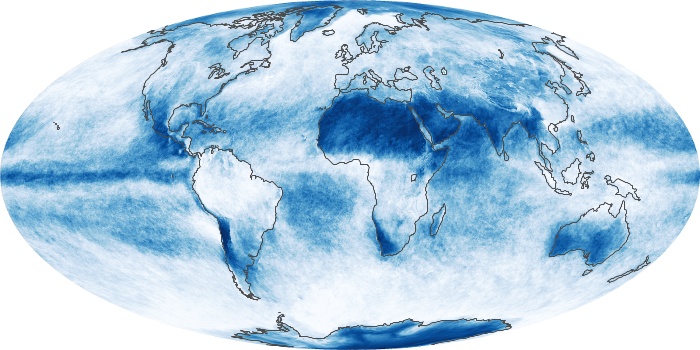
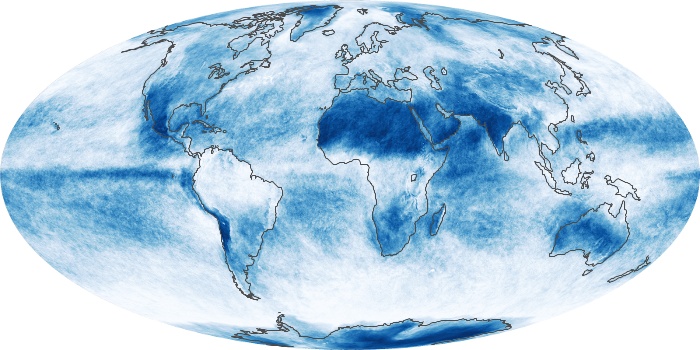
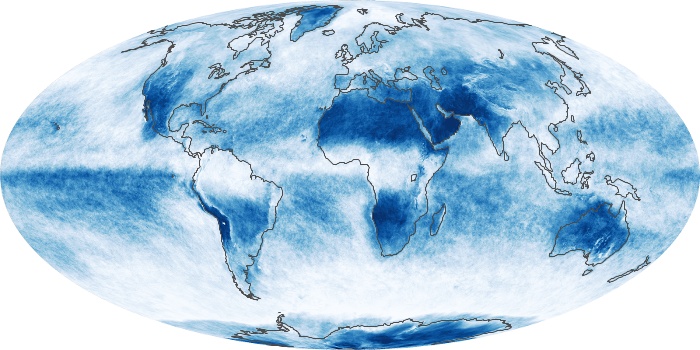
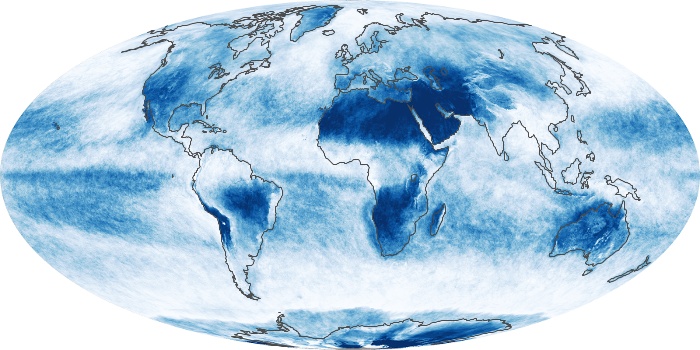
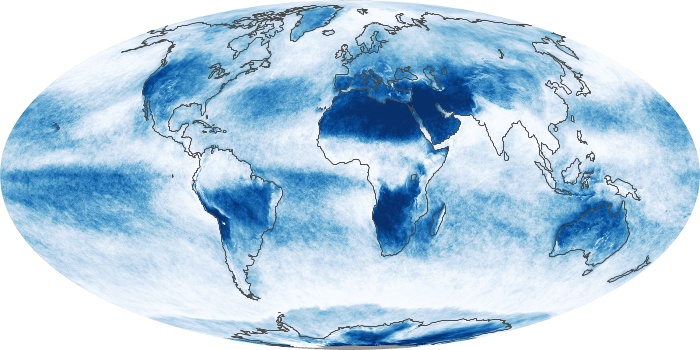
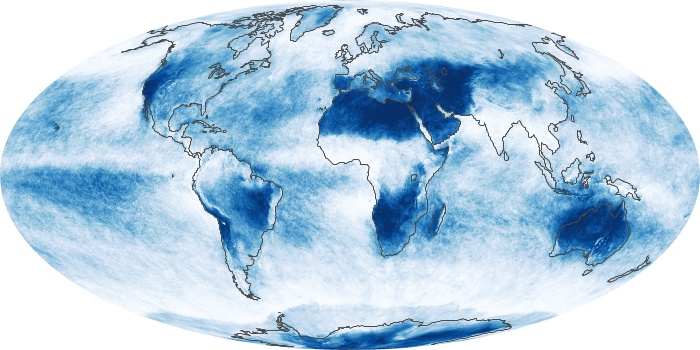
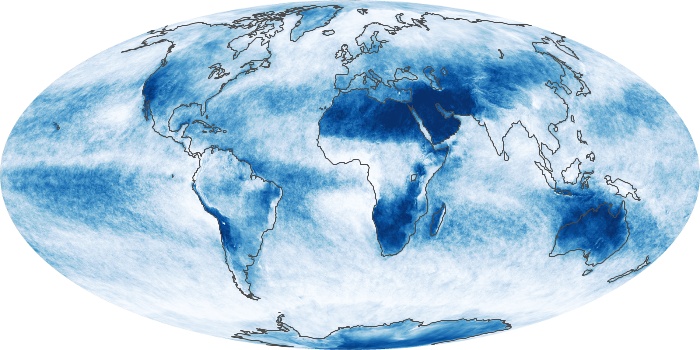
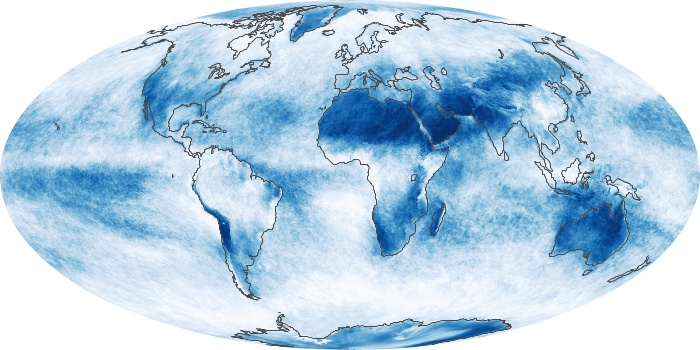
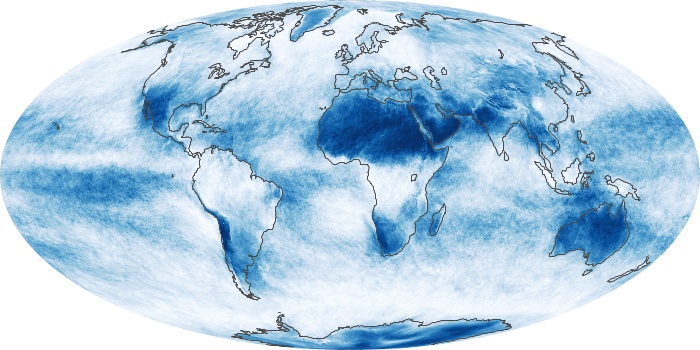
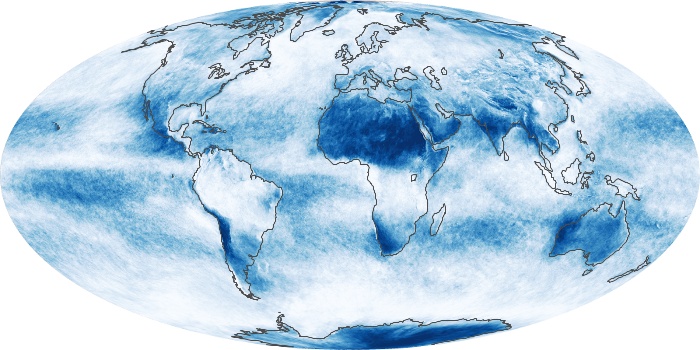
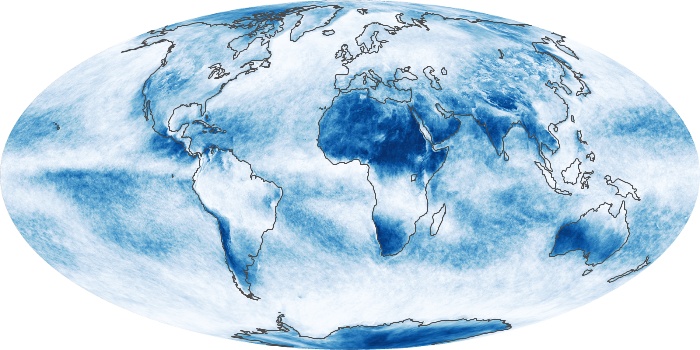
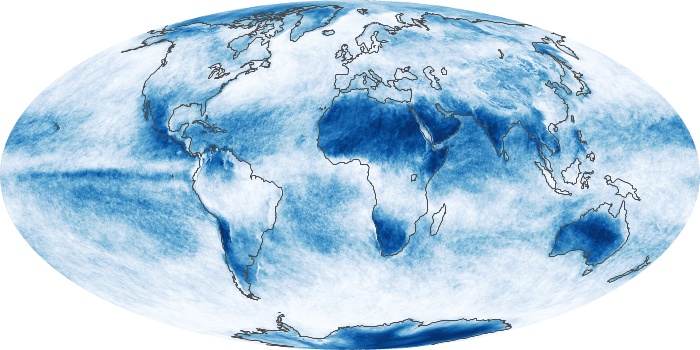
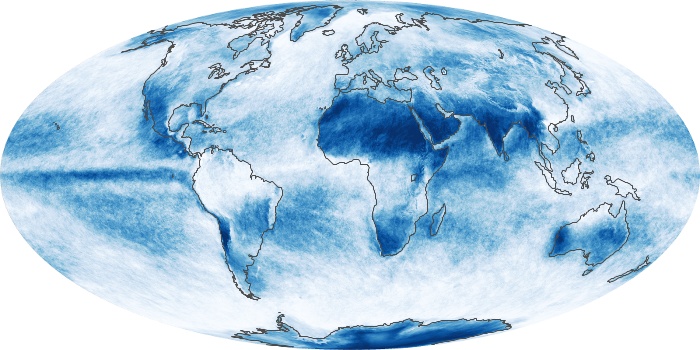
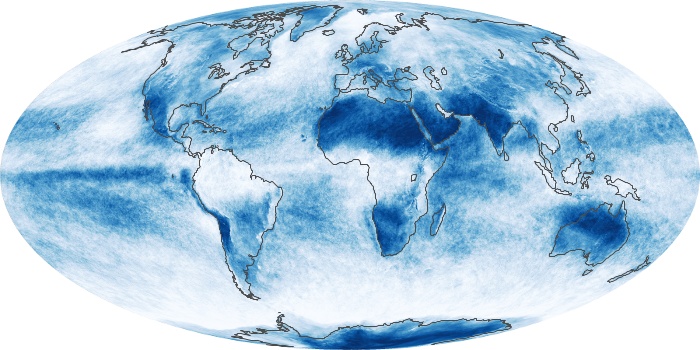
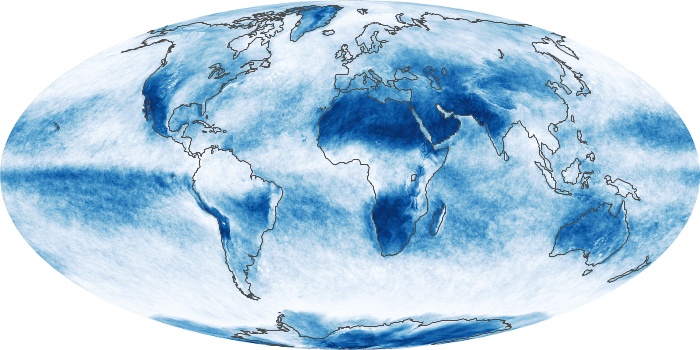
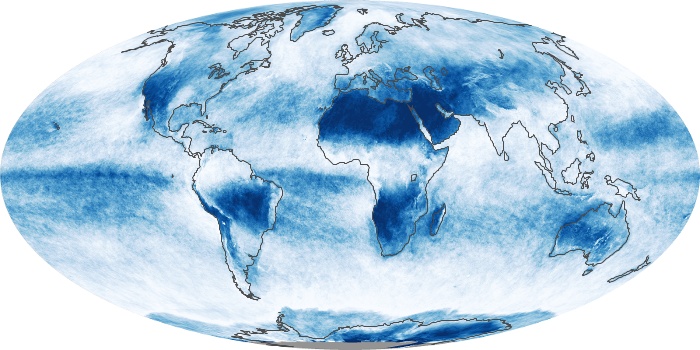
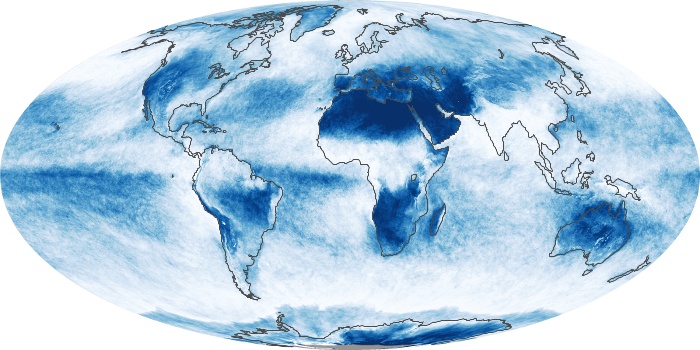
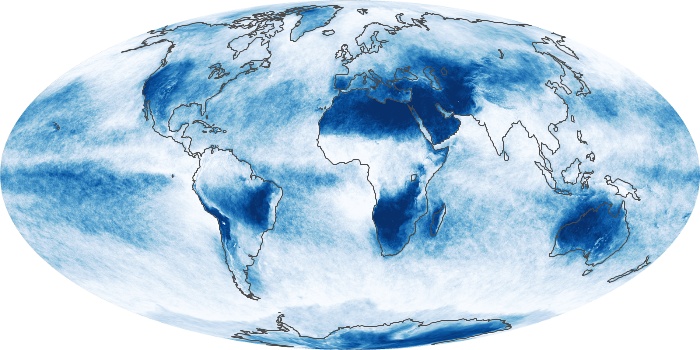
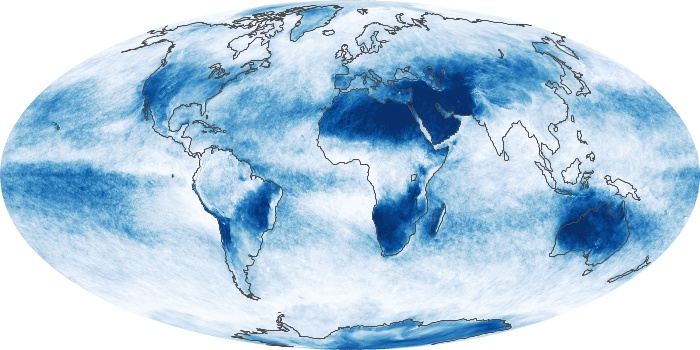
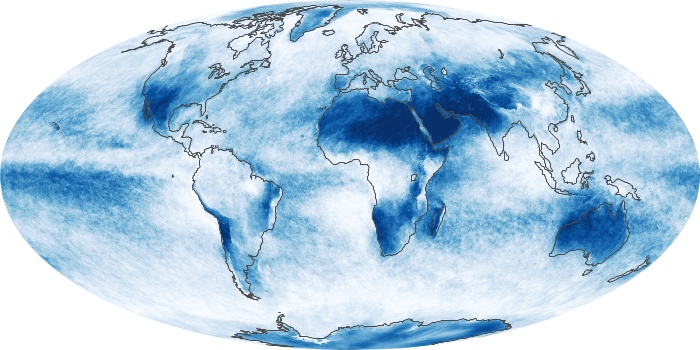
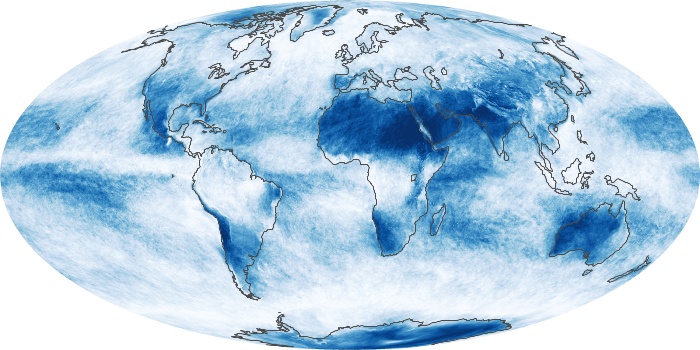
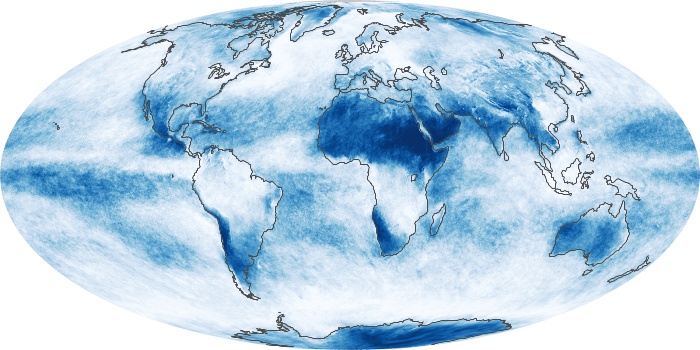
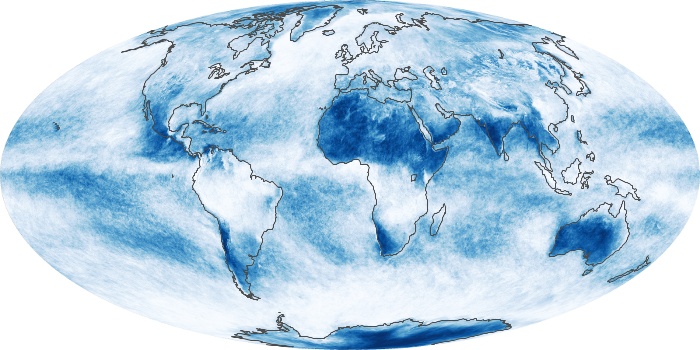
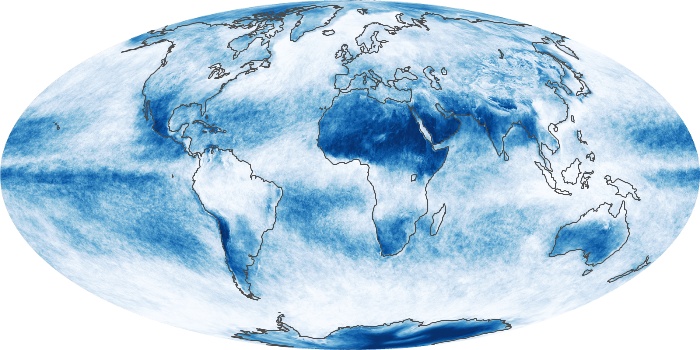
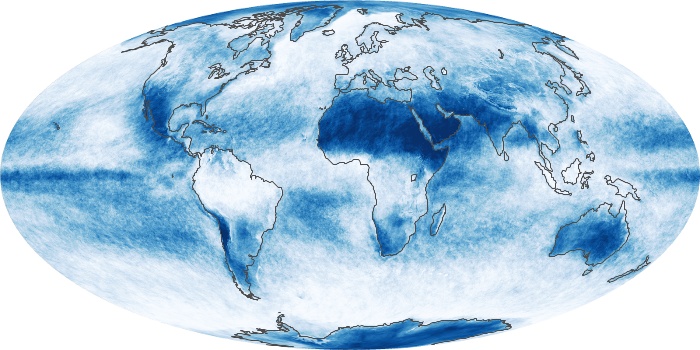
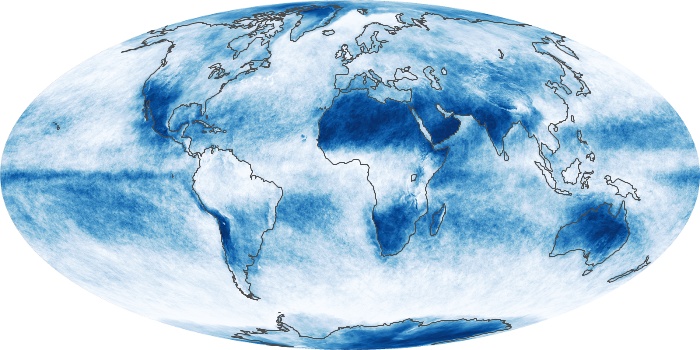
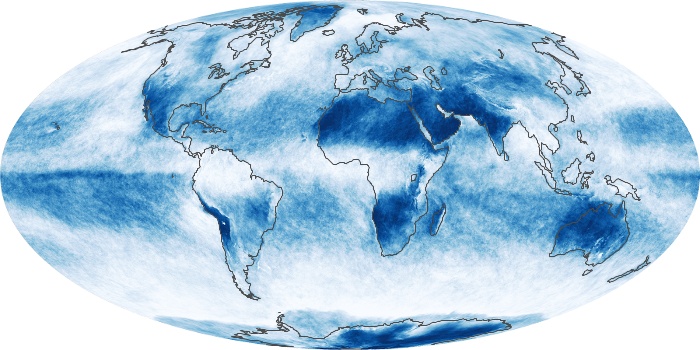
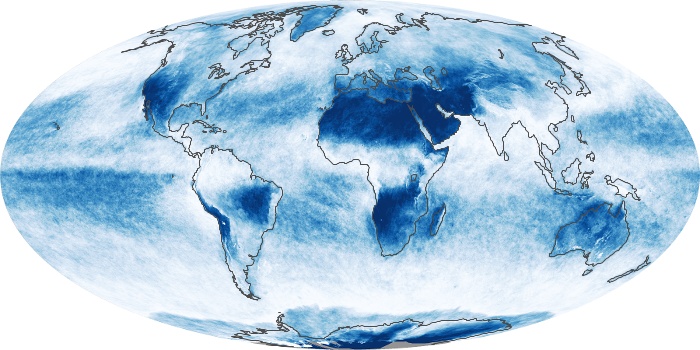
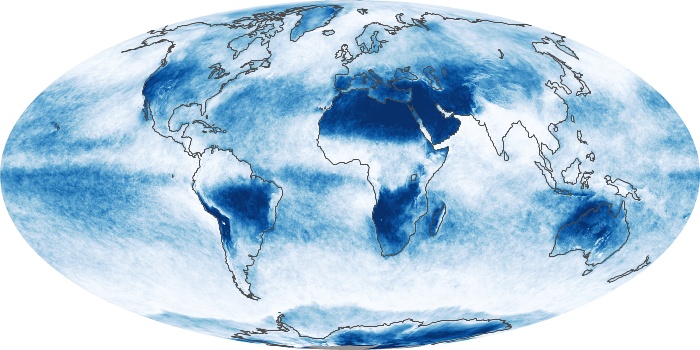
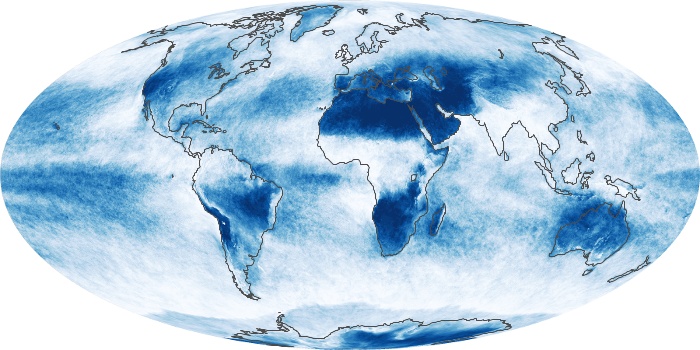
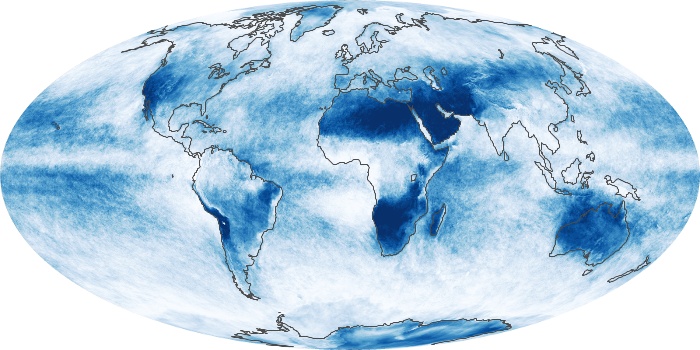
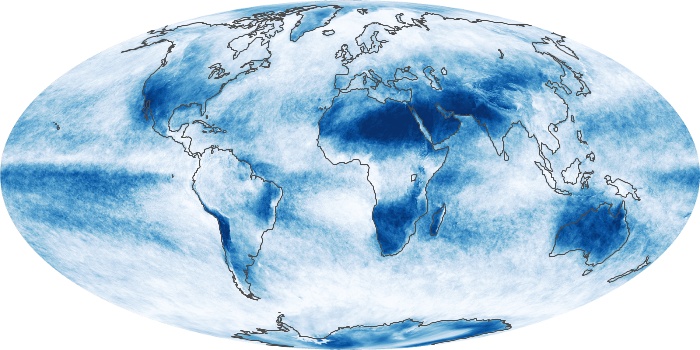
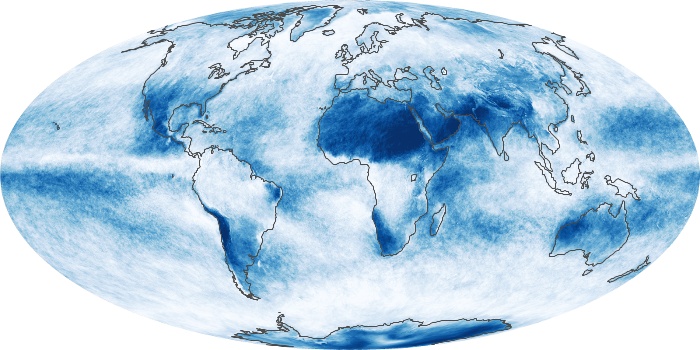
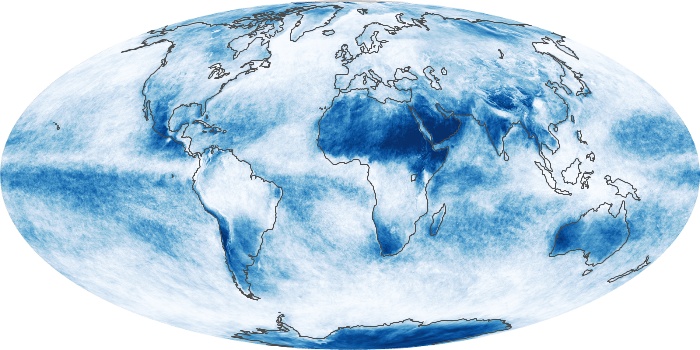
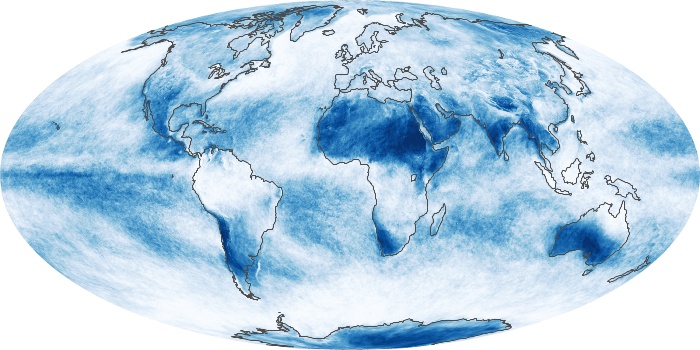
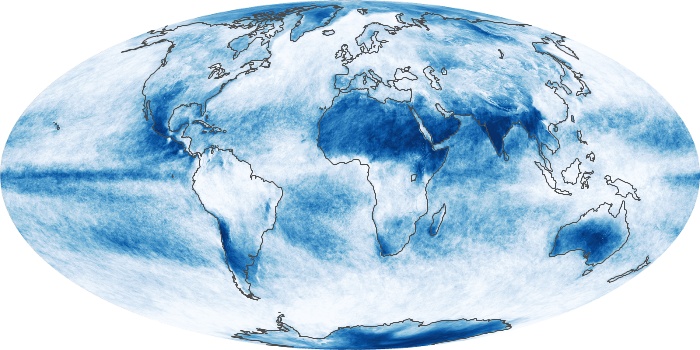
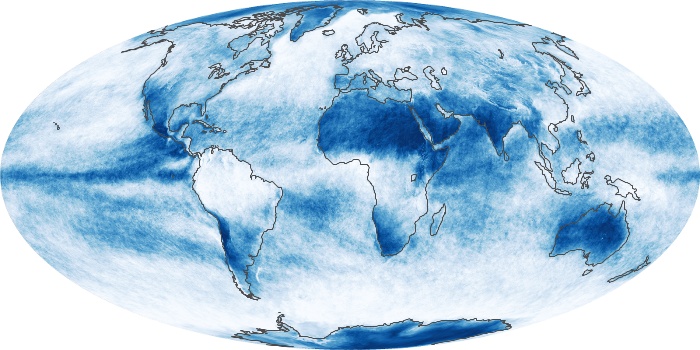
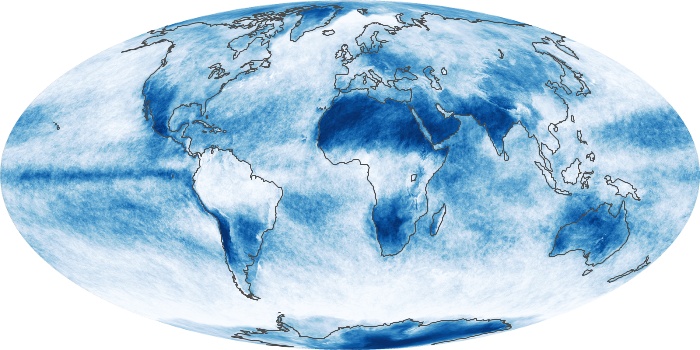
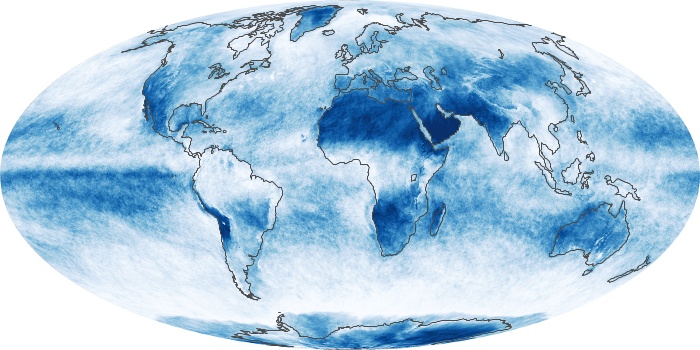
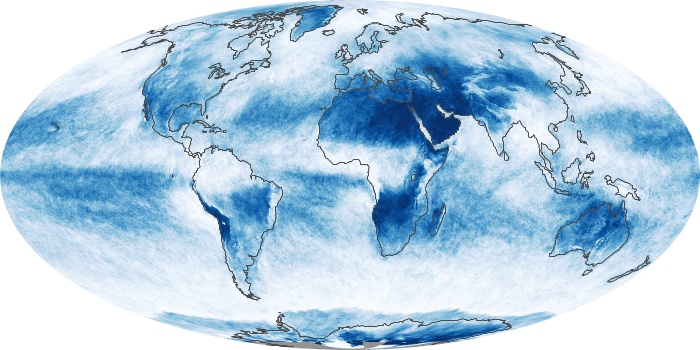
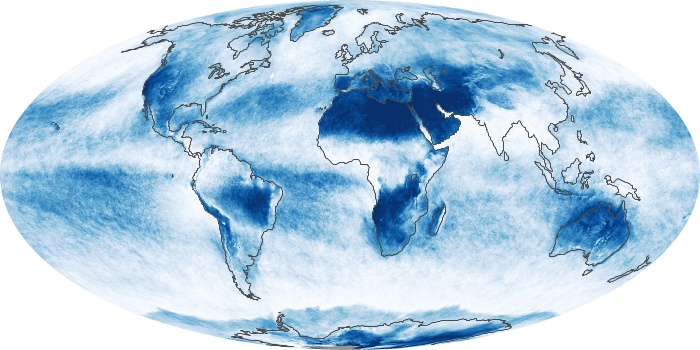
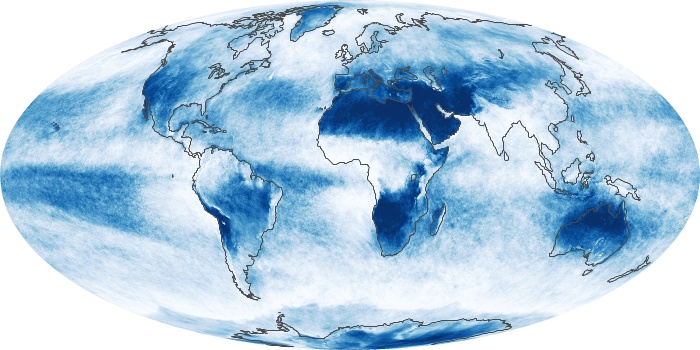
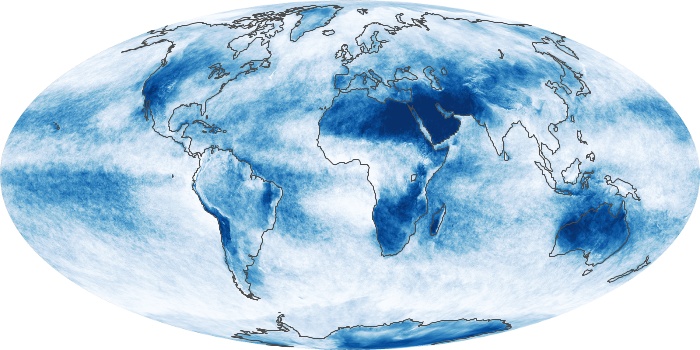
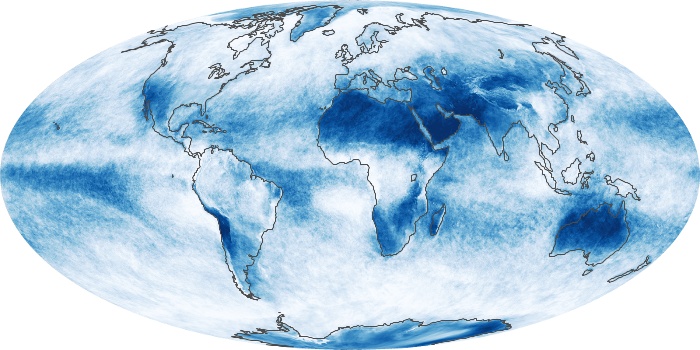
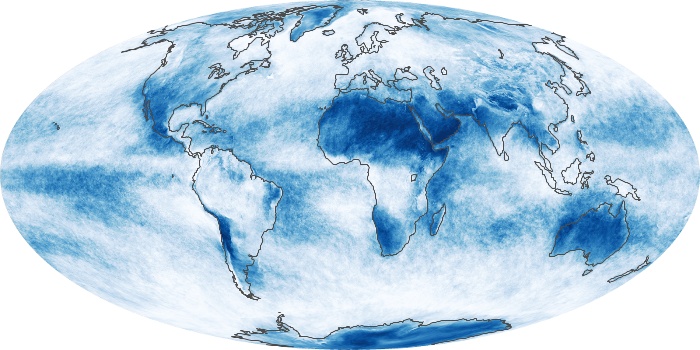
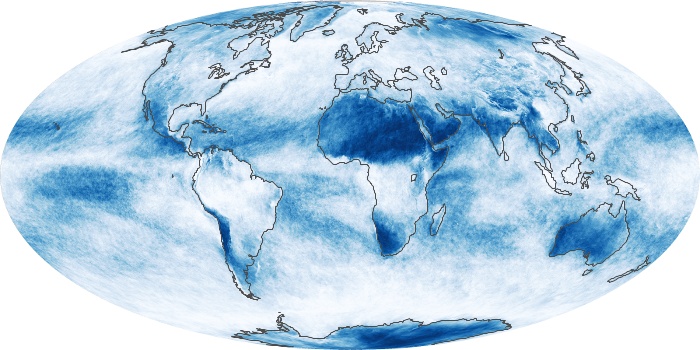
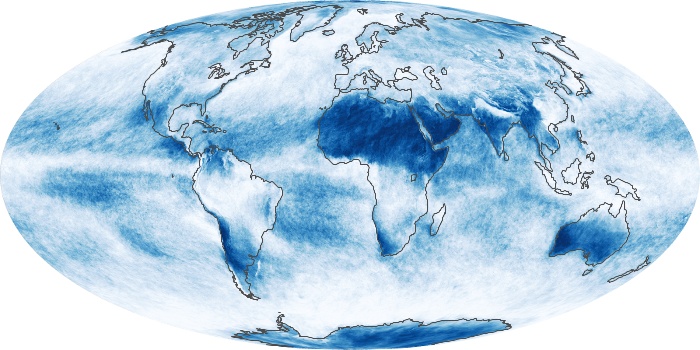
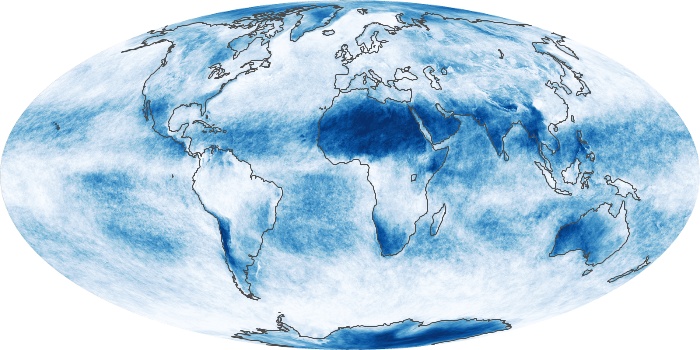
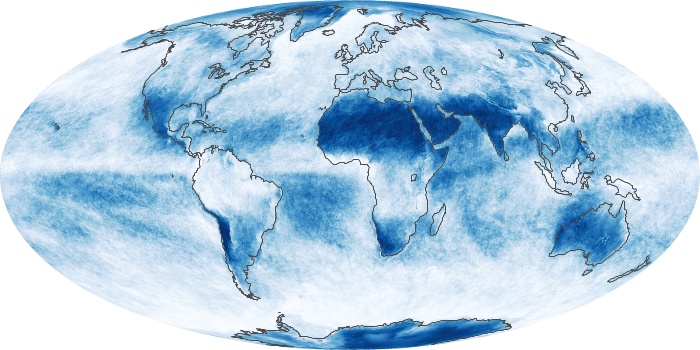
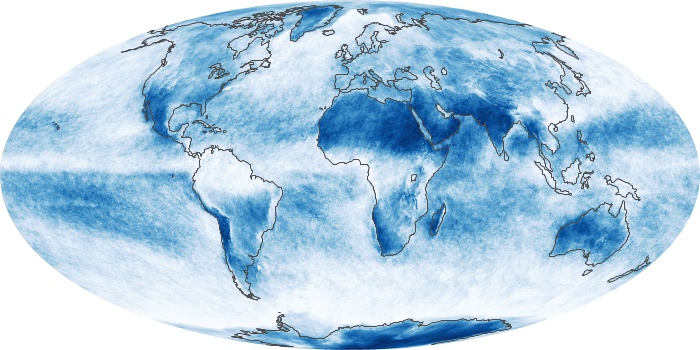
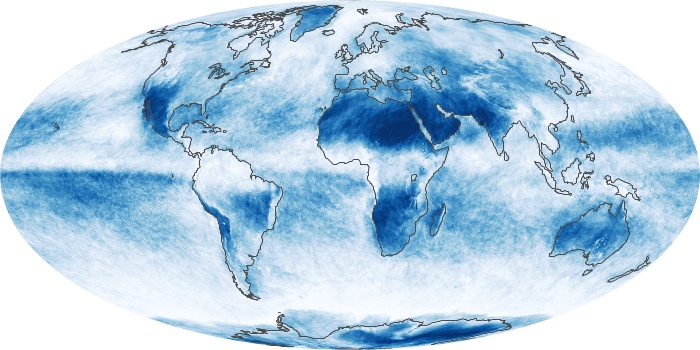
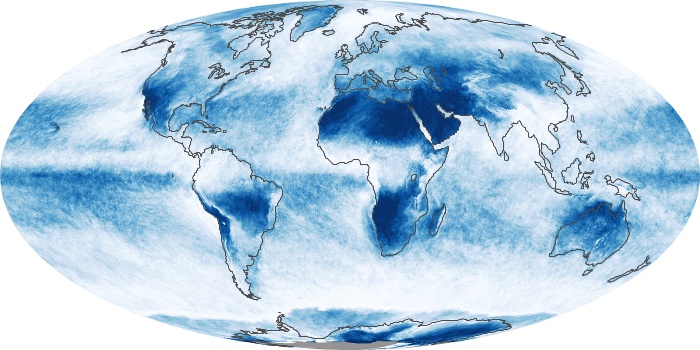
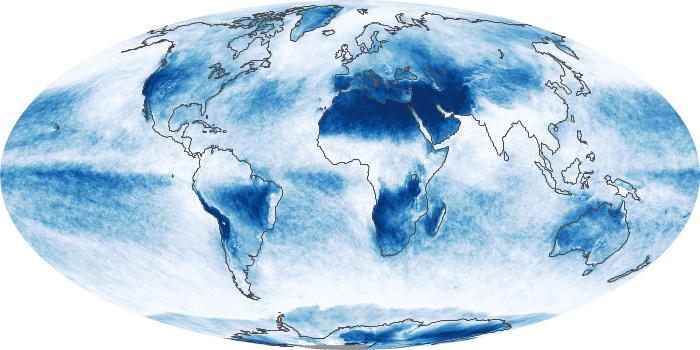
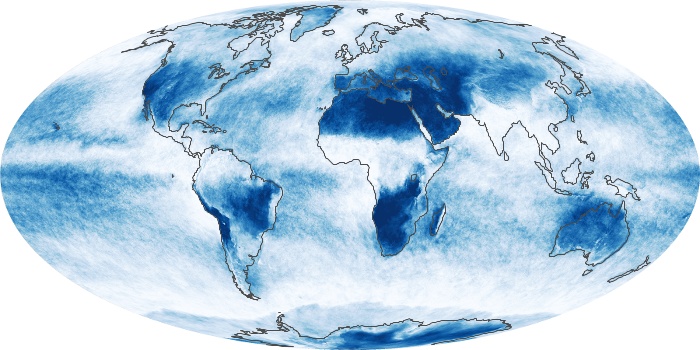
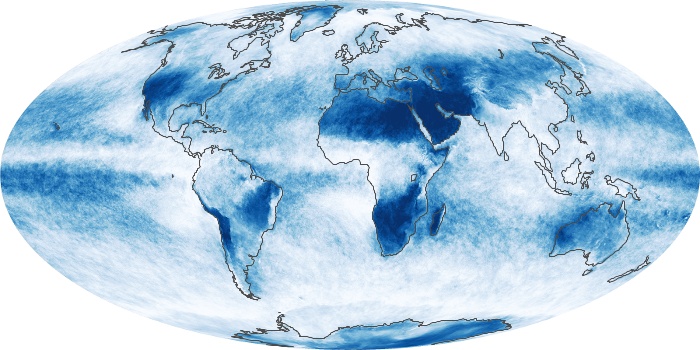
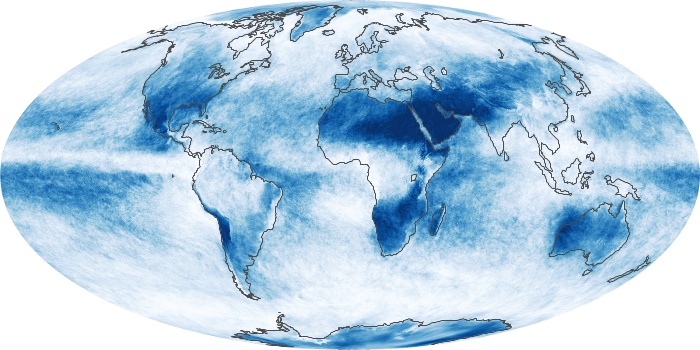
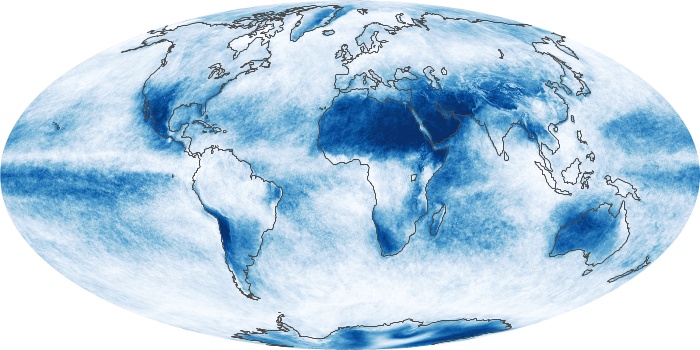
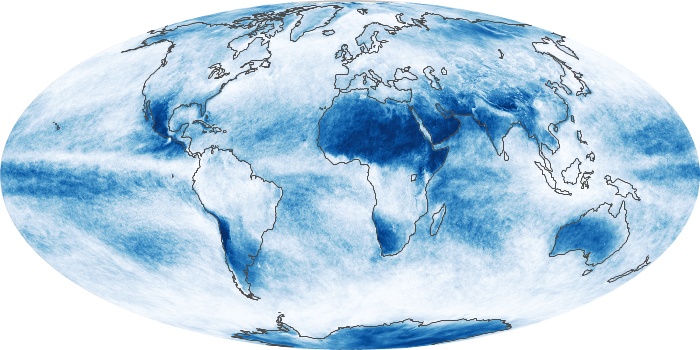
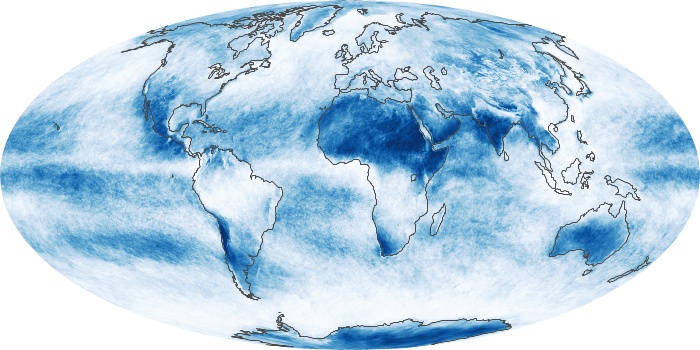
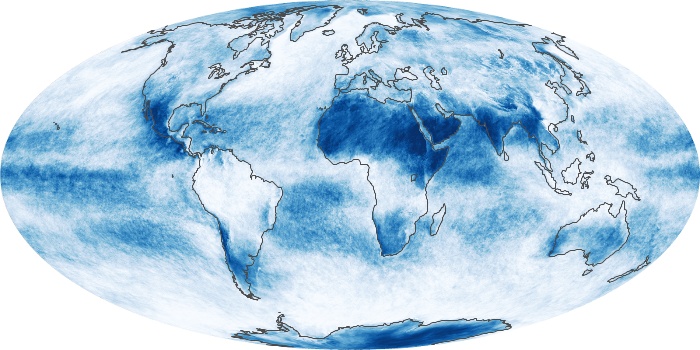
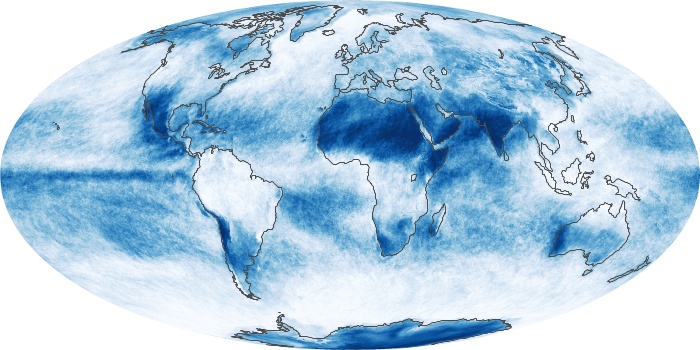
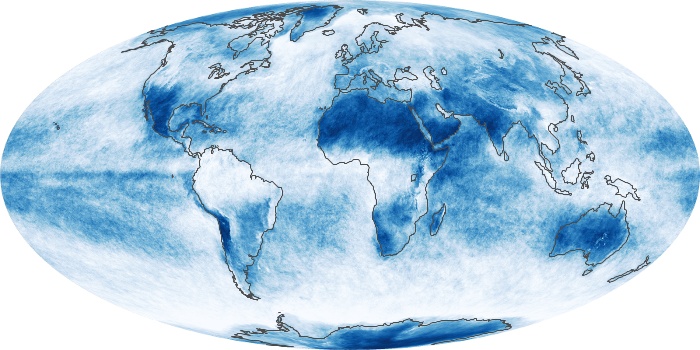
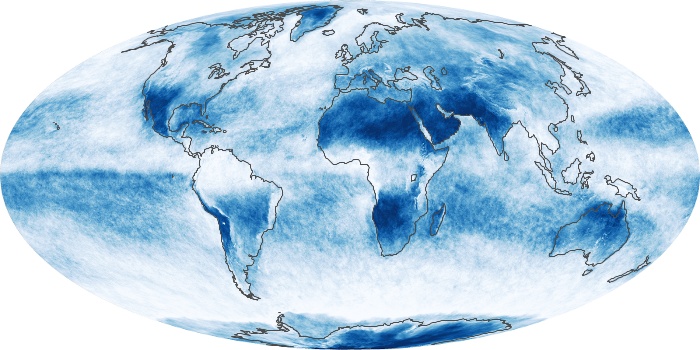
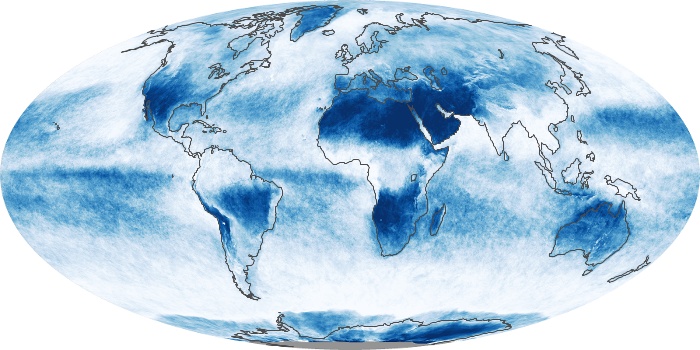
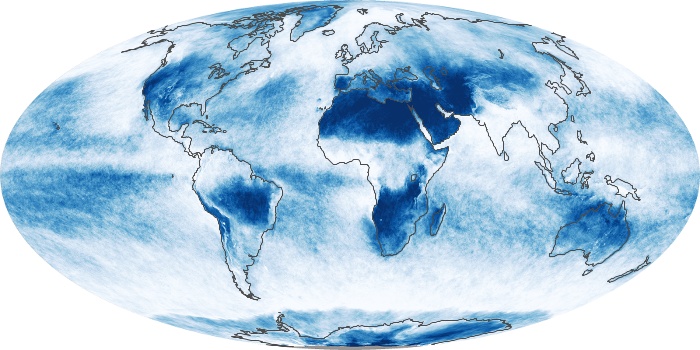
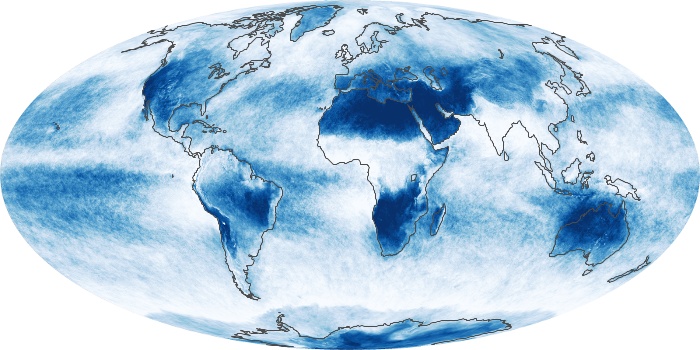
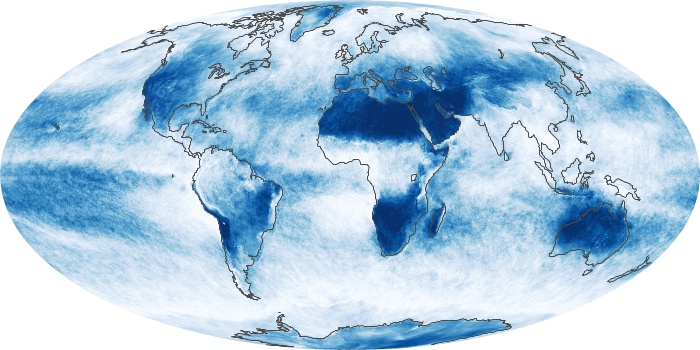
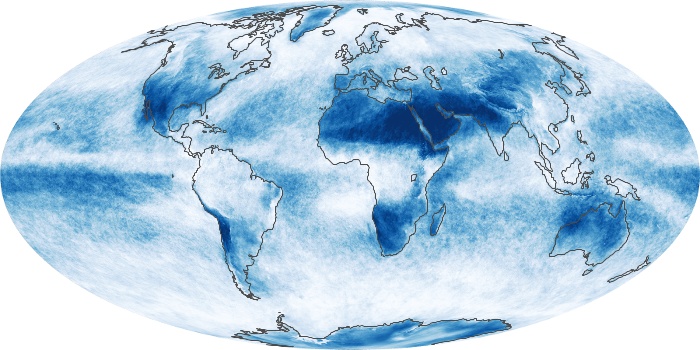
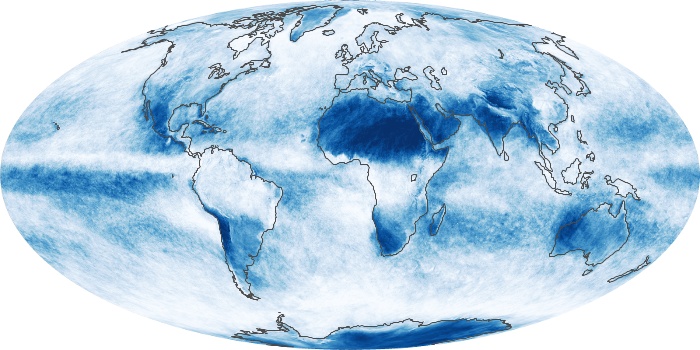
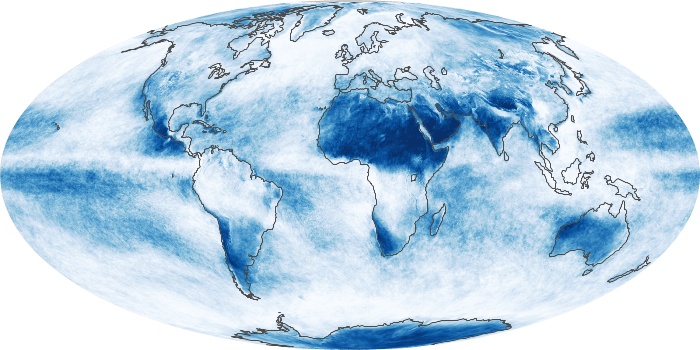
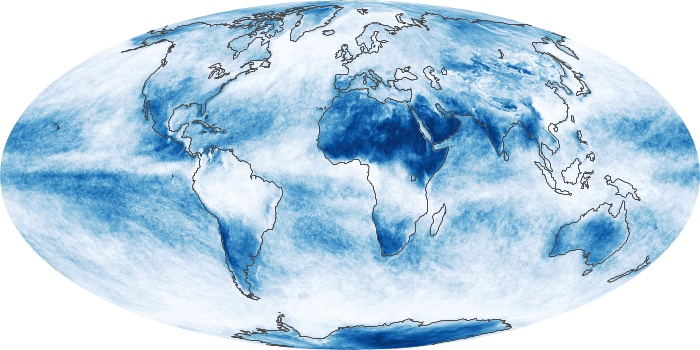
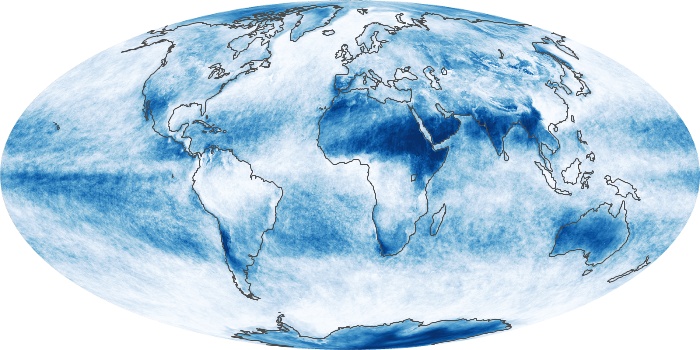
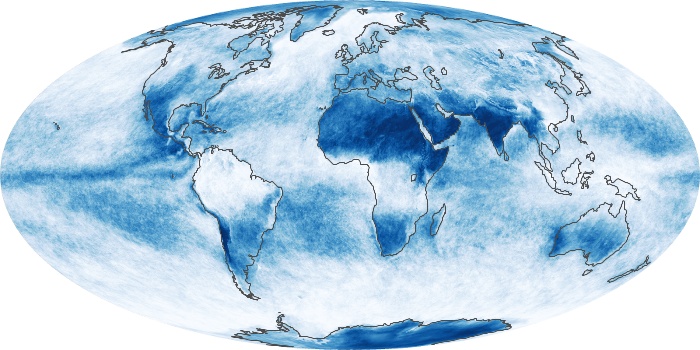
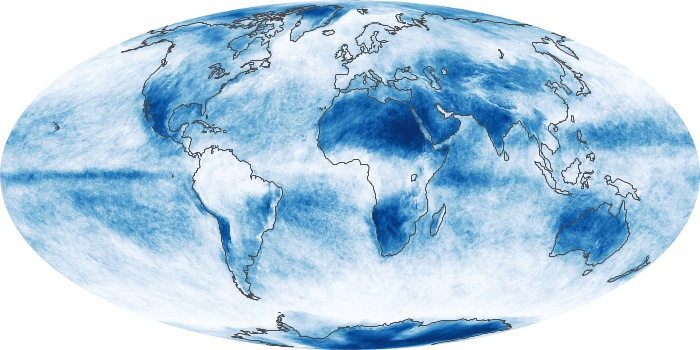
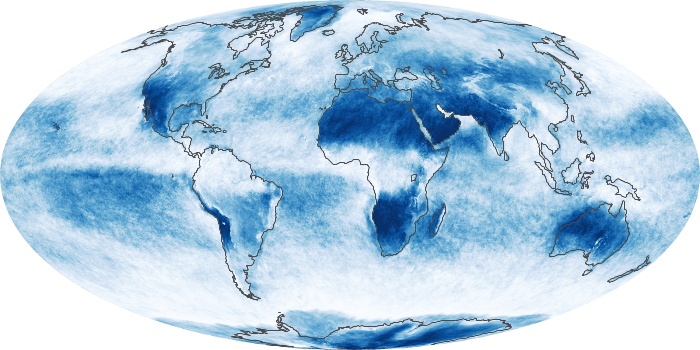
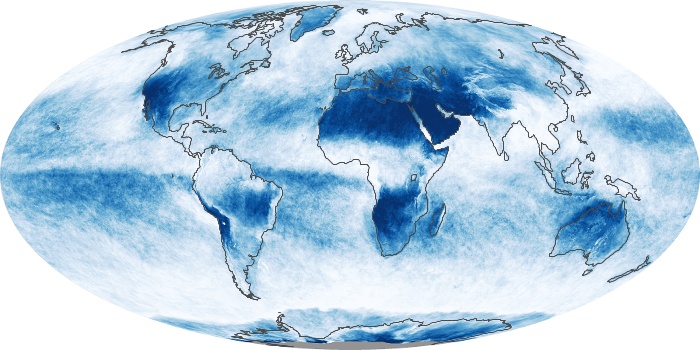
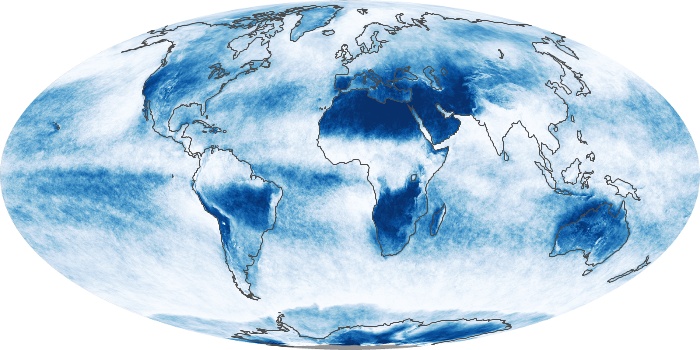
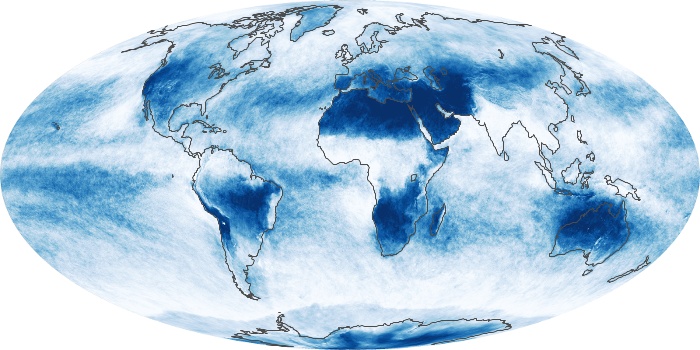
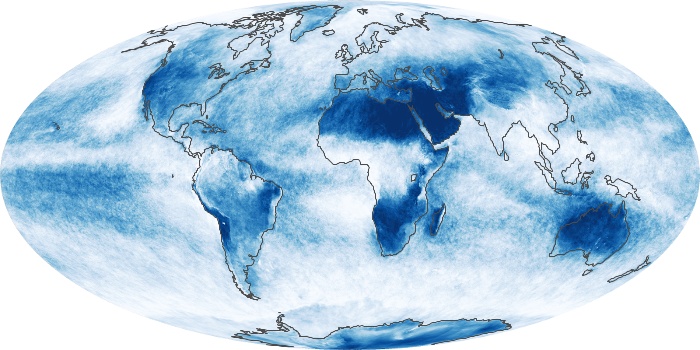
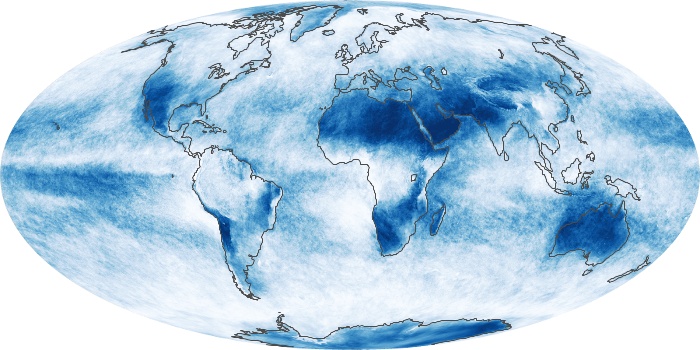
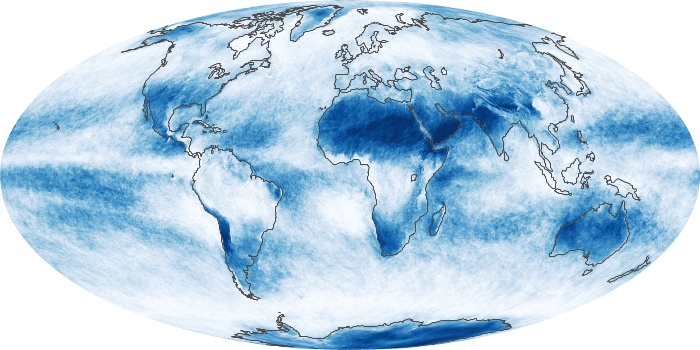
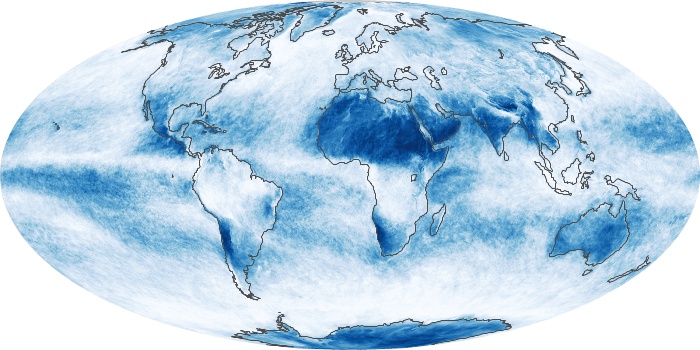
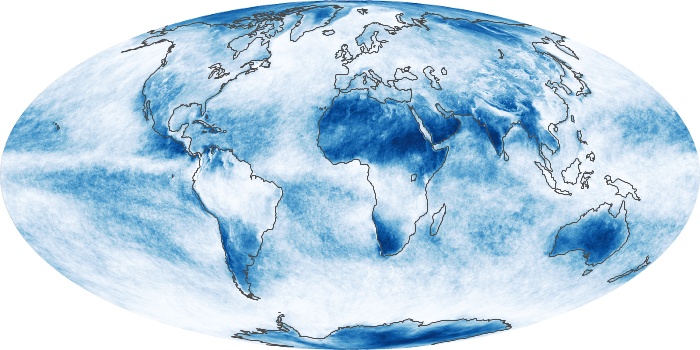
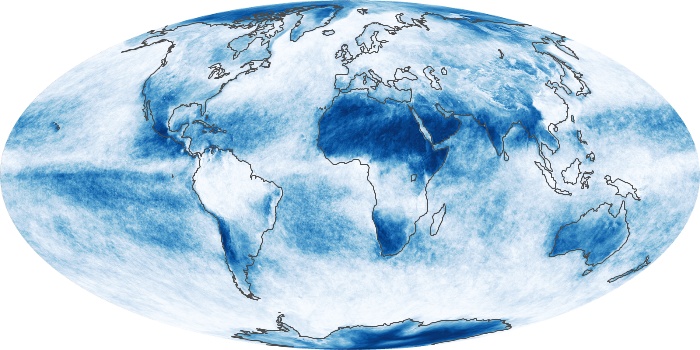
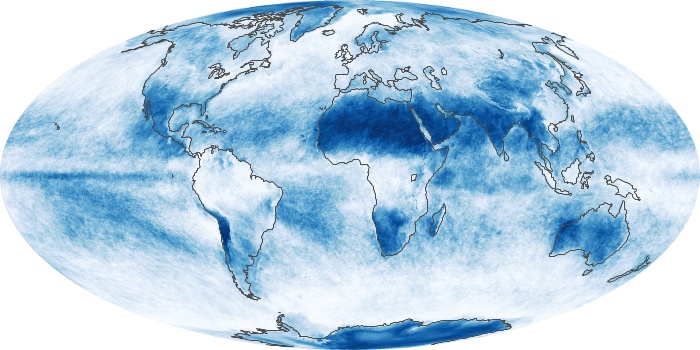
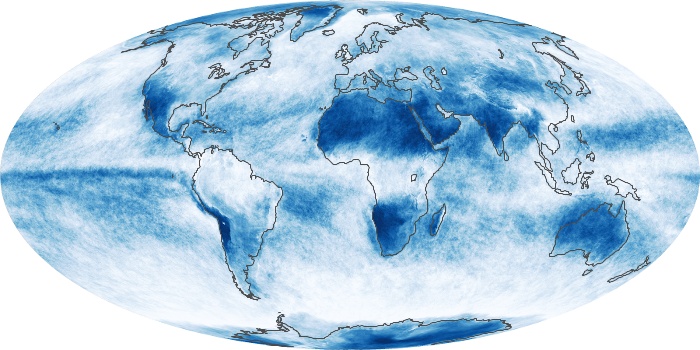
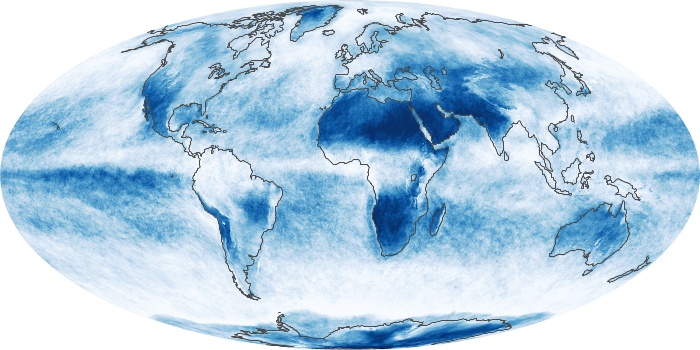
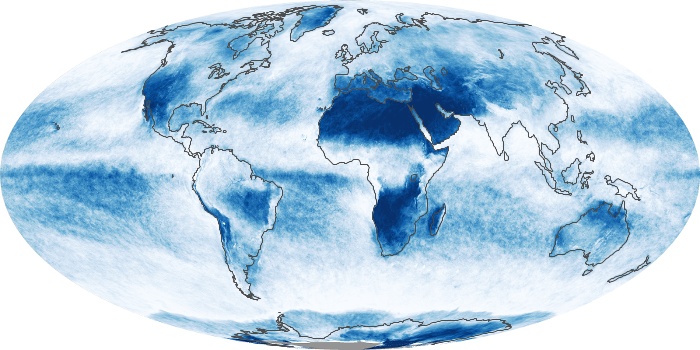
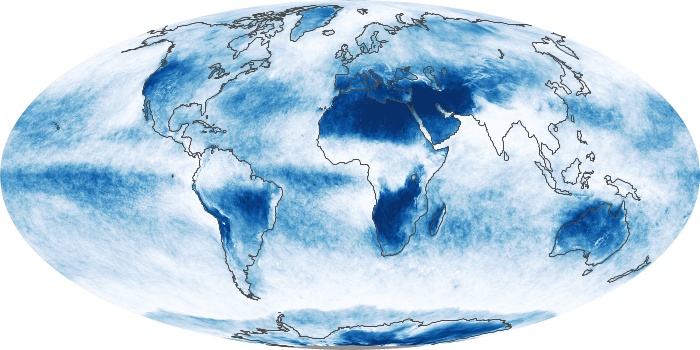
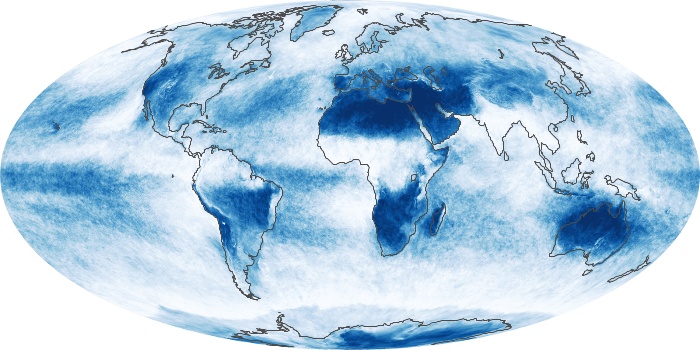
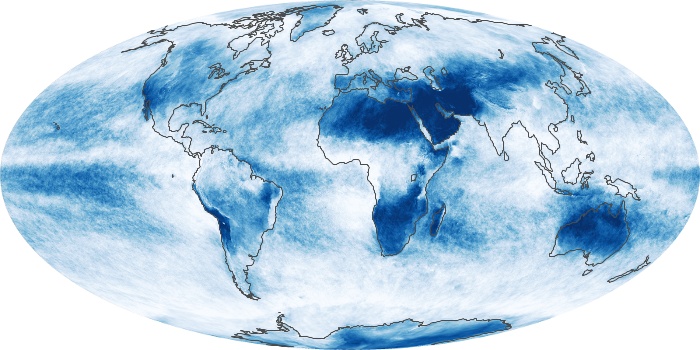
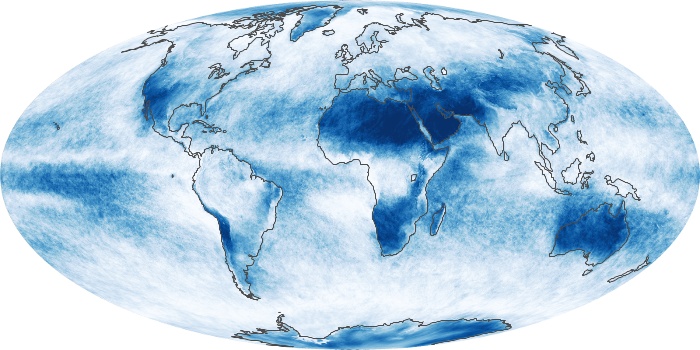
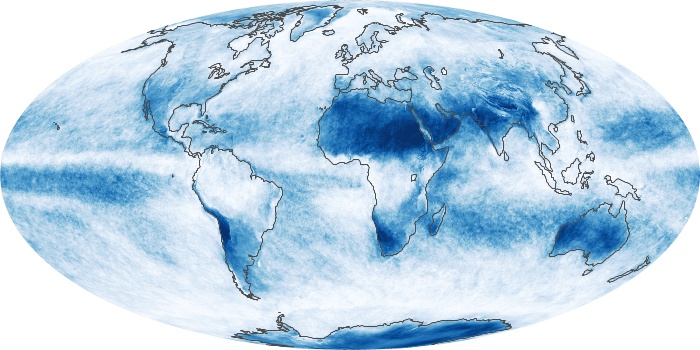
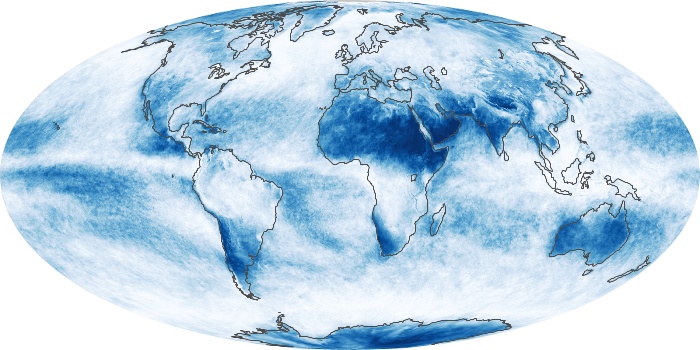
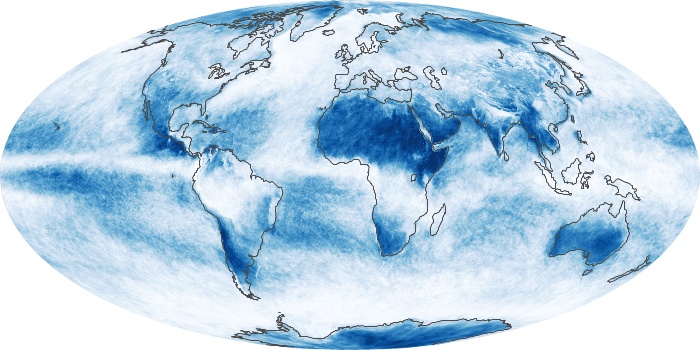
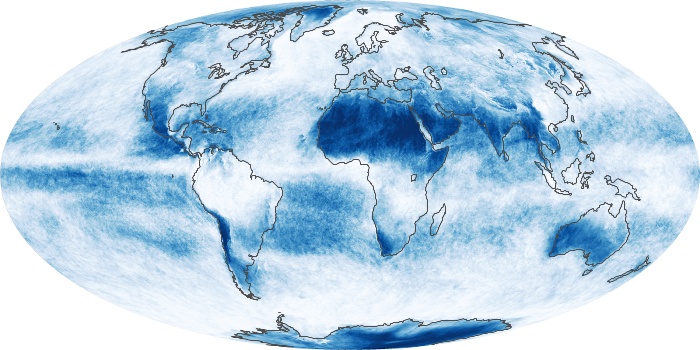
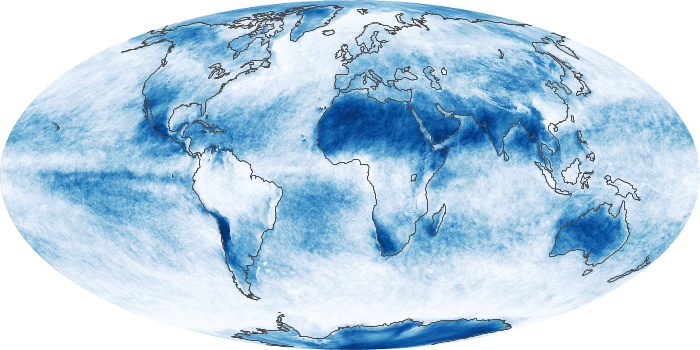
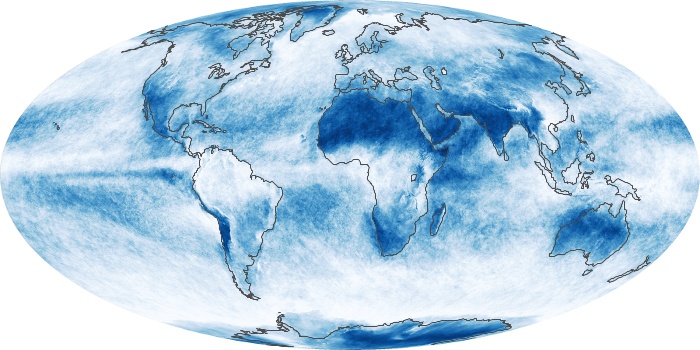
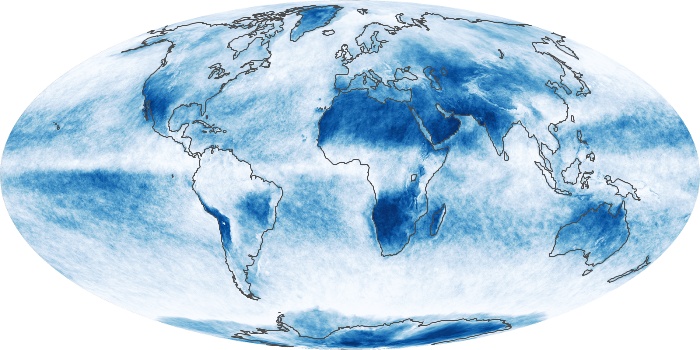
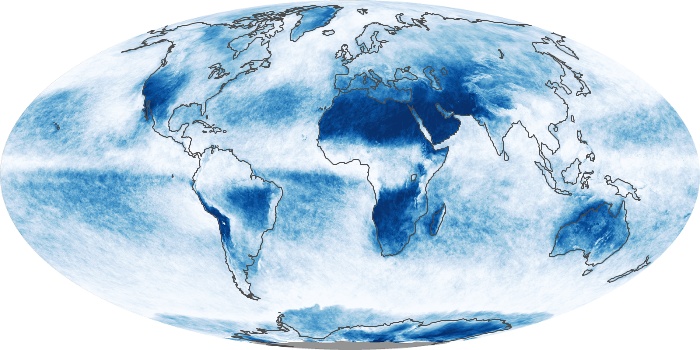
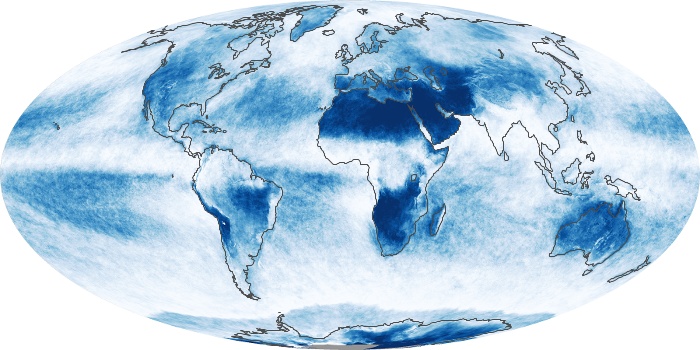
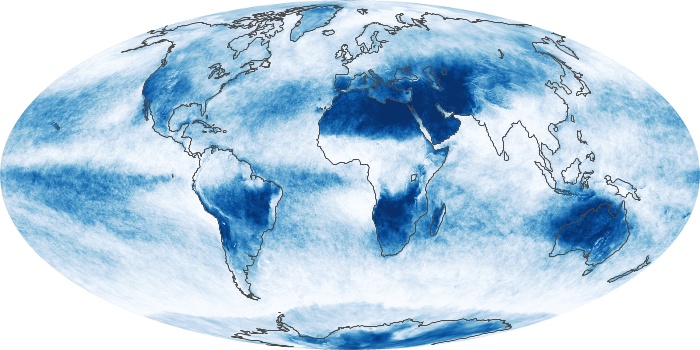
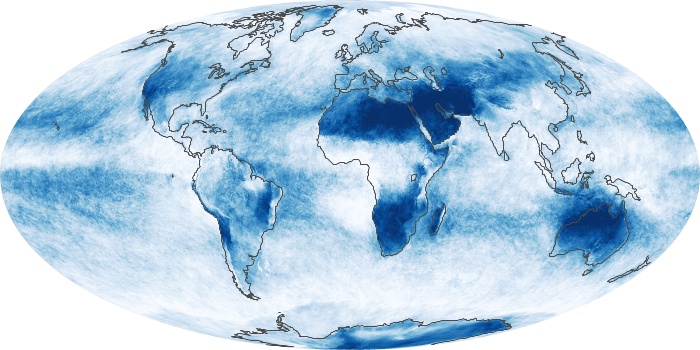
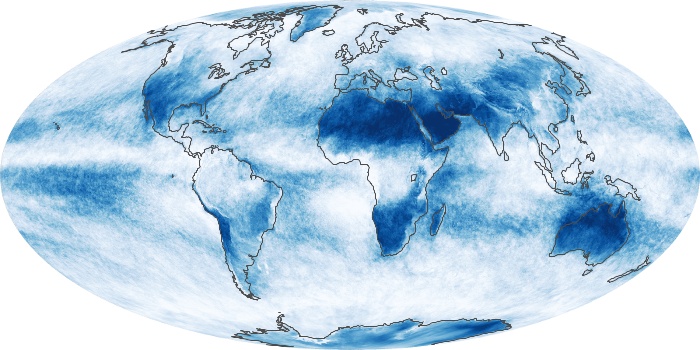
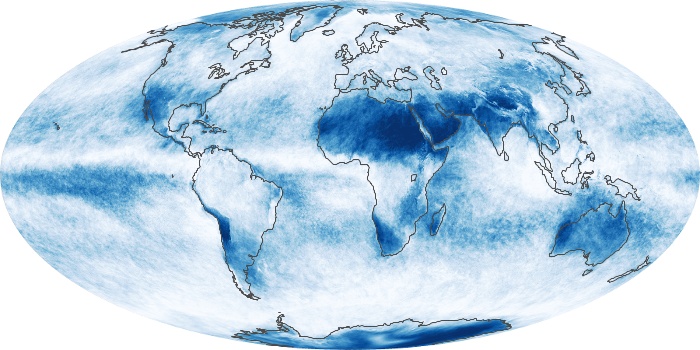

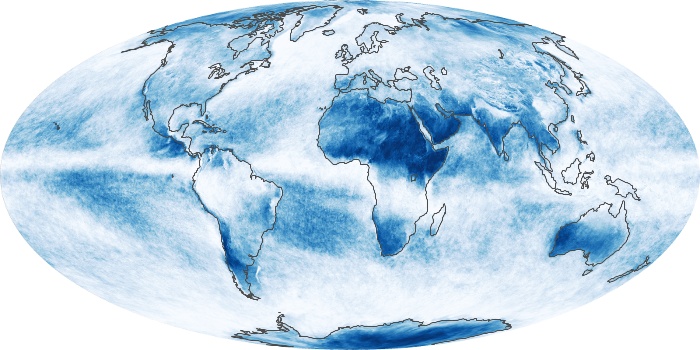
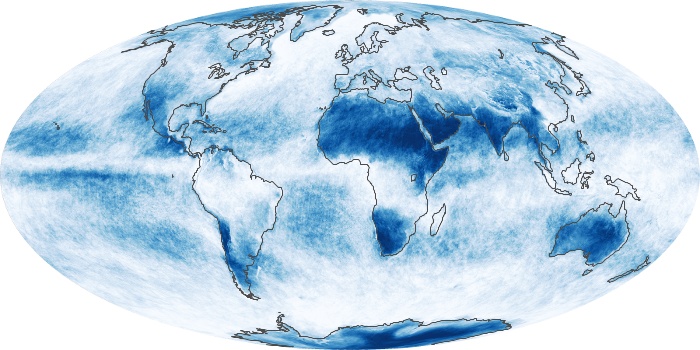
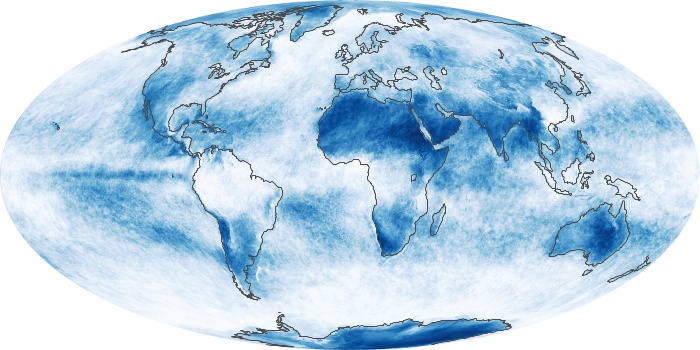
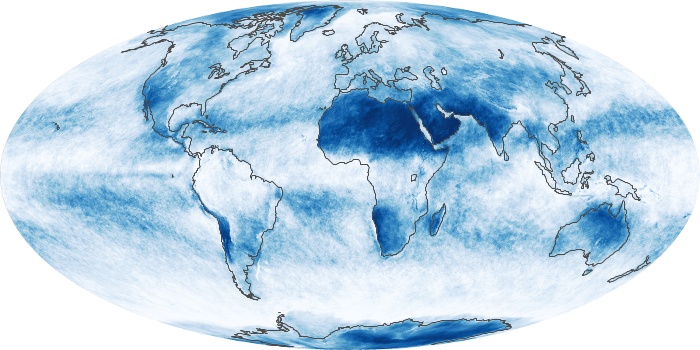
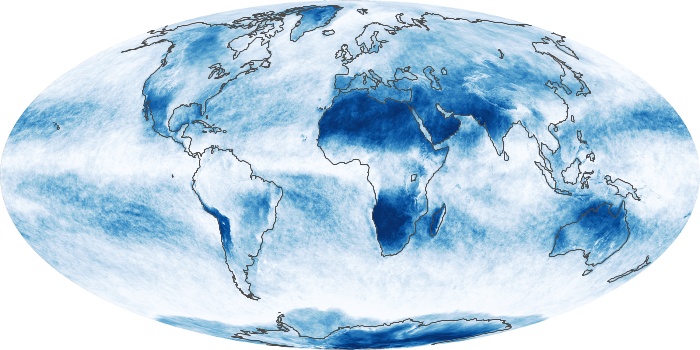
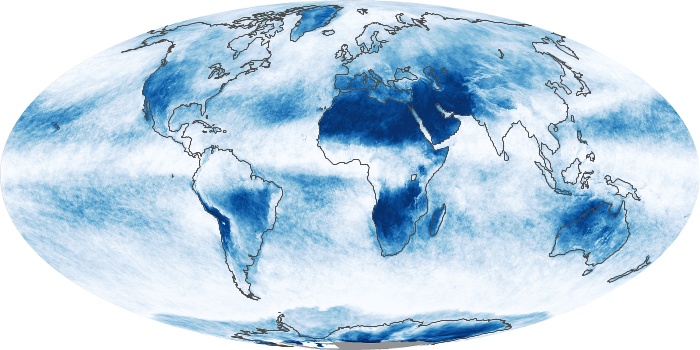
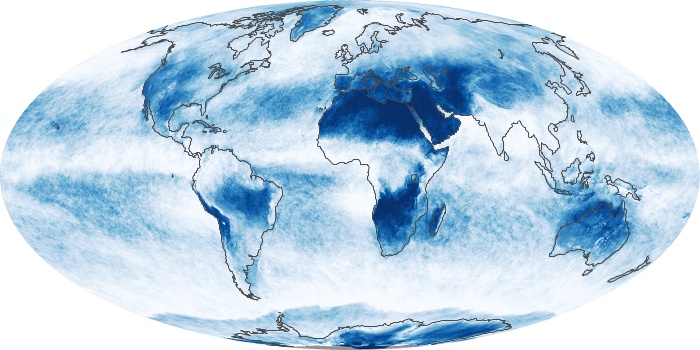
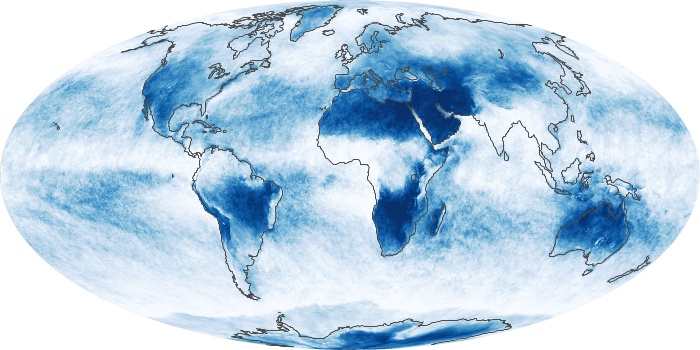
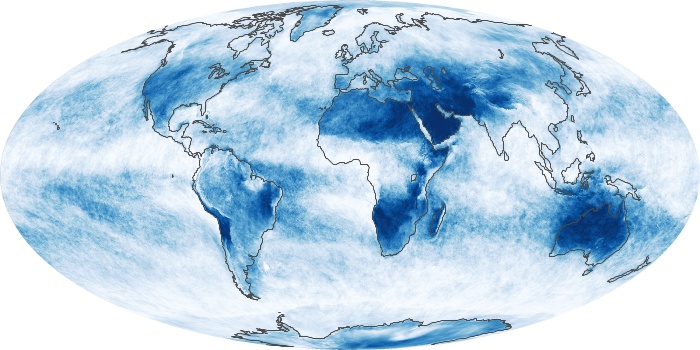
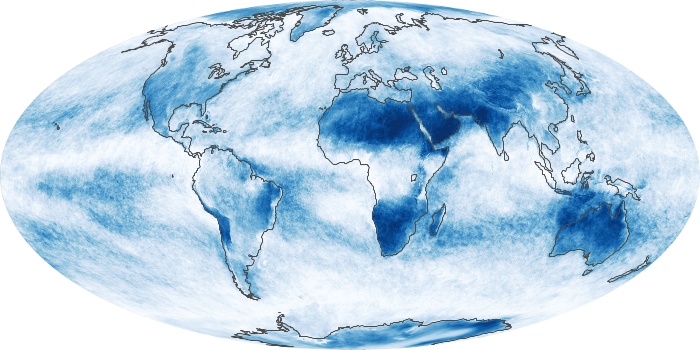
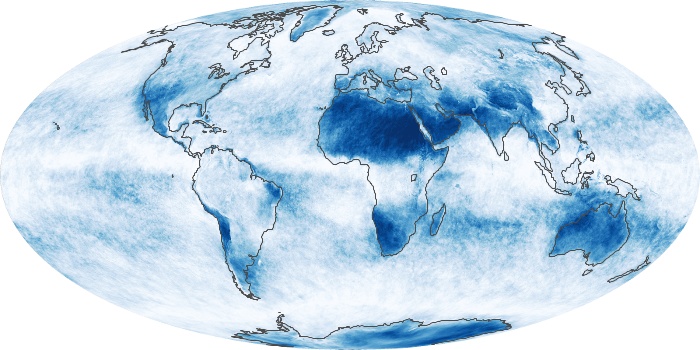
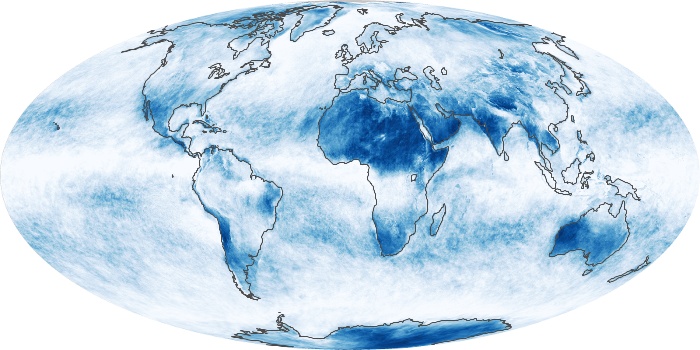
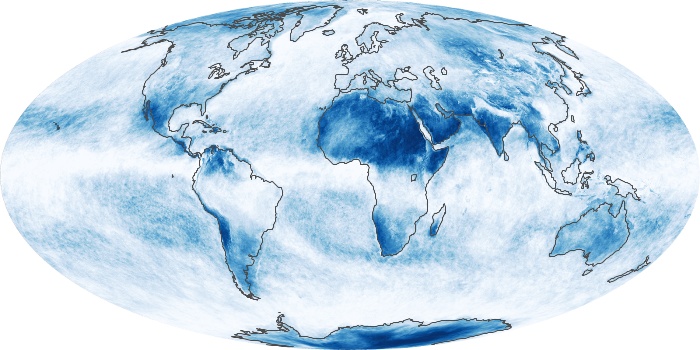
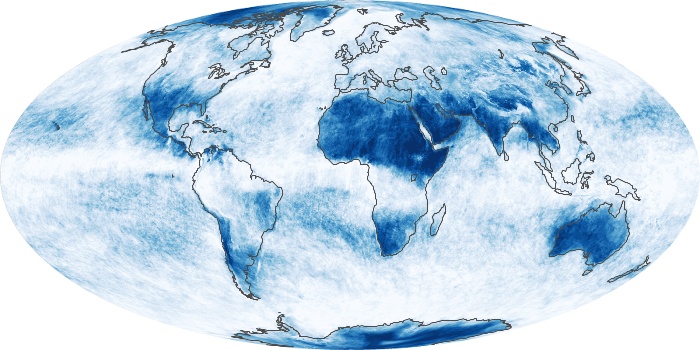
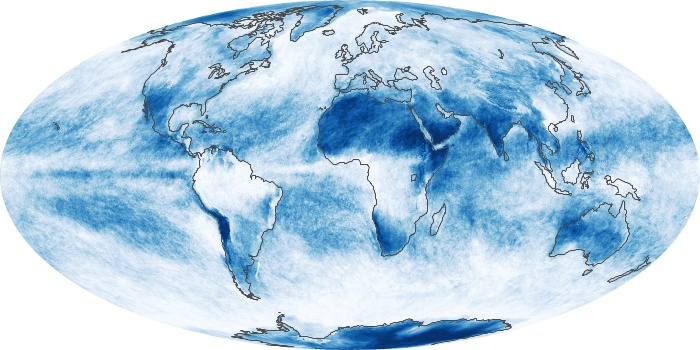
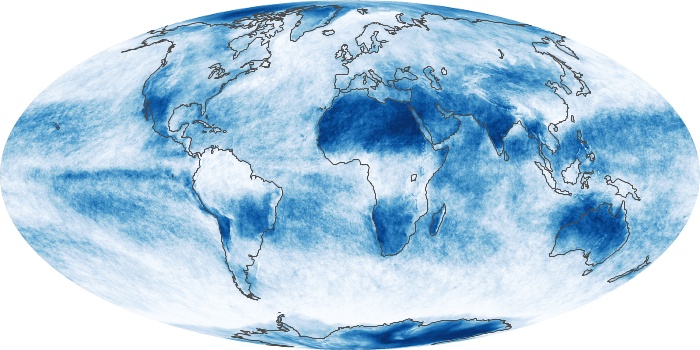
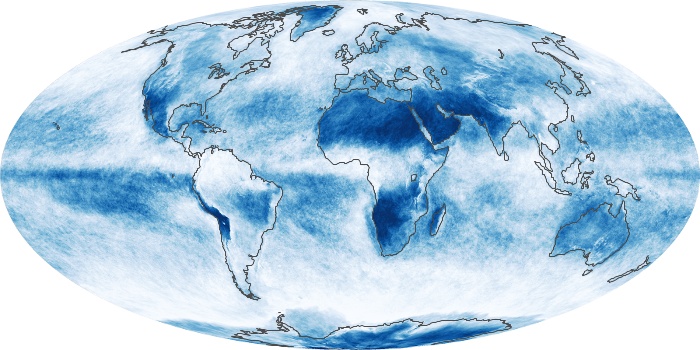
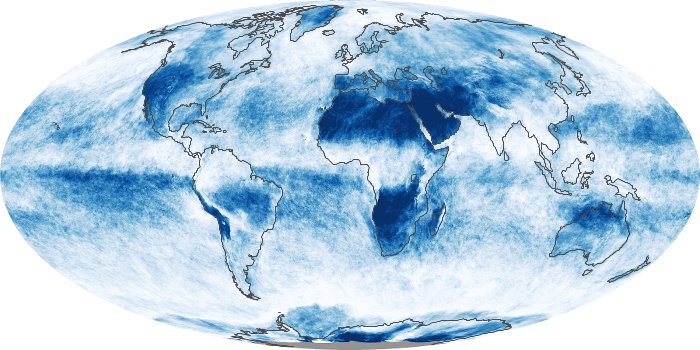
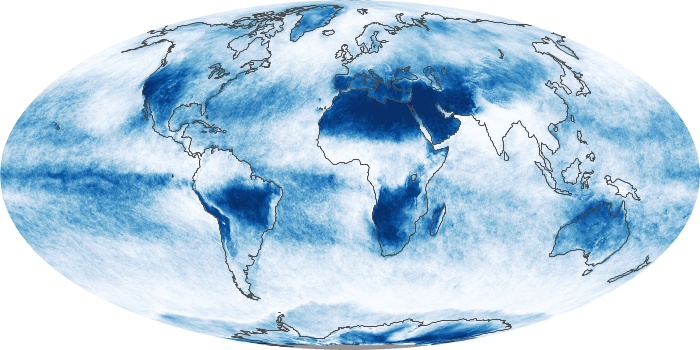
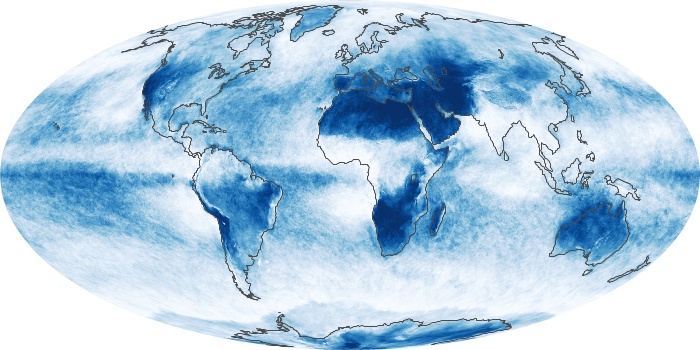
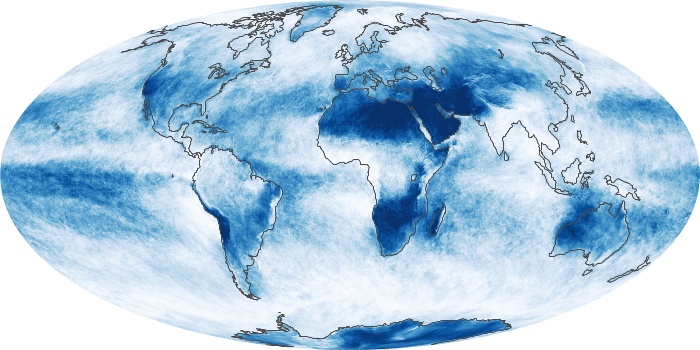
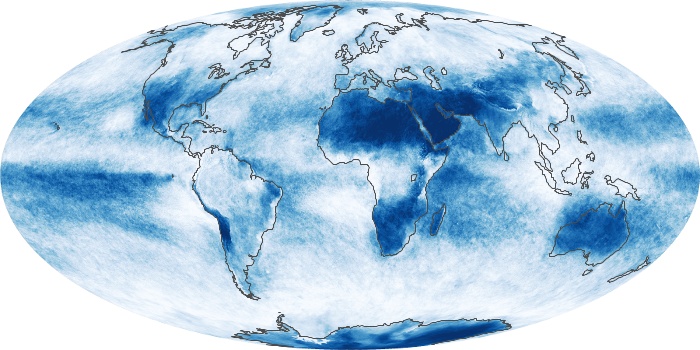
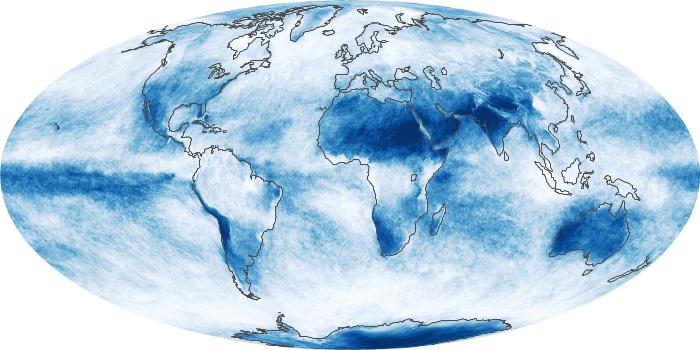
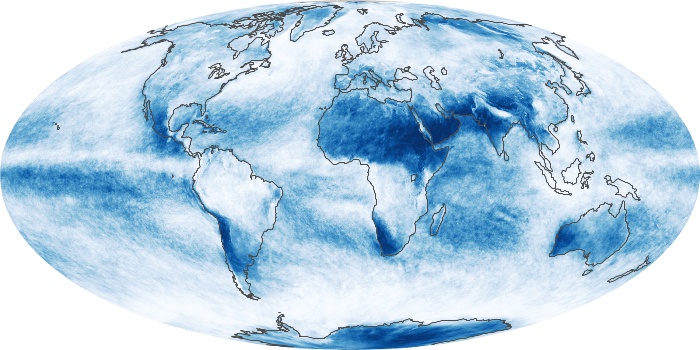
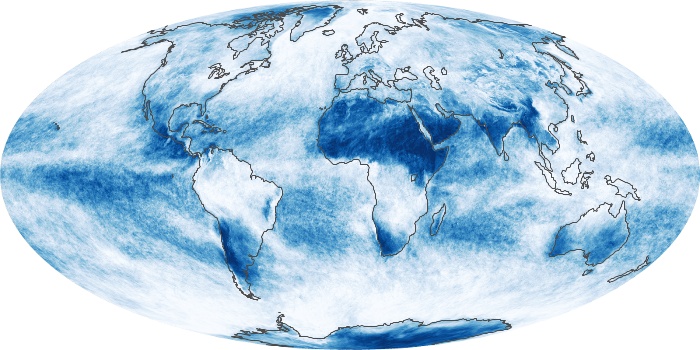
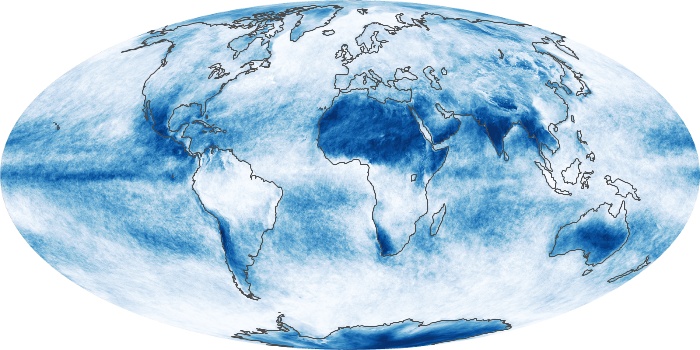
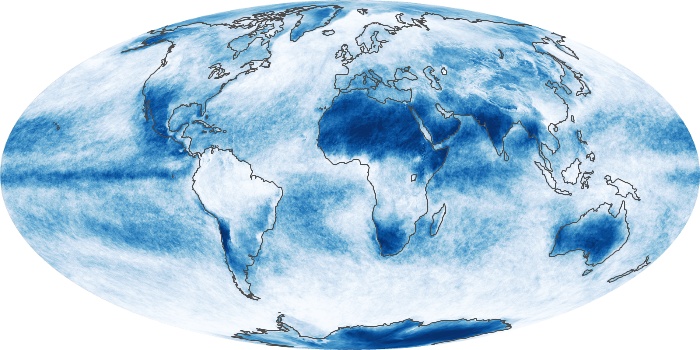
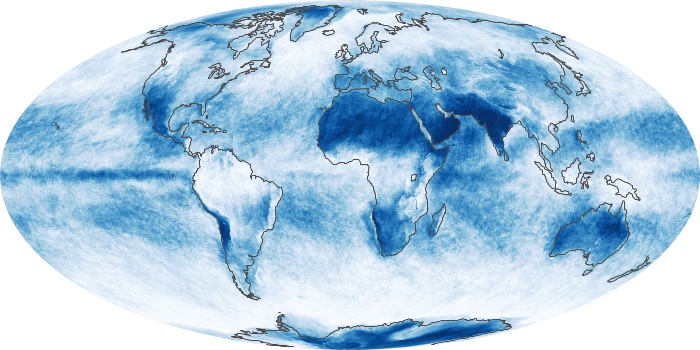
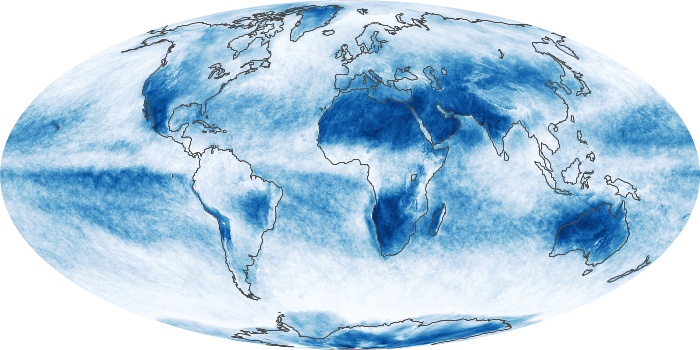
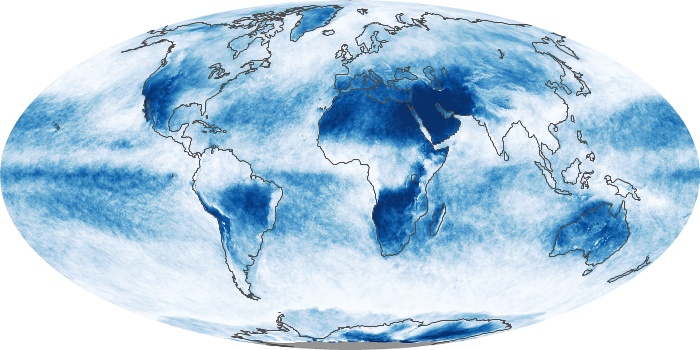
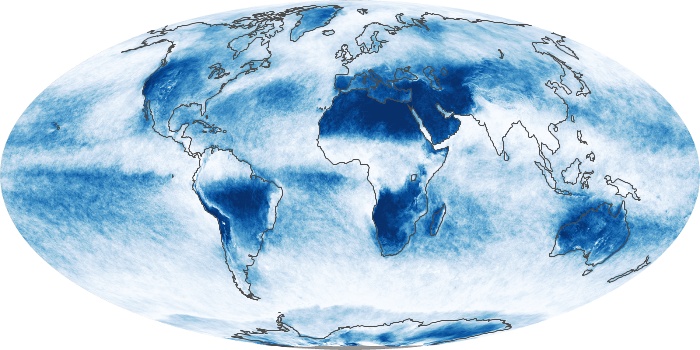
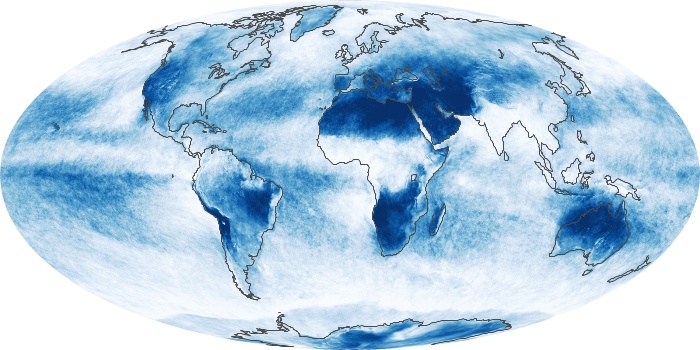
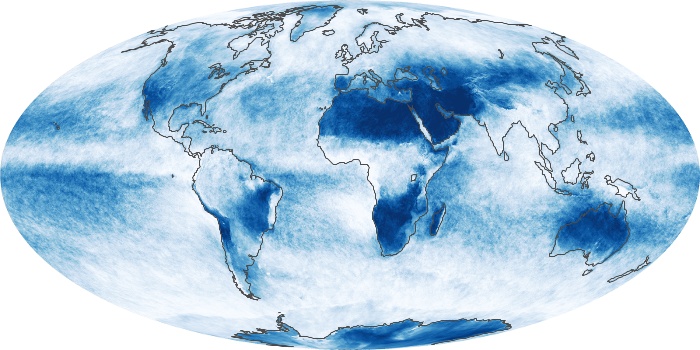
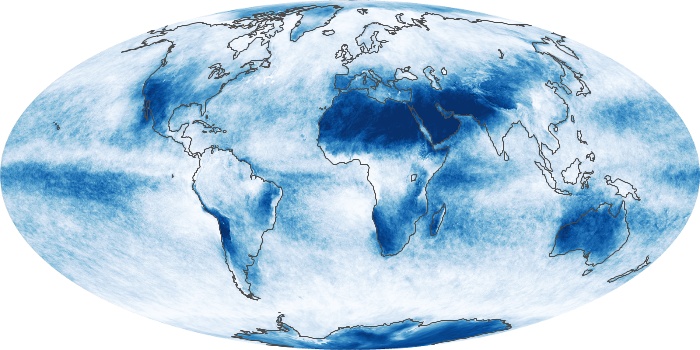
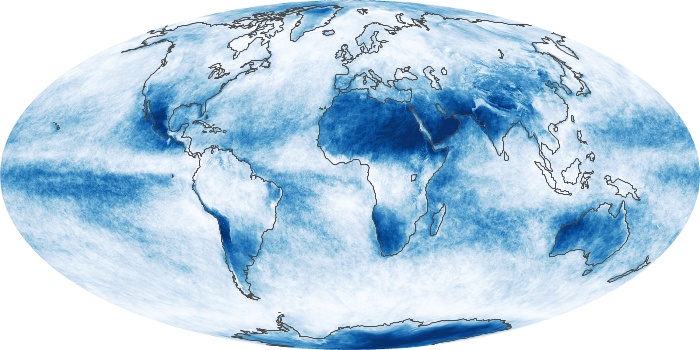
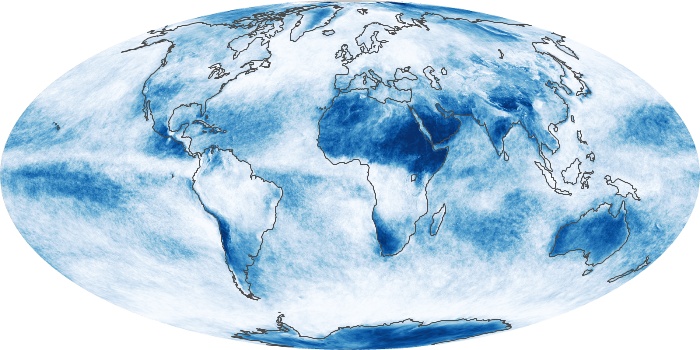
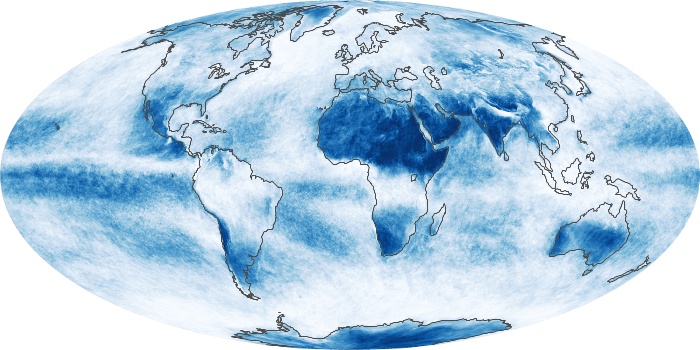
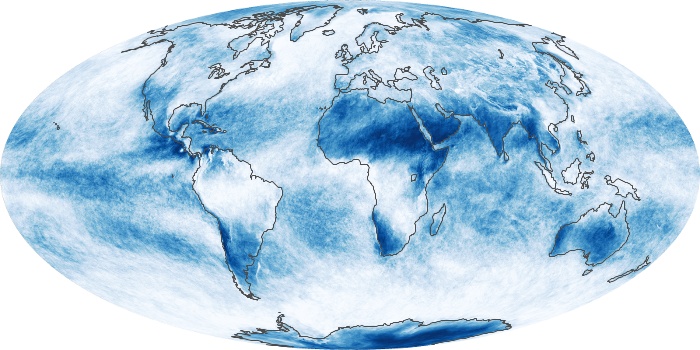
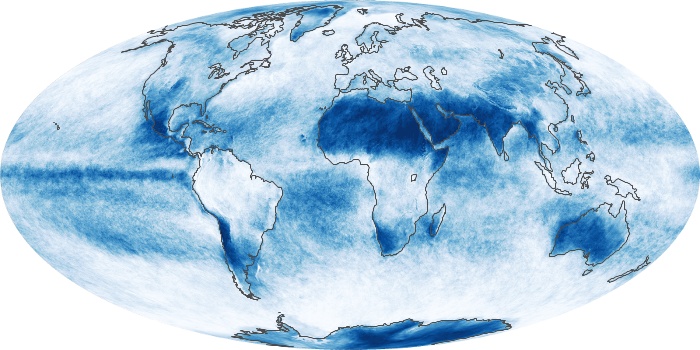
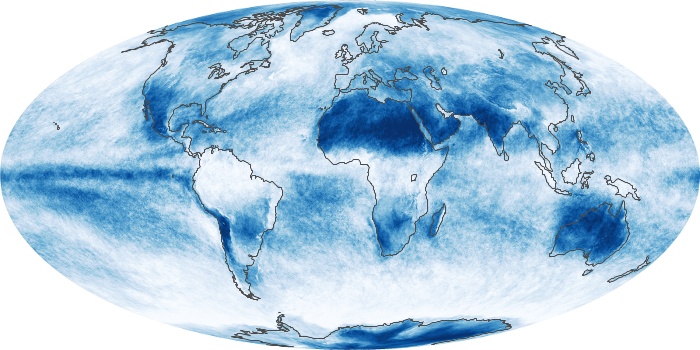
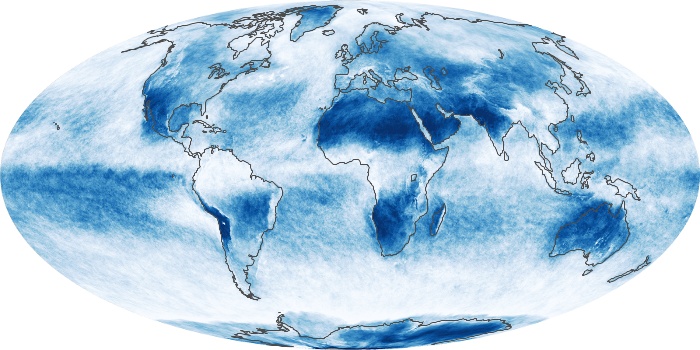
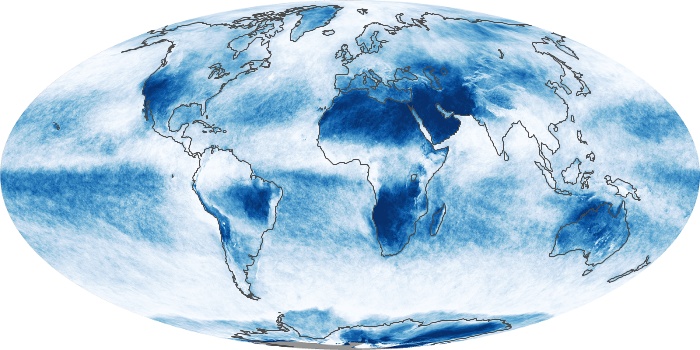
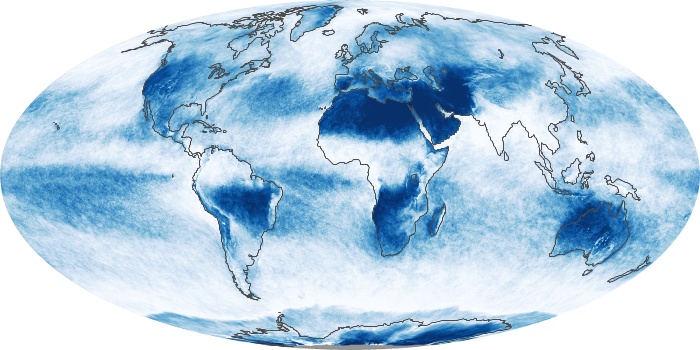
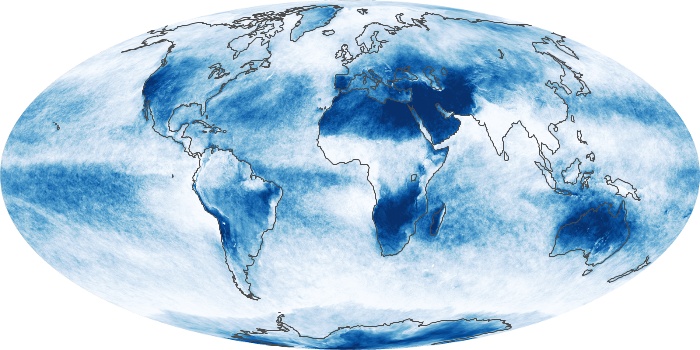
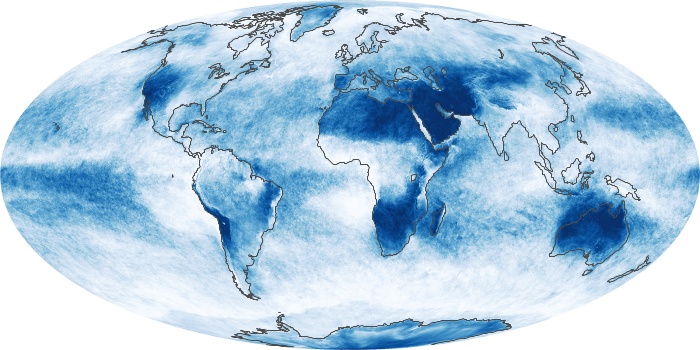

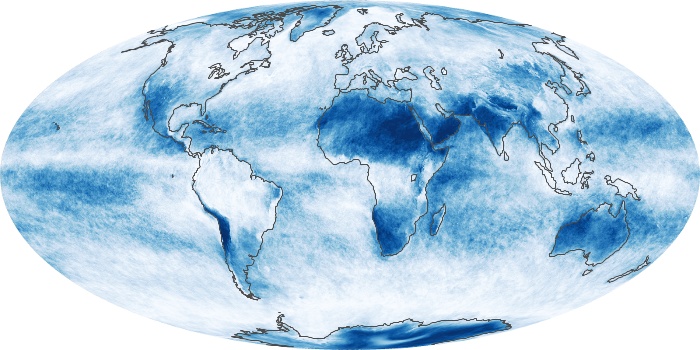
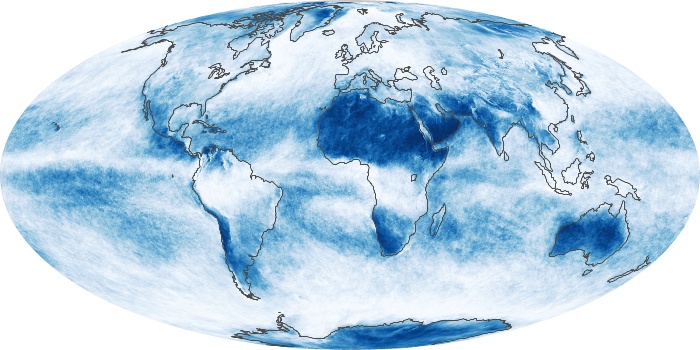
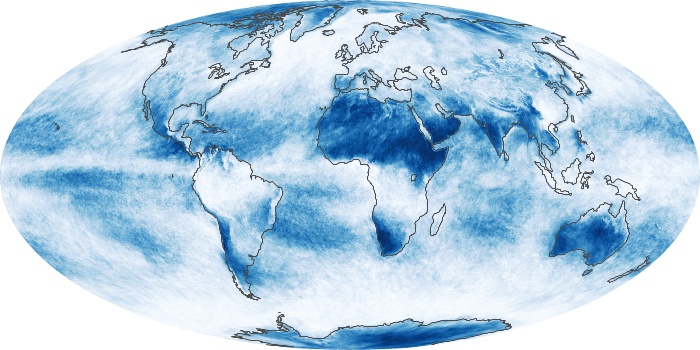
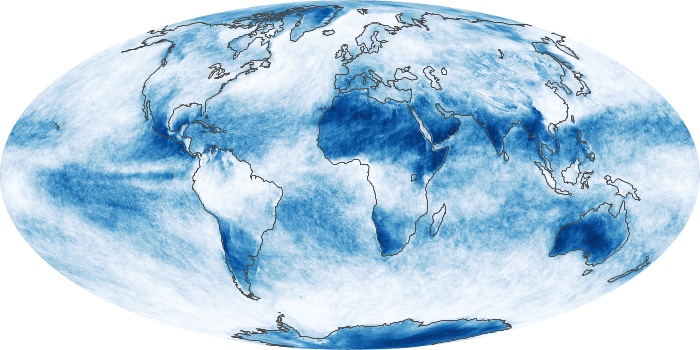
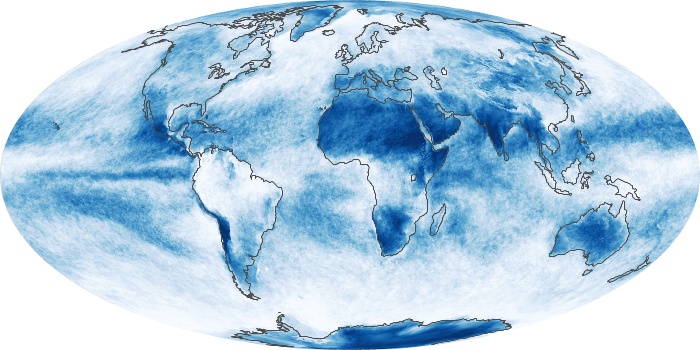
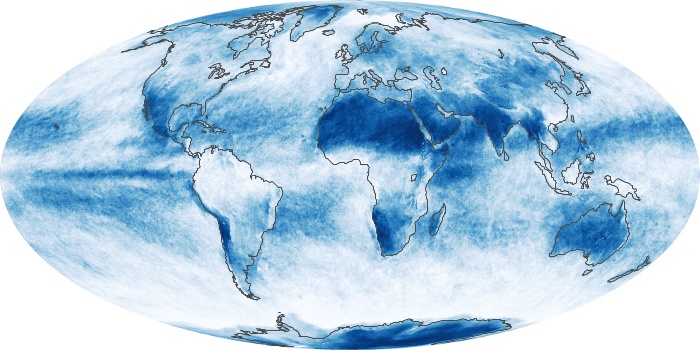
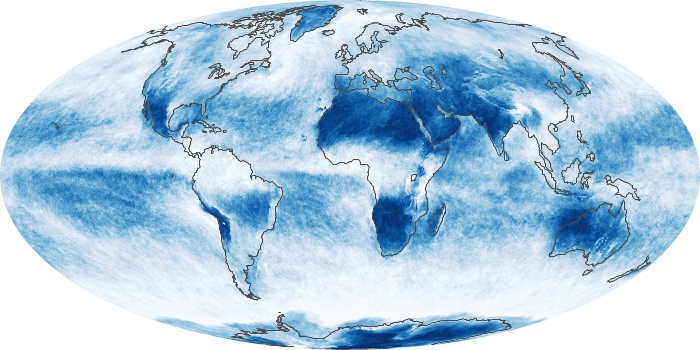
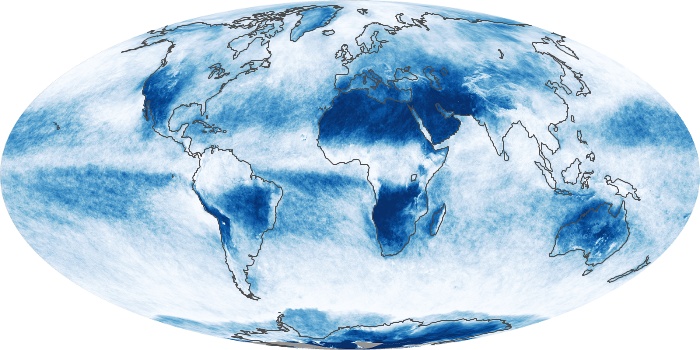
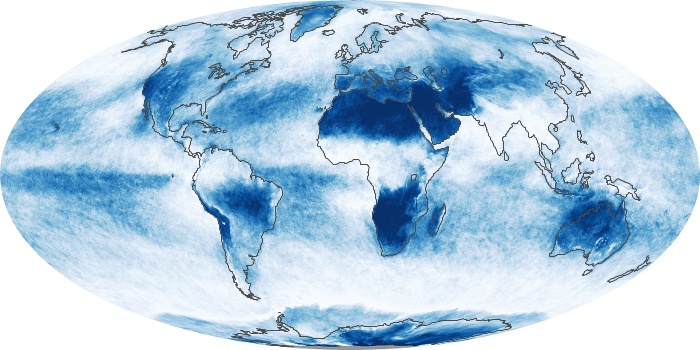
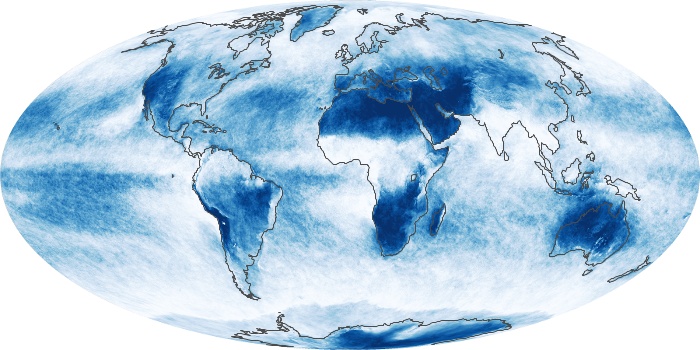
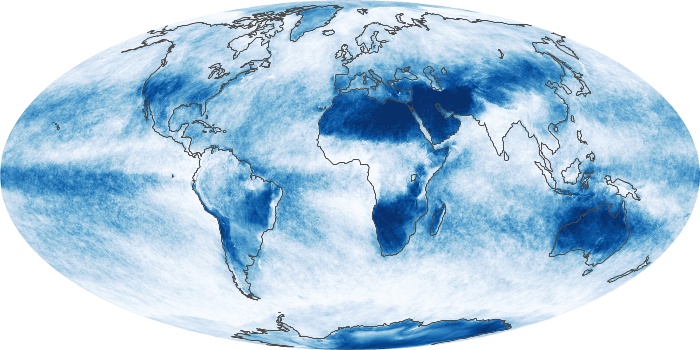

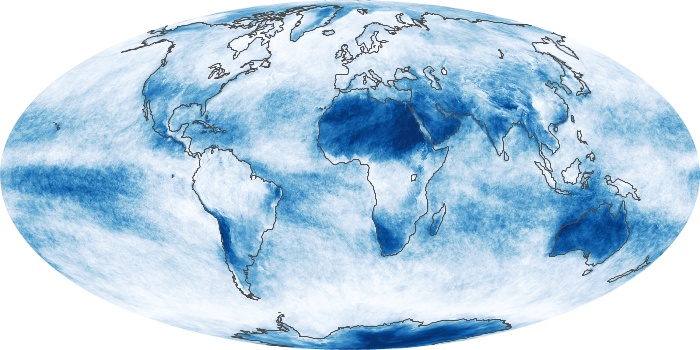
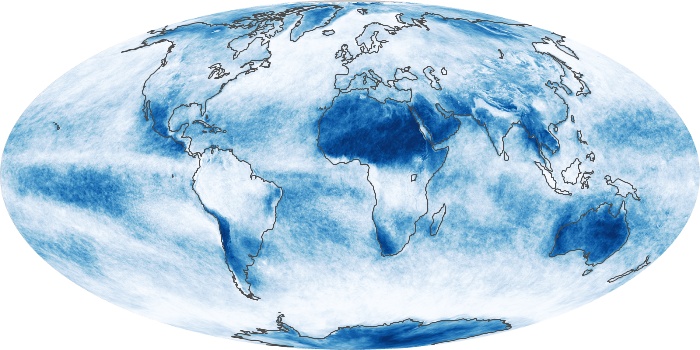
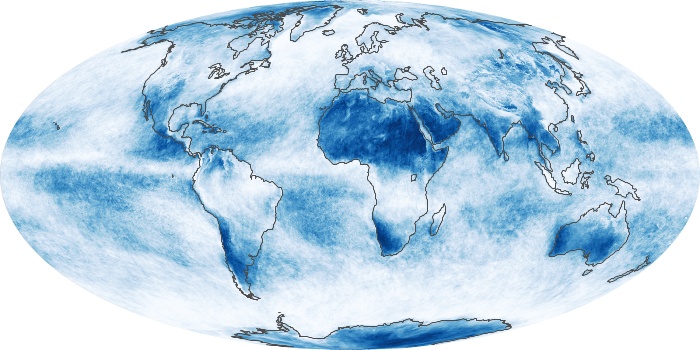
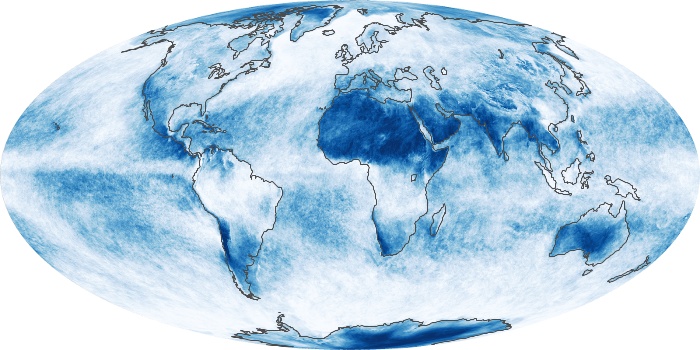
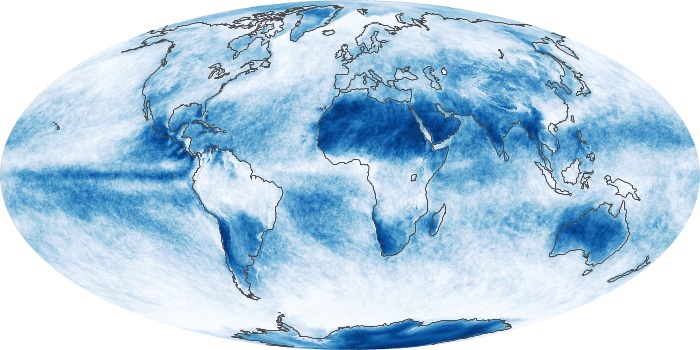
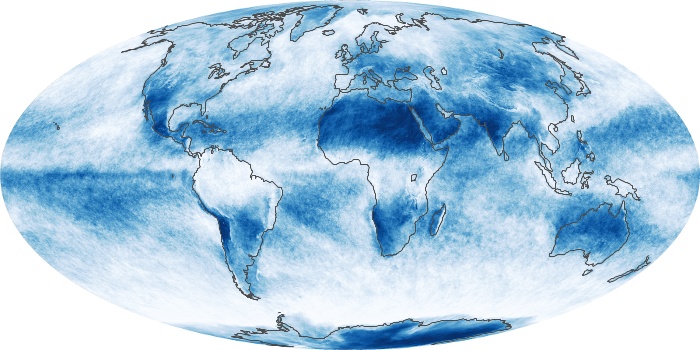
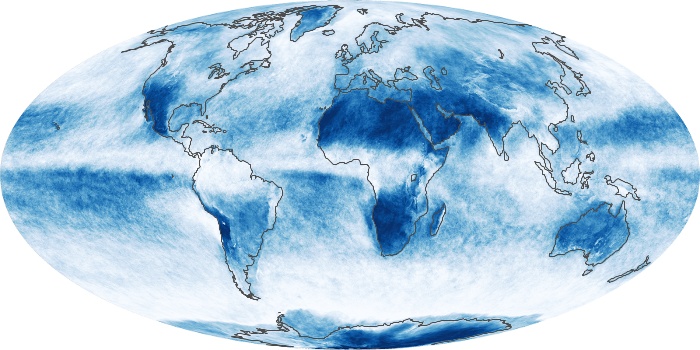
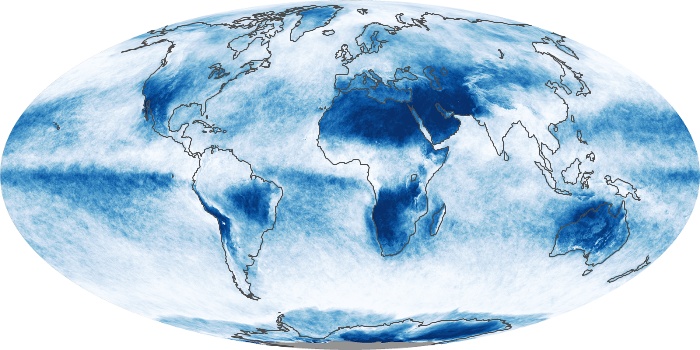
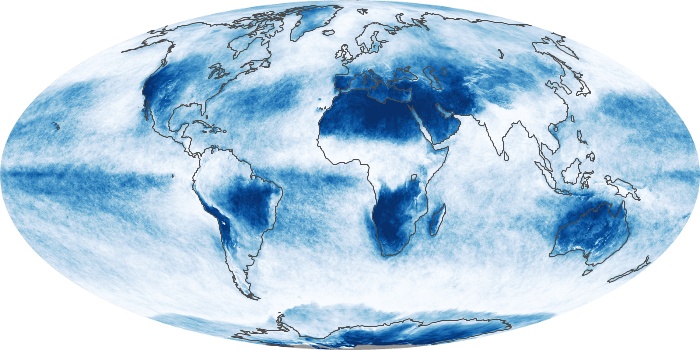
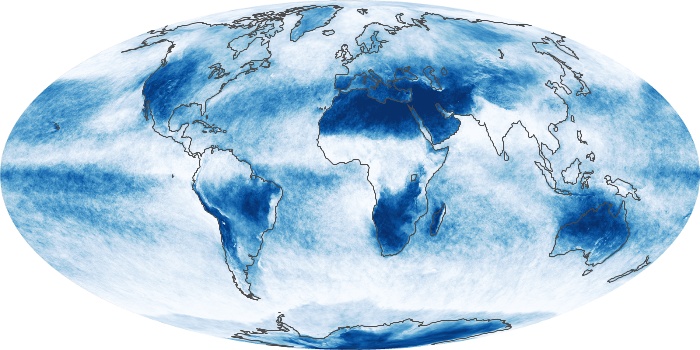
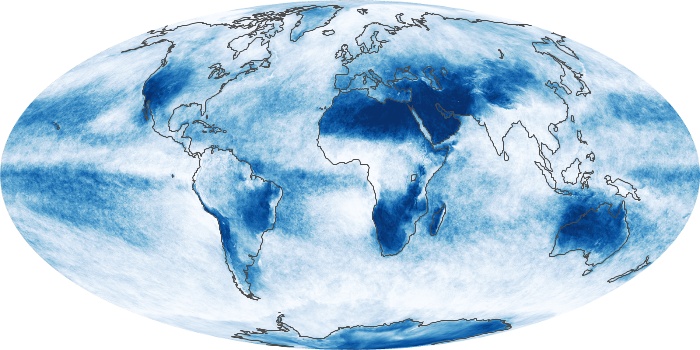
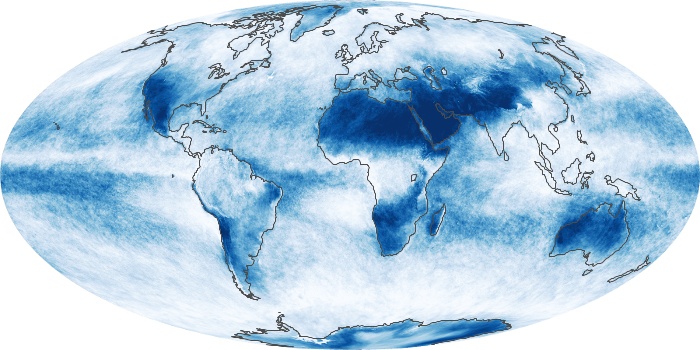
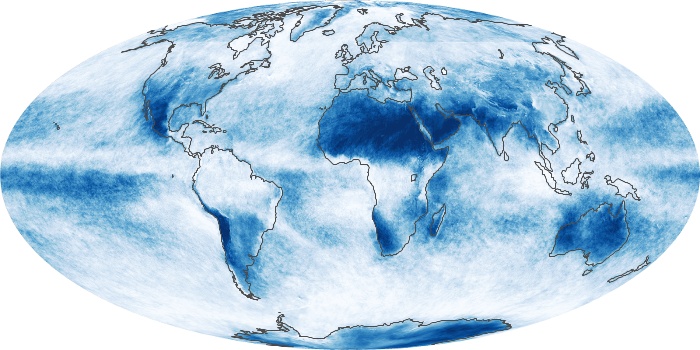
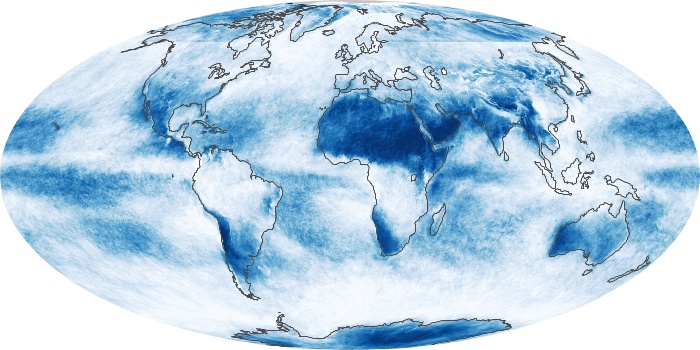
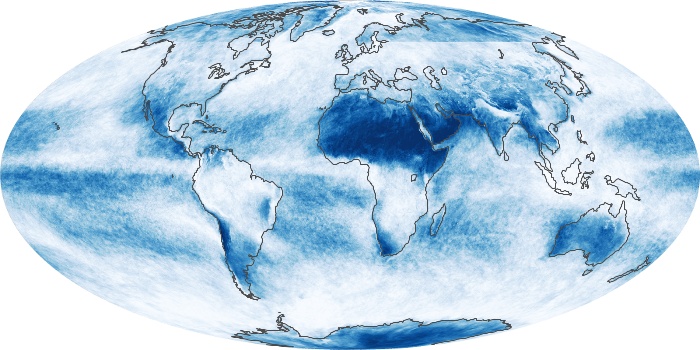
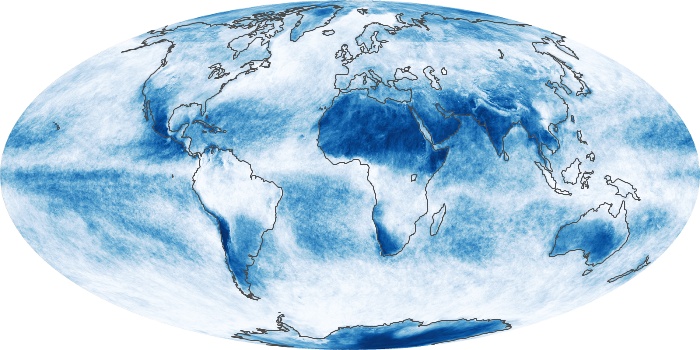
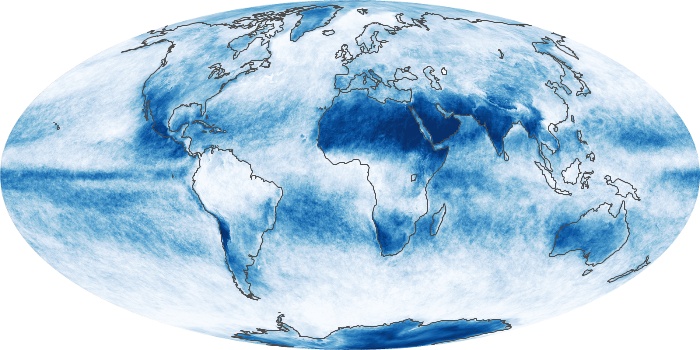
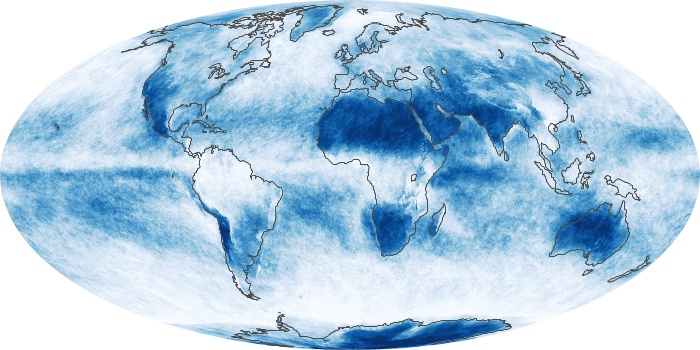
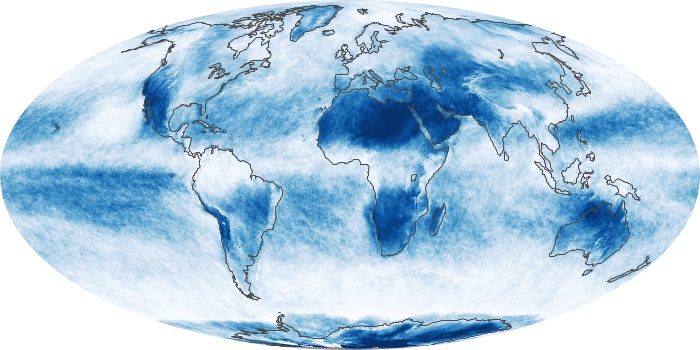
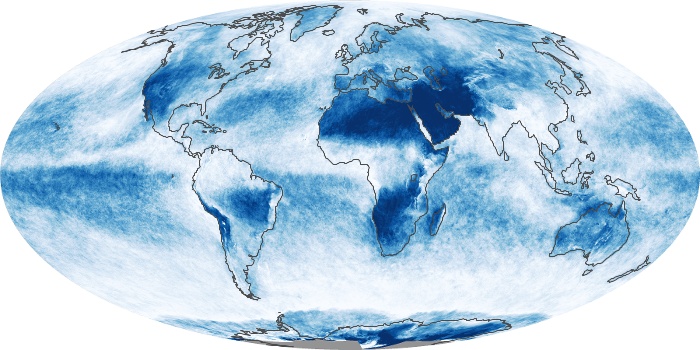
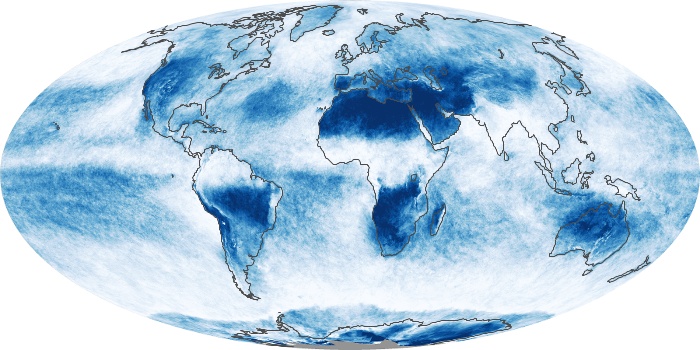
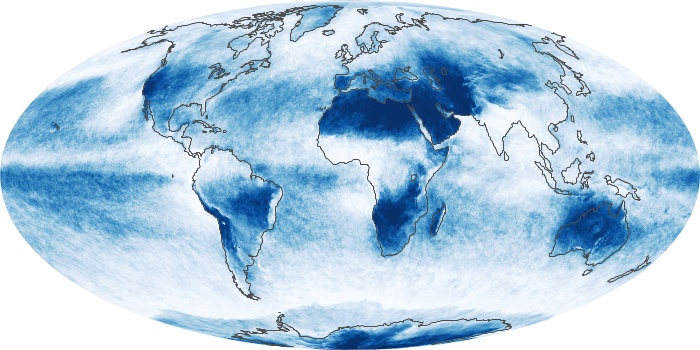
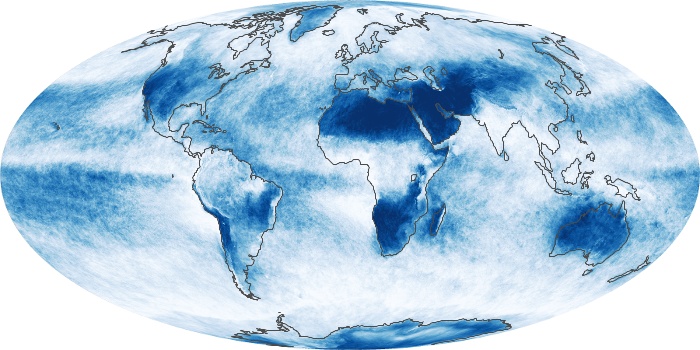
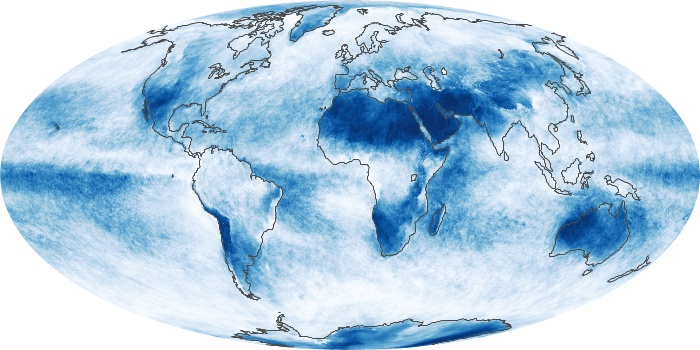
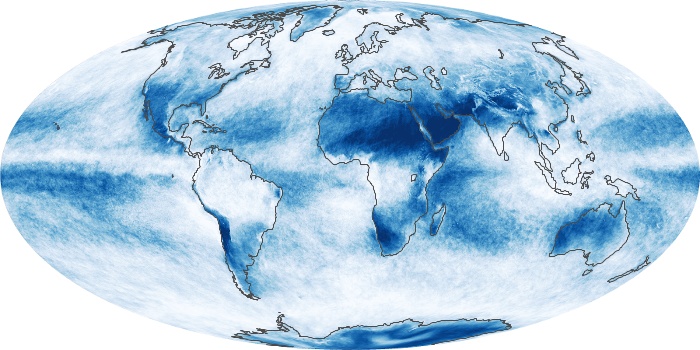
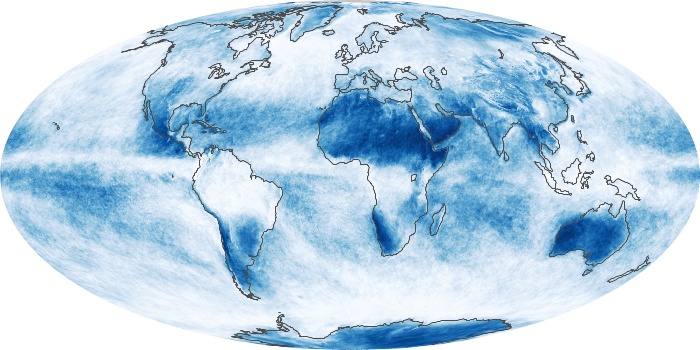
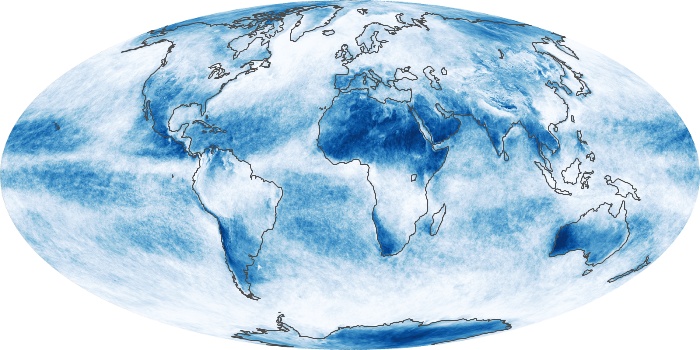
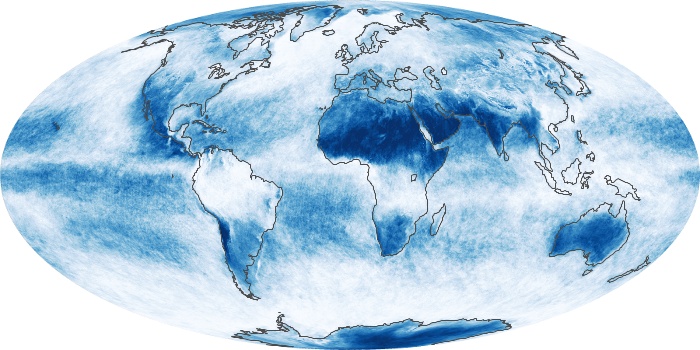
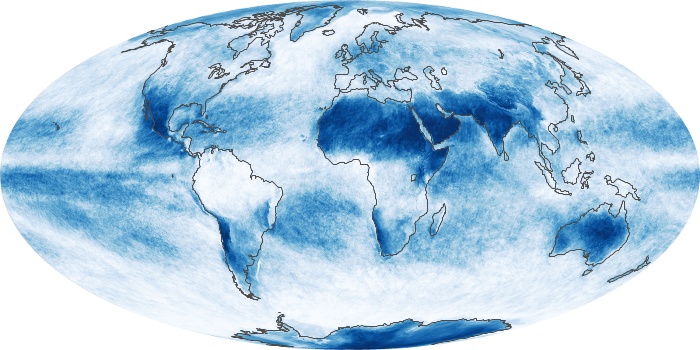
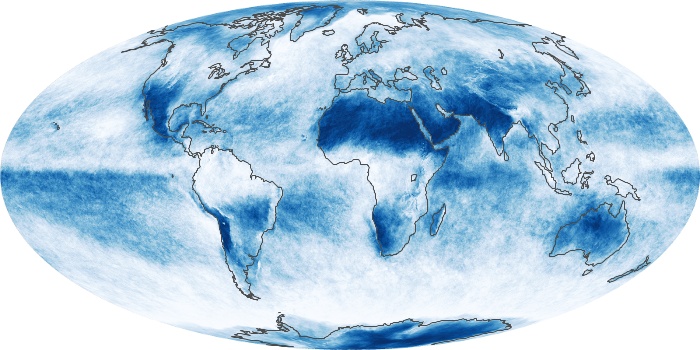
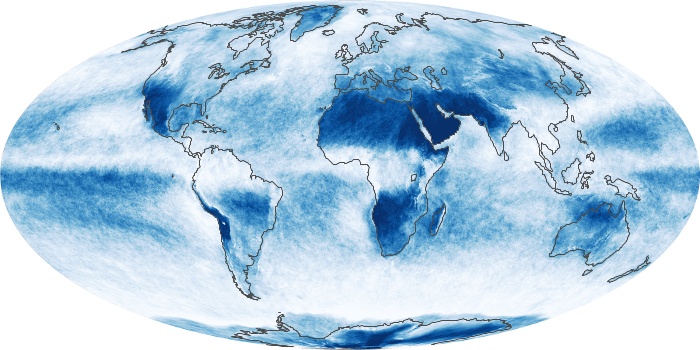
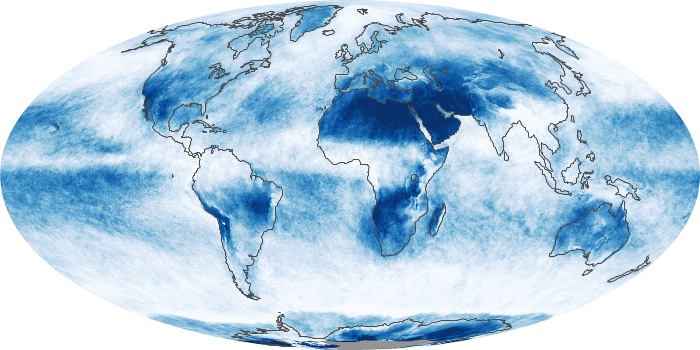
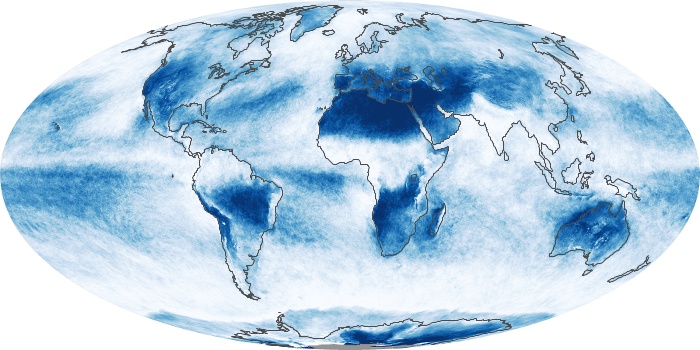
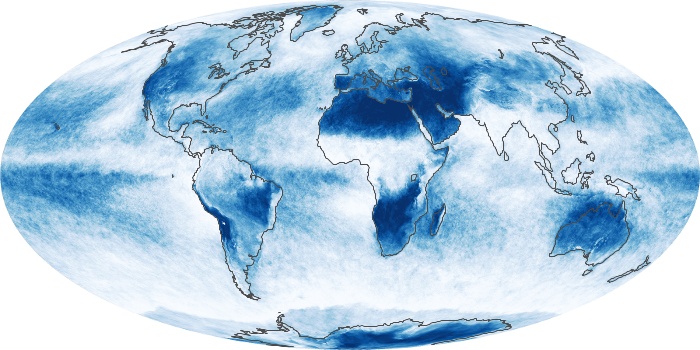
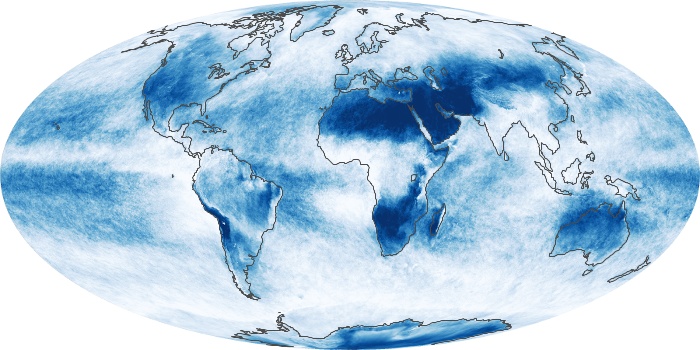
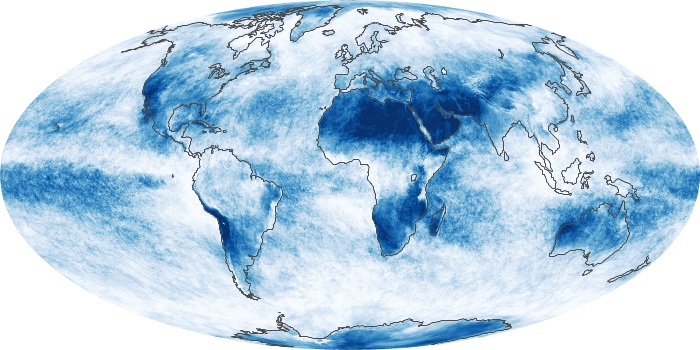
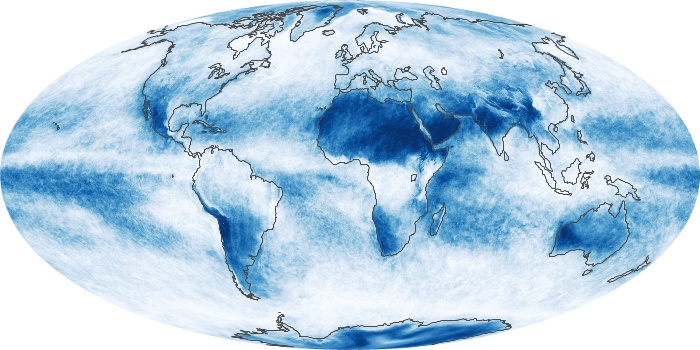
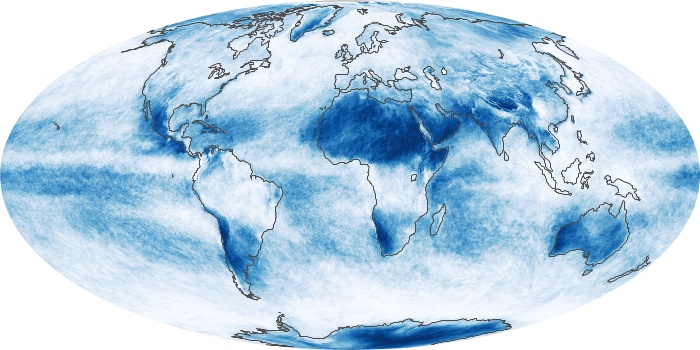
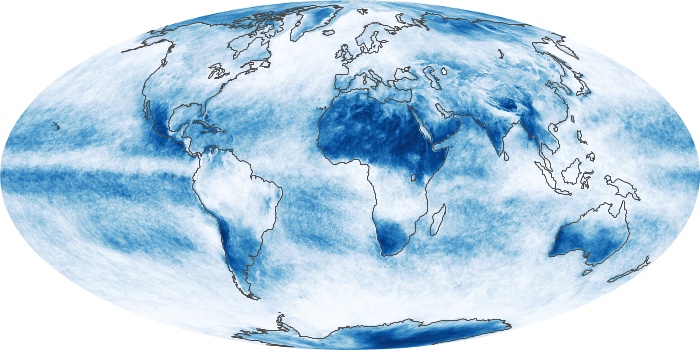
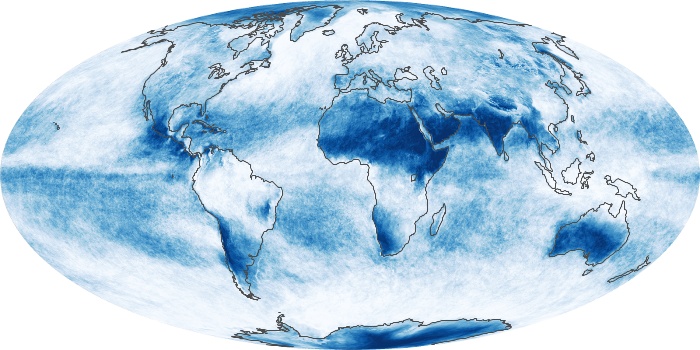
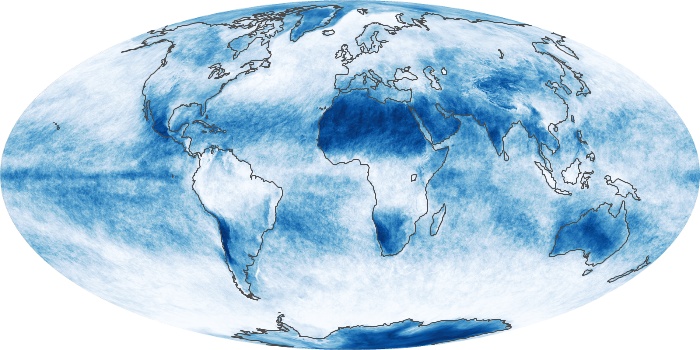

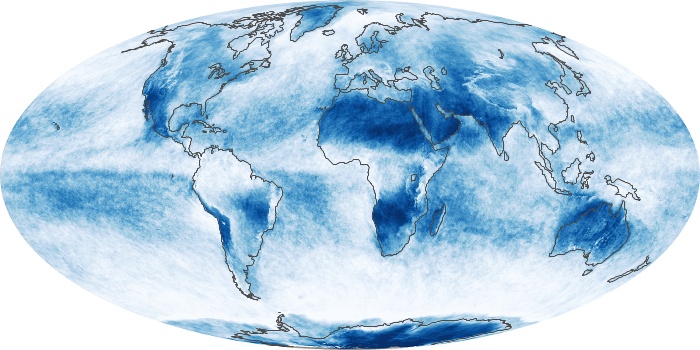

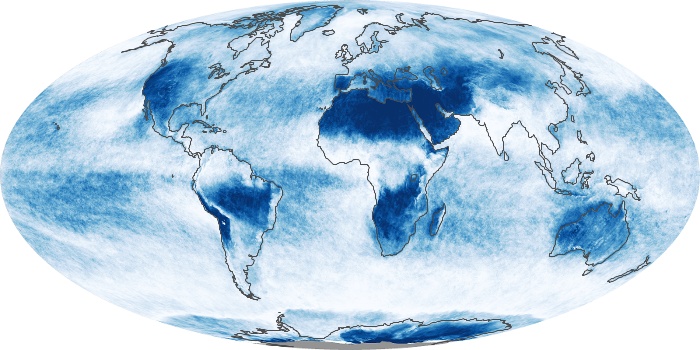
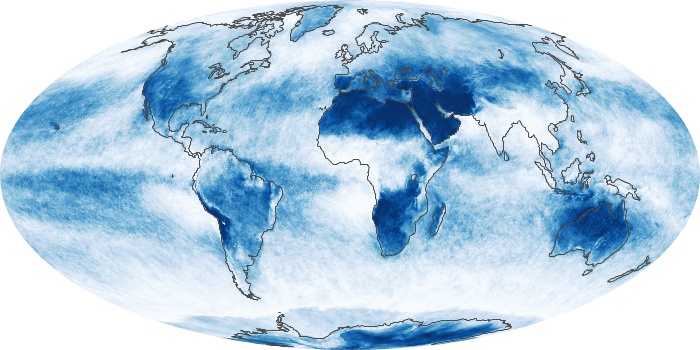
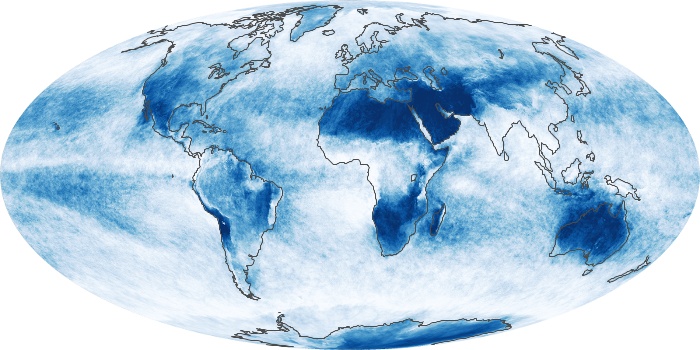
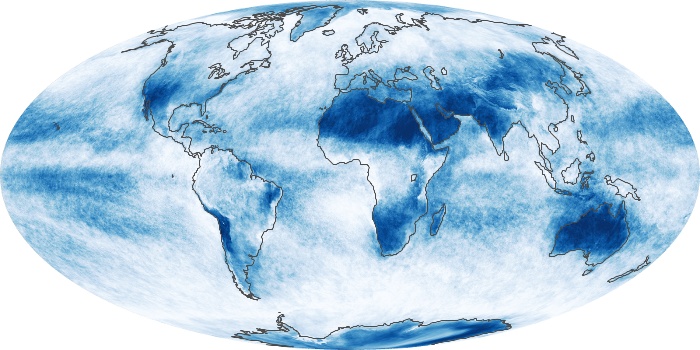
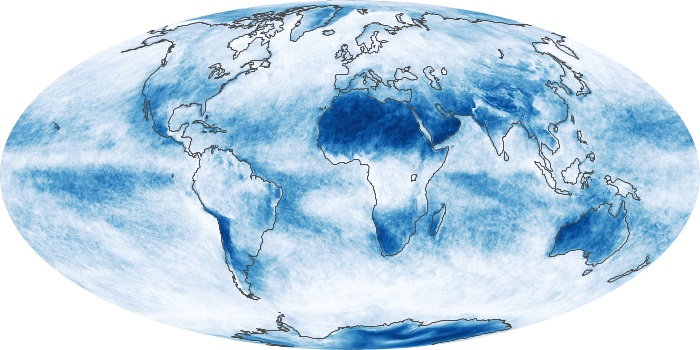
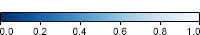


The cloud maps show what fraction of an area was cloudy on average for the month. The measurements were collected by the MODIS sensors on NASA's Terra and Aqua satellites. Colors range from blue (no clouds) to white (totally cloudy).
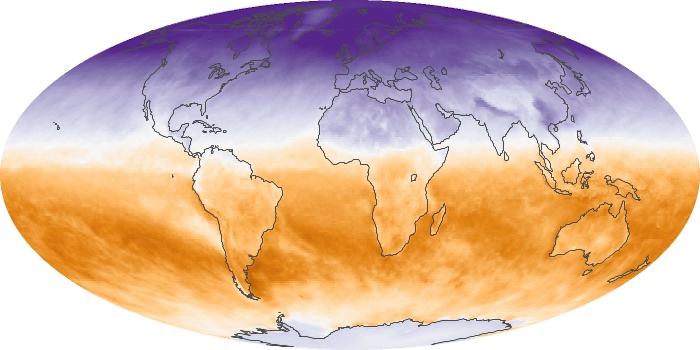
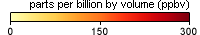
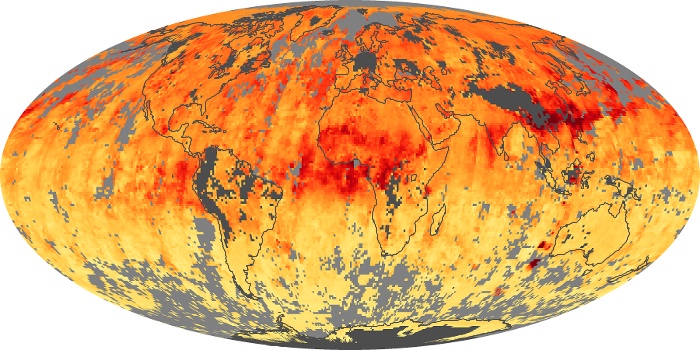
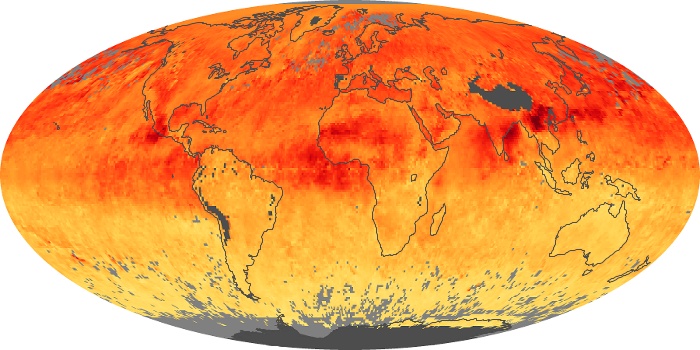
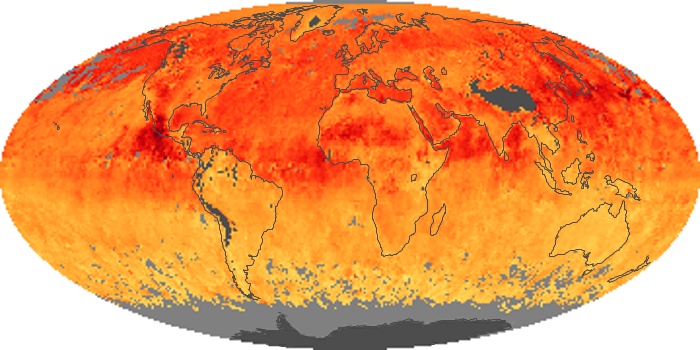
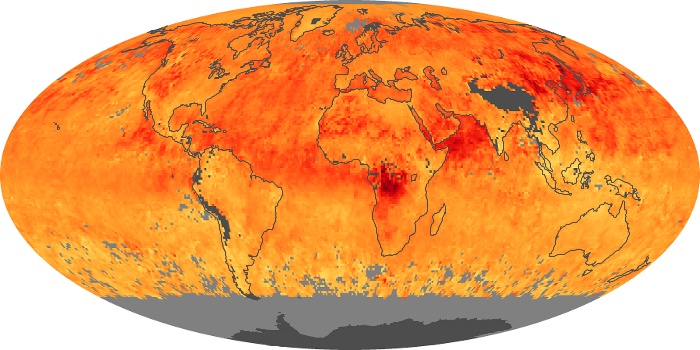
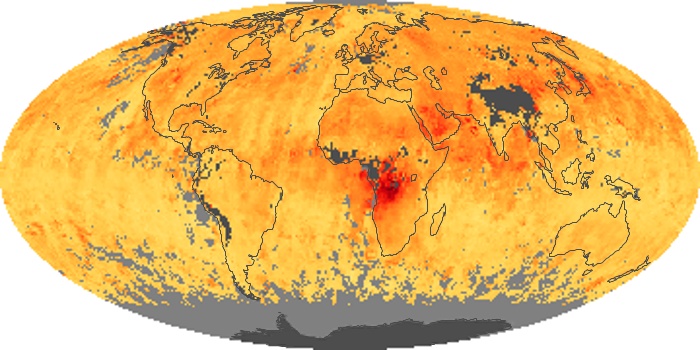
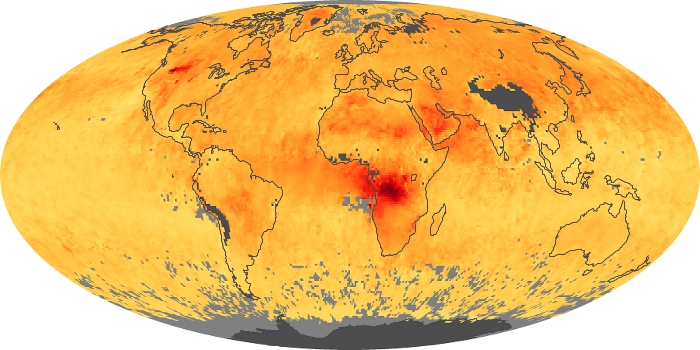
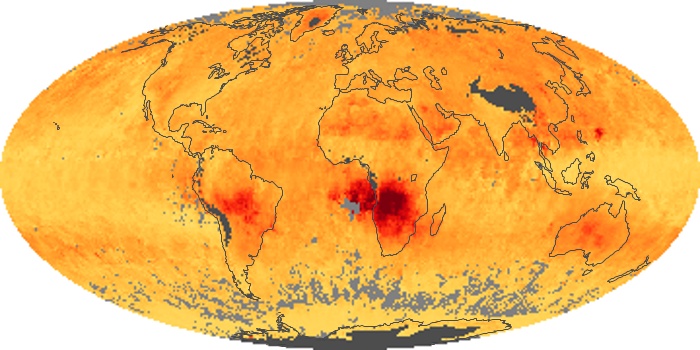
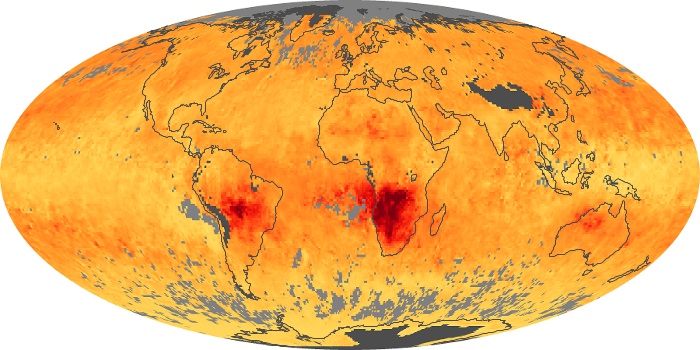
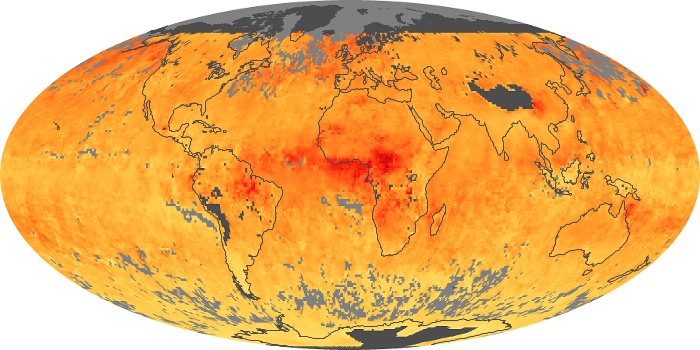
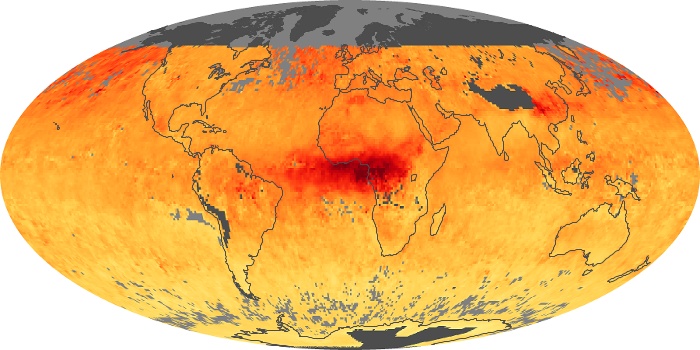
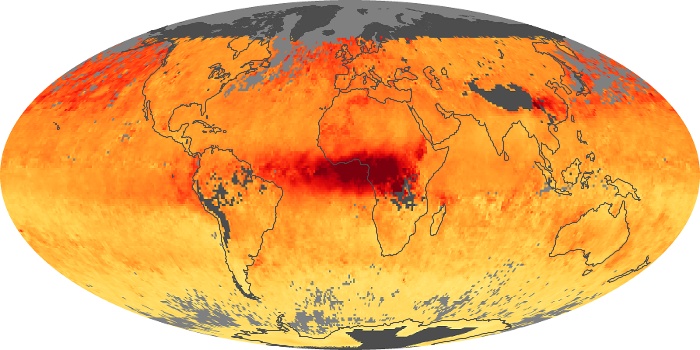
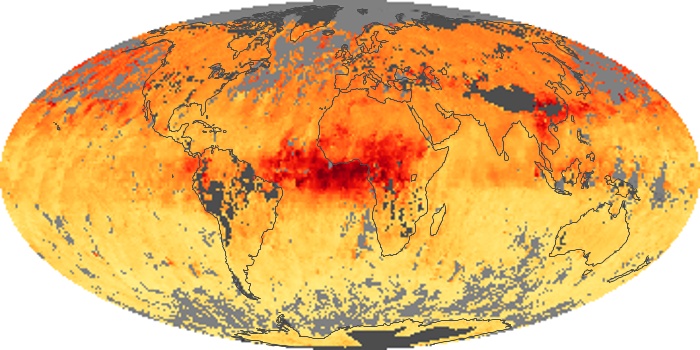
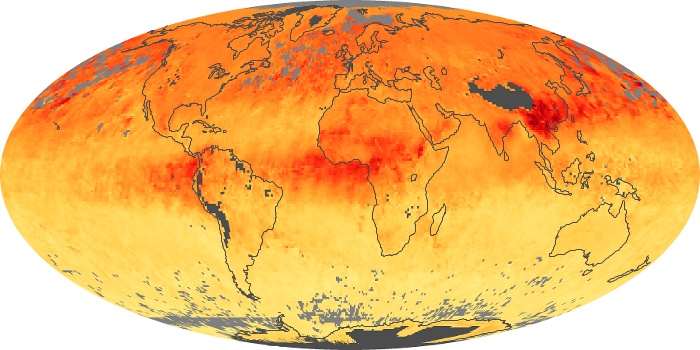
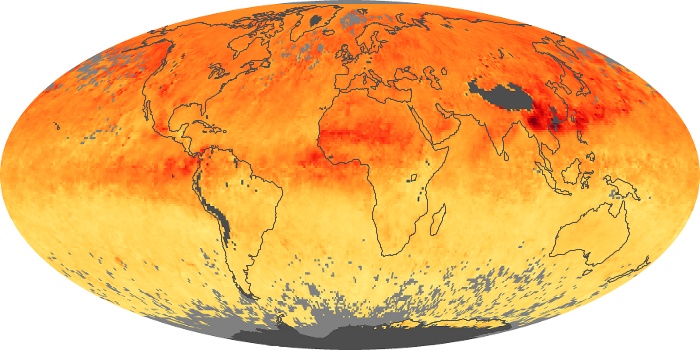
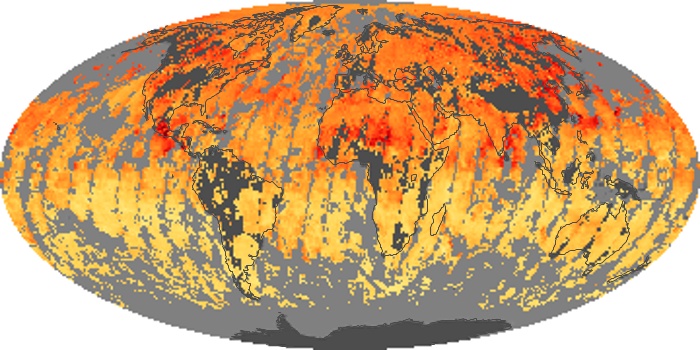
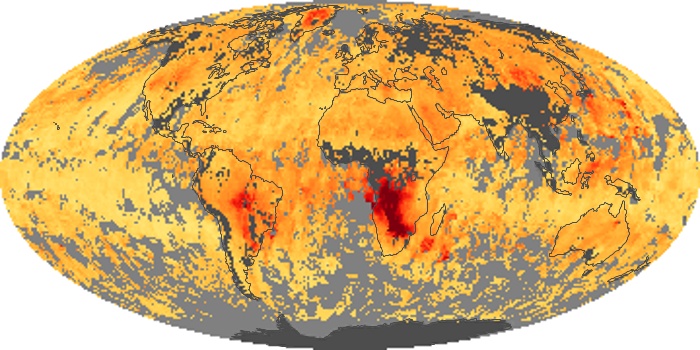
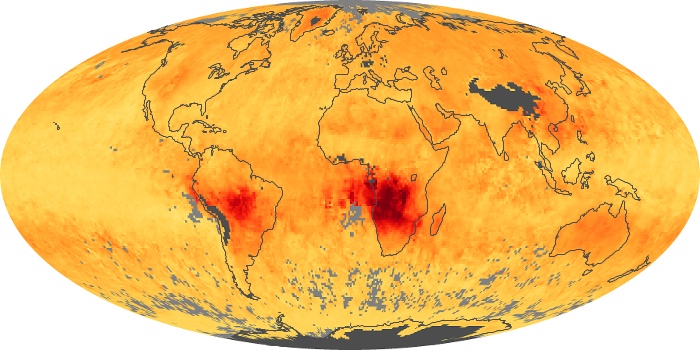
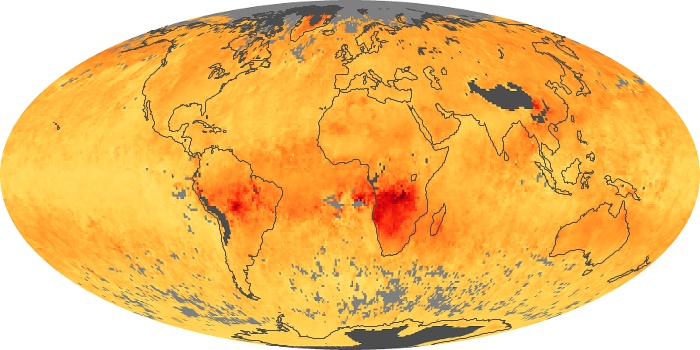
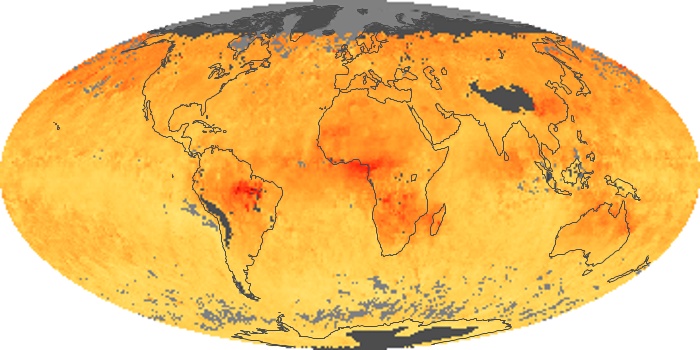
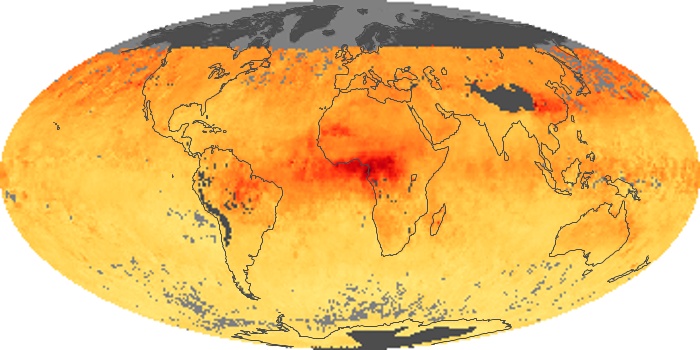
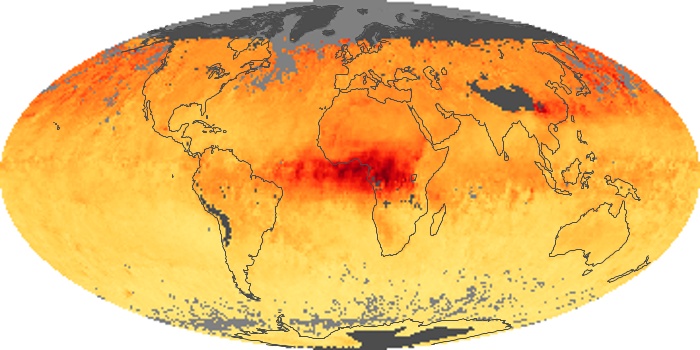
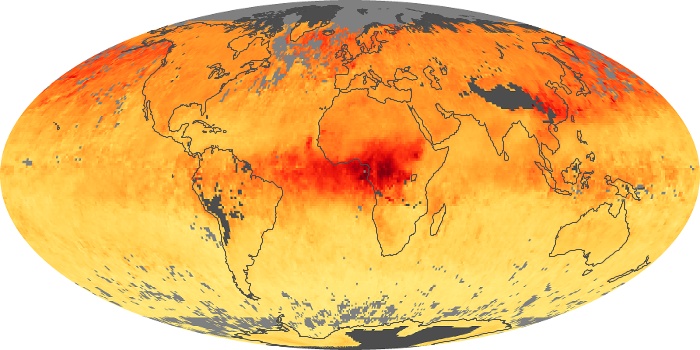
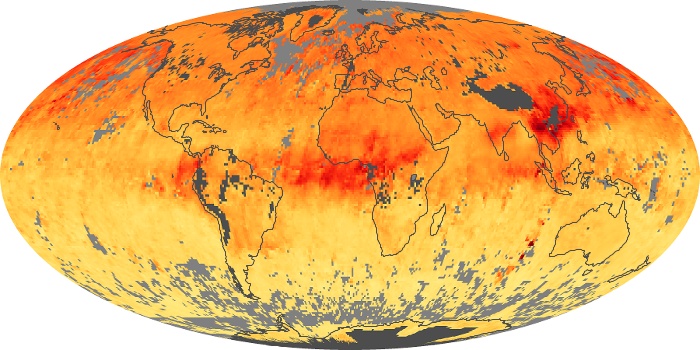
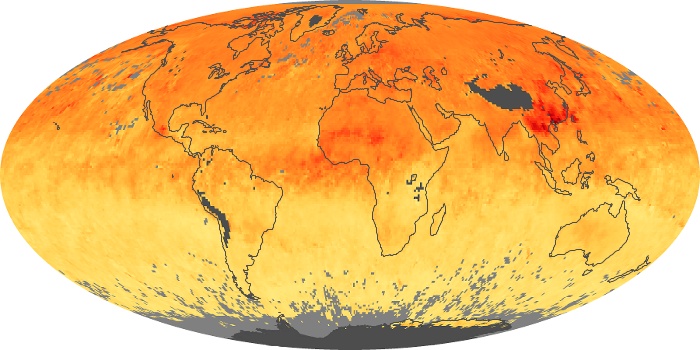
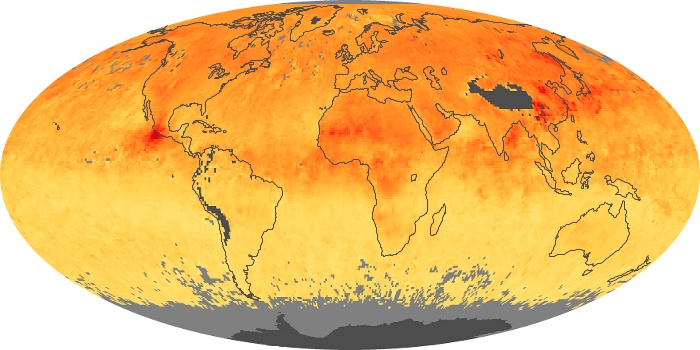
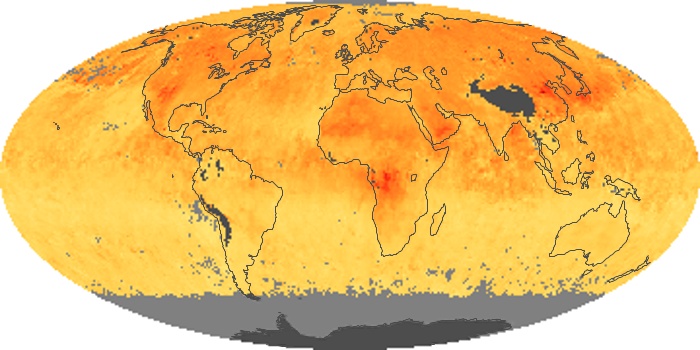
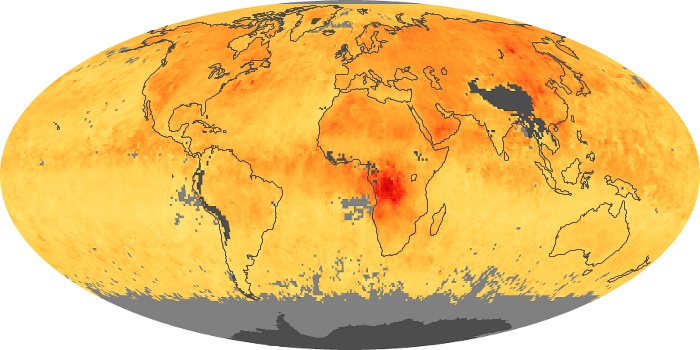
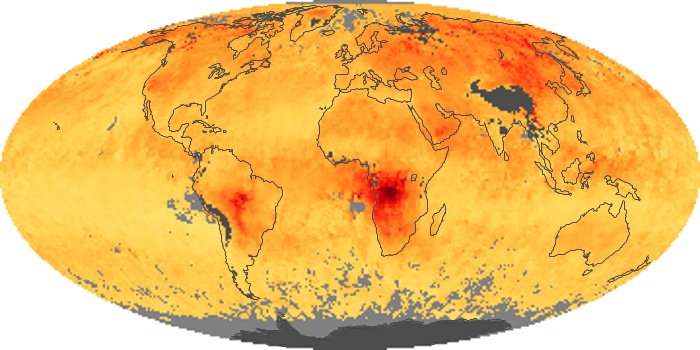
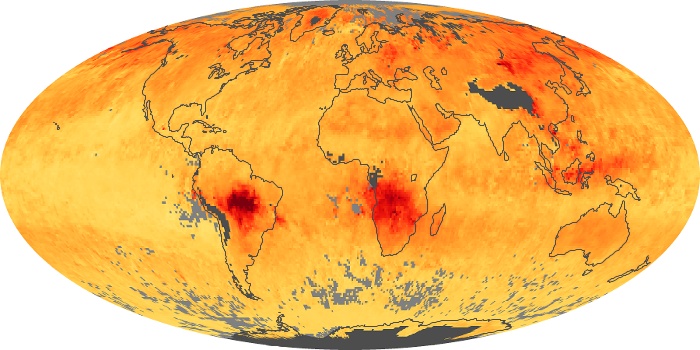
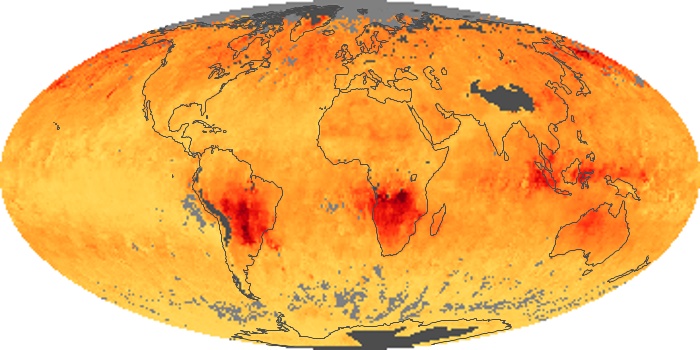
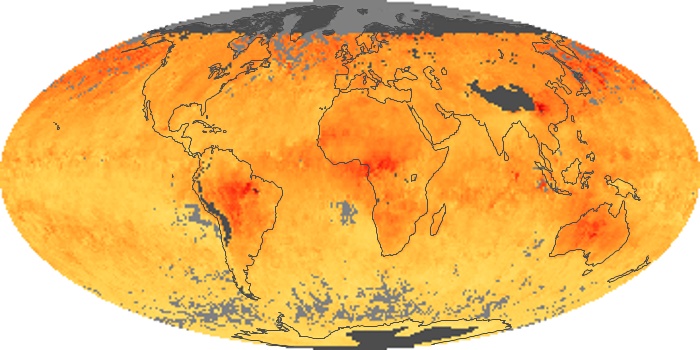
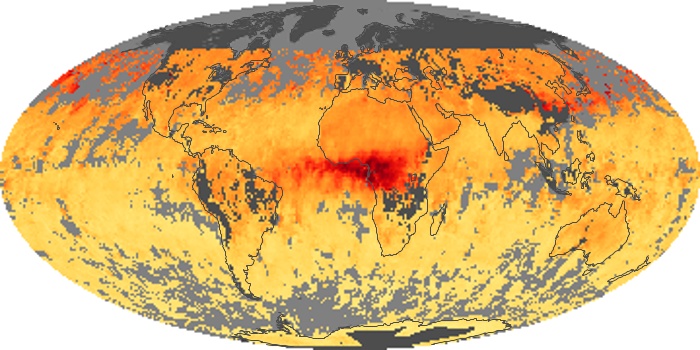
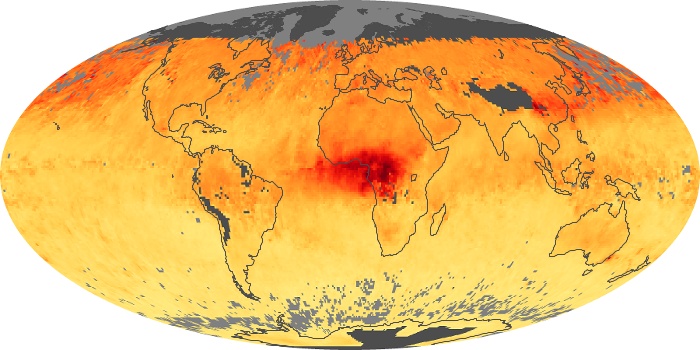
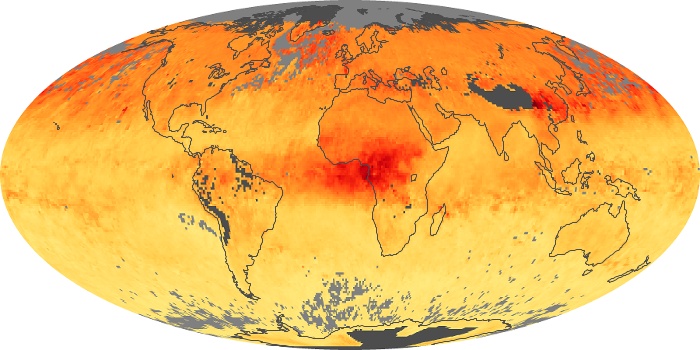
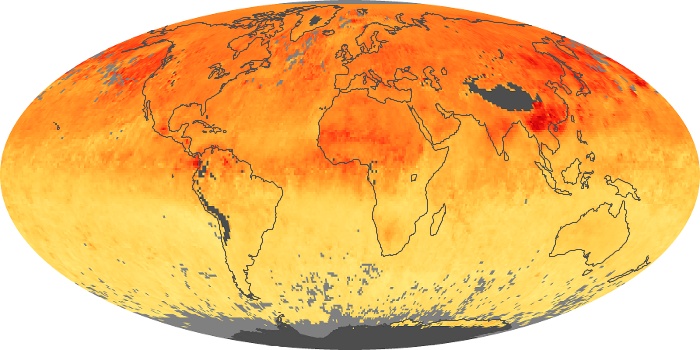
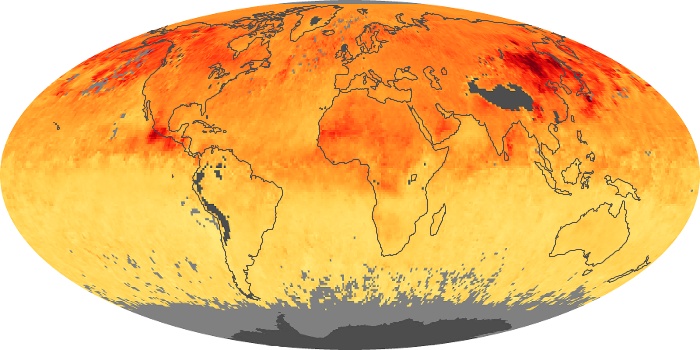
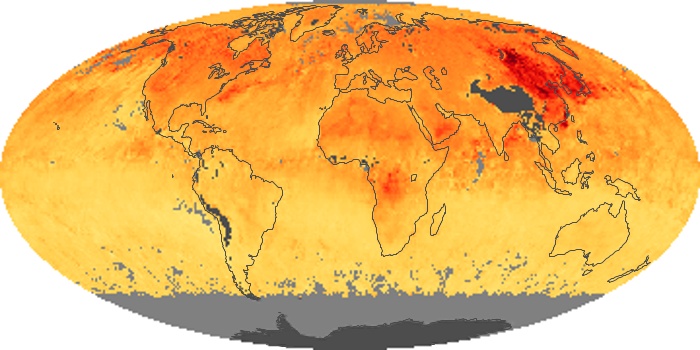
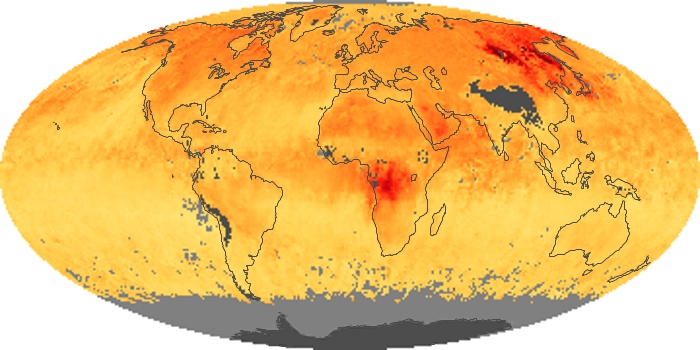
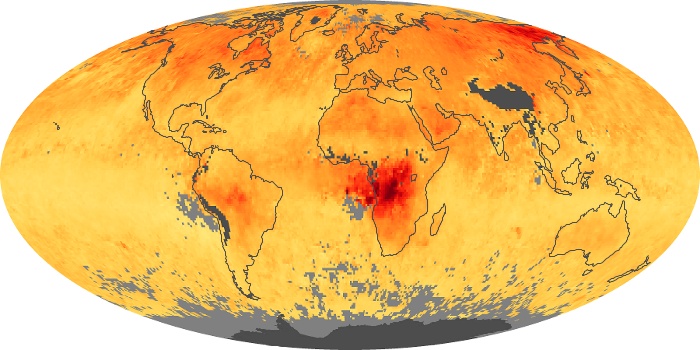
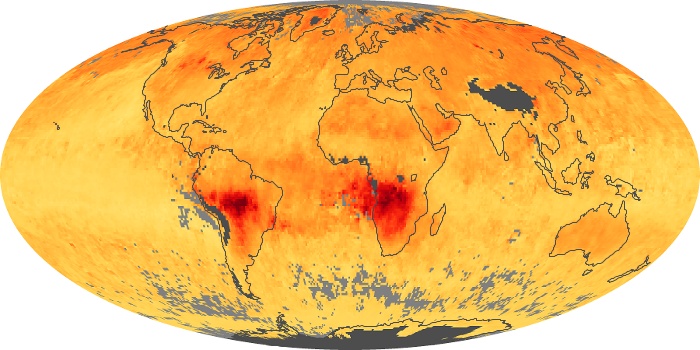
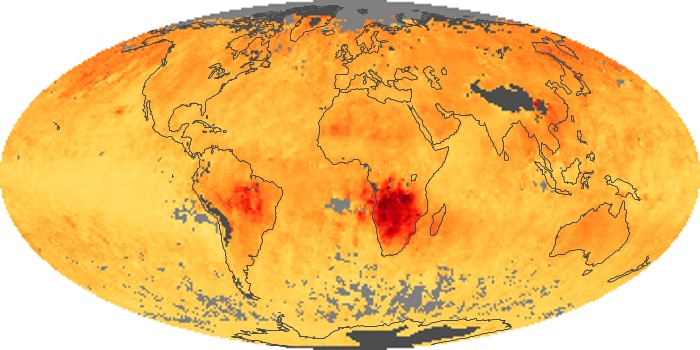
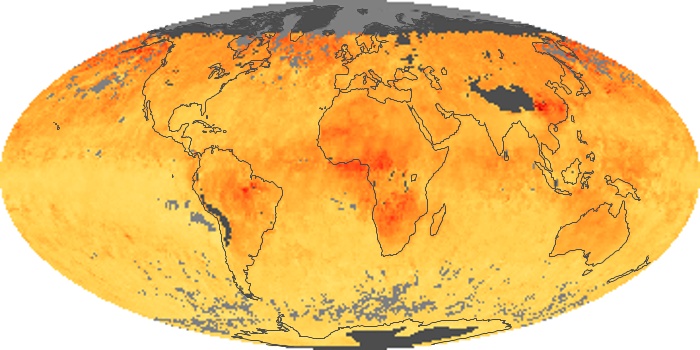
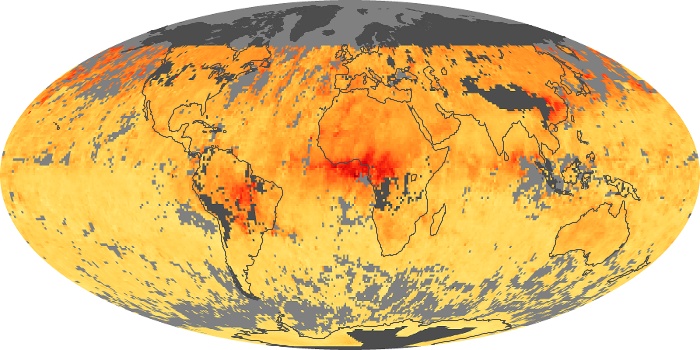
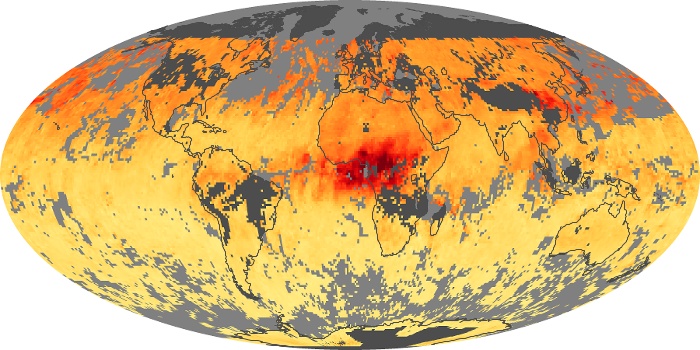
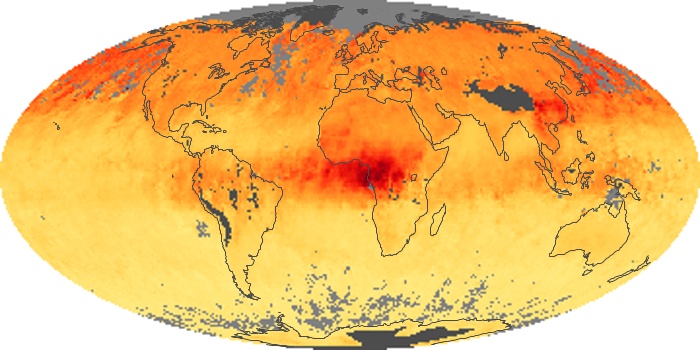
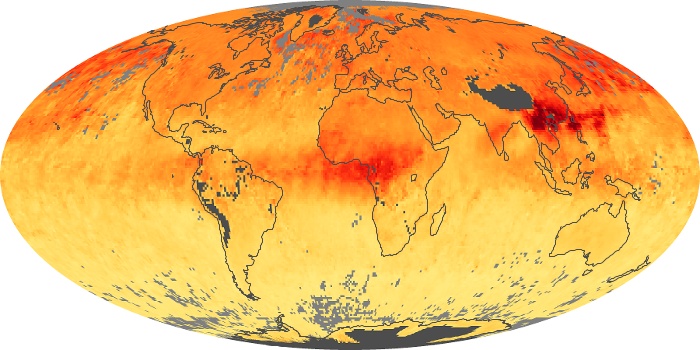
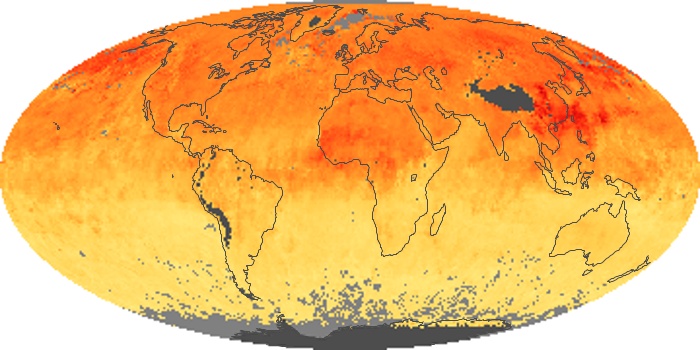
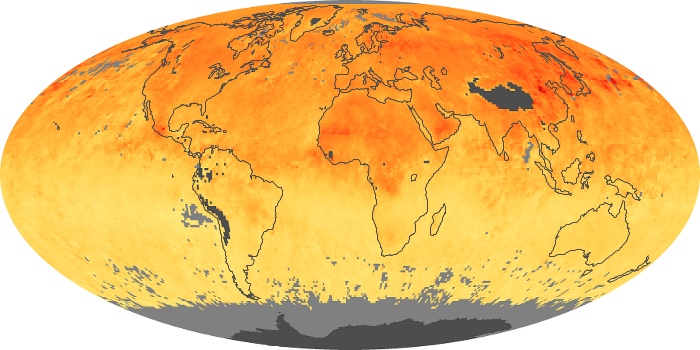
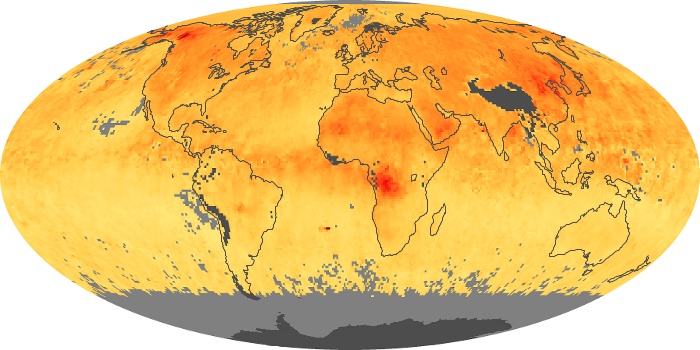
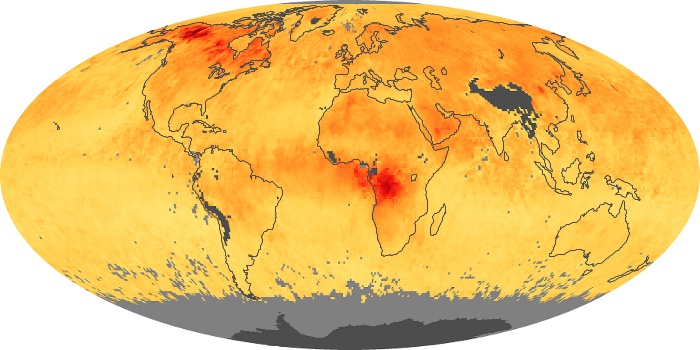
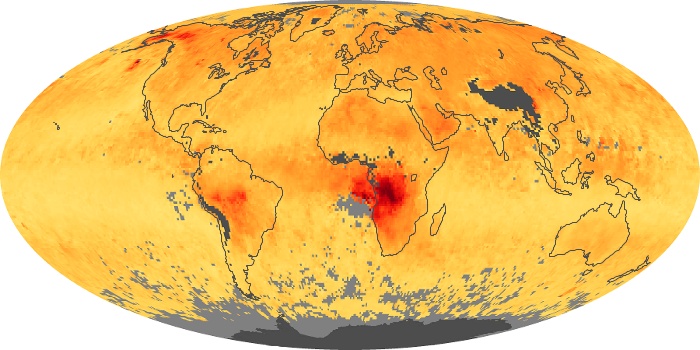
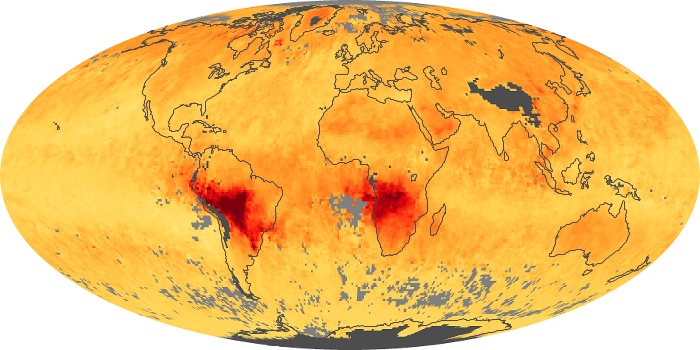
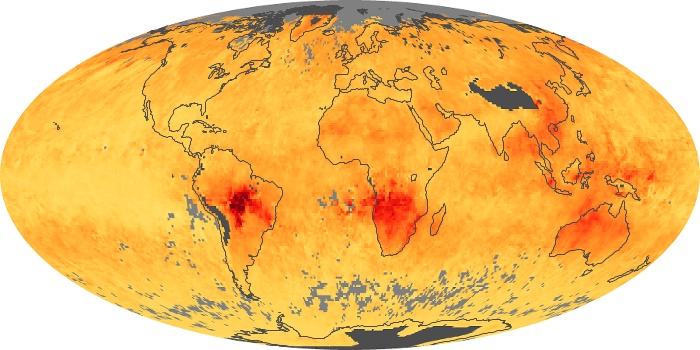
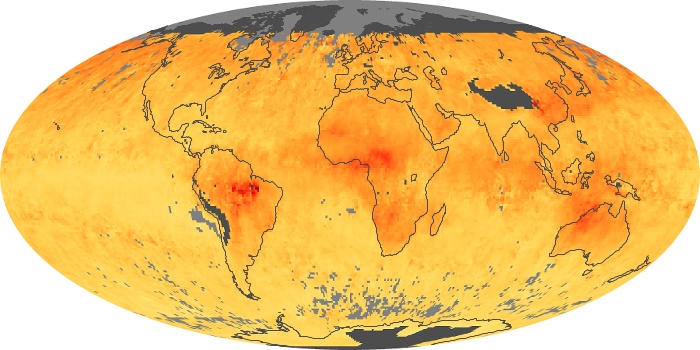
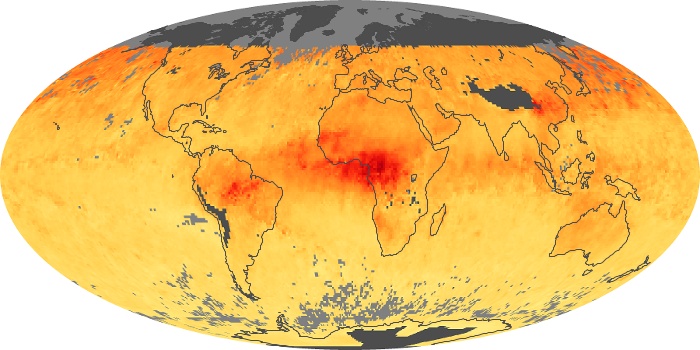
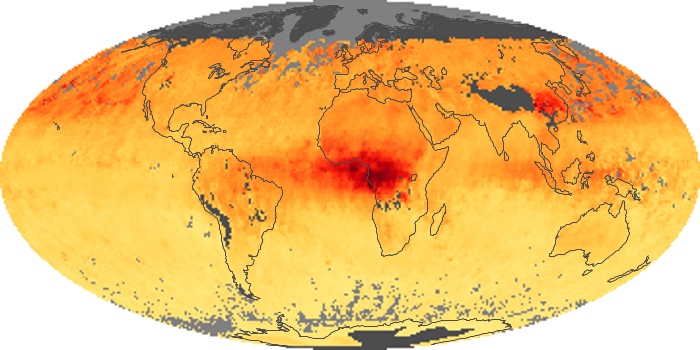
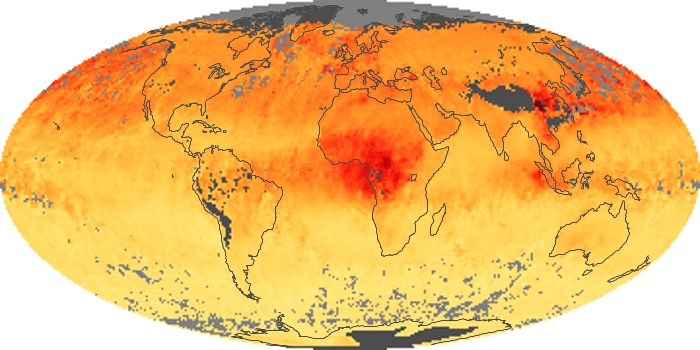
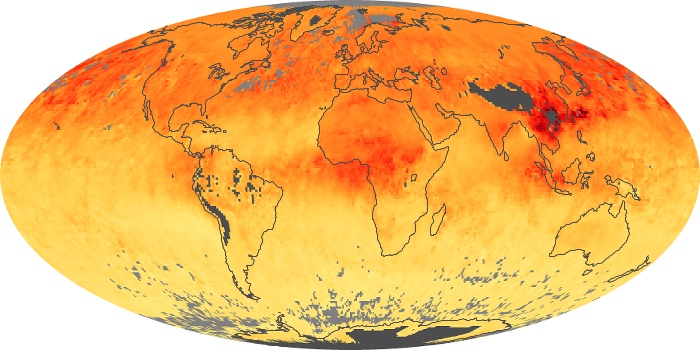
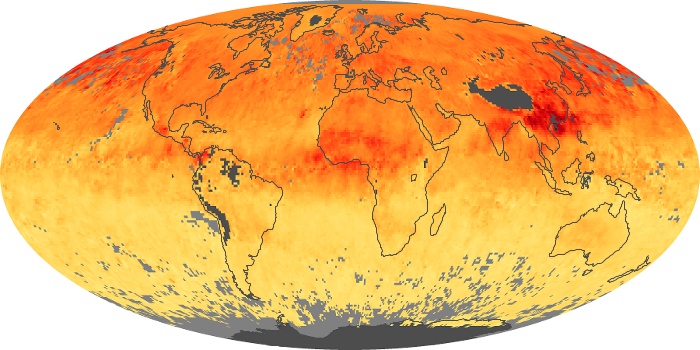
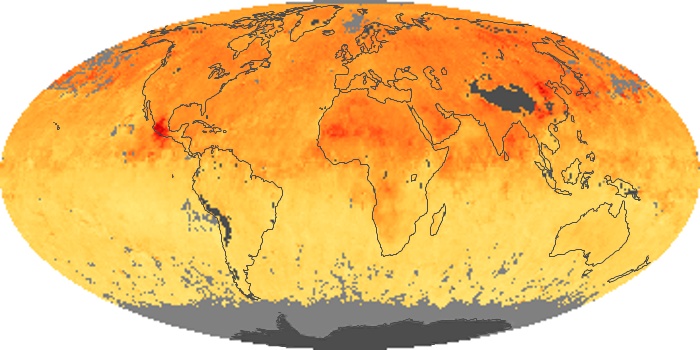
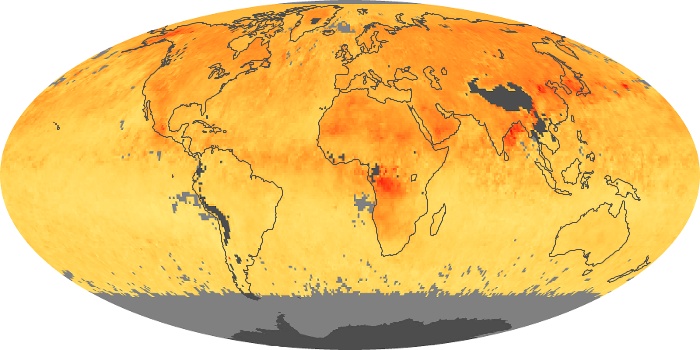
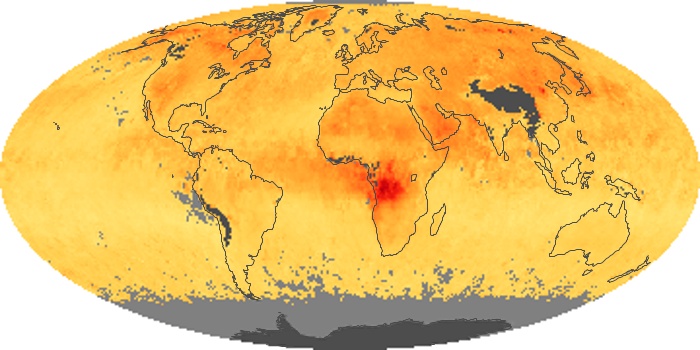
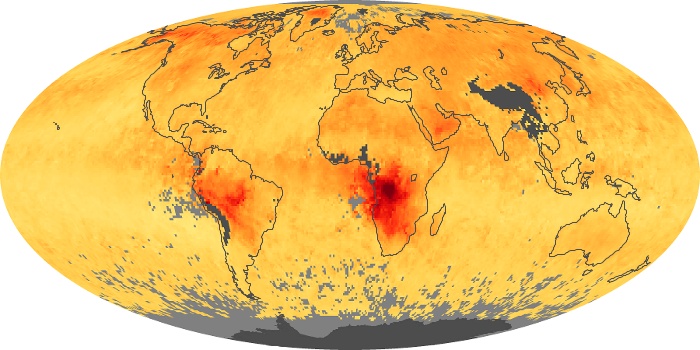
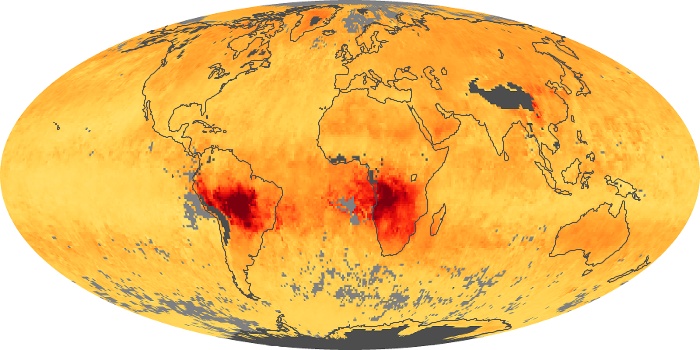
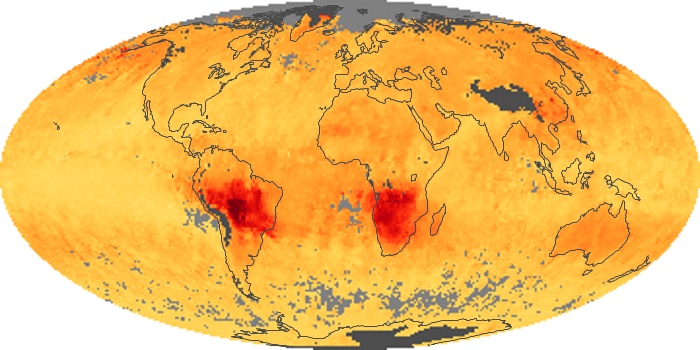
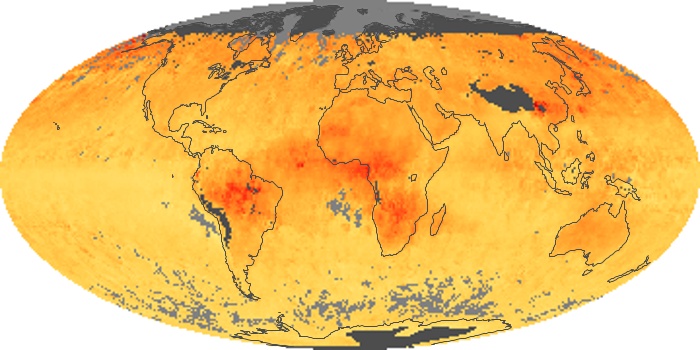
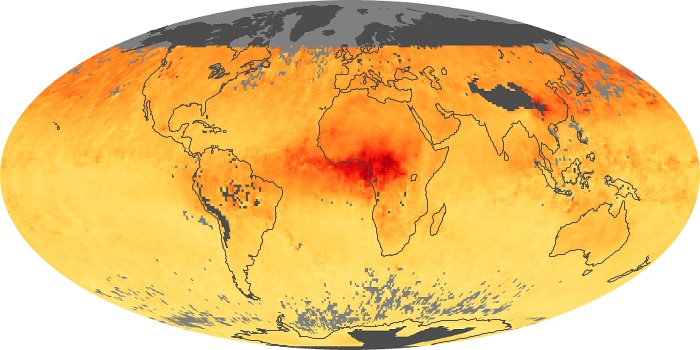
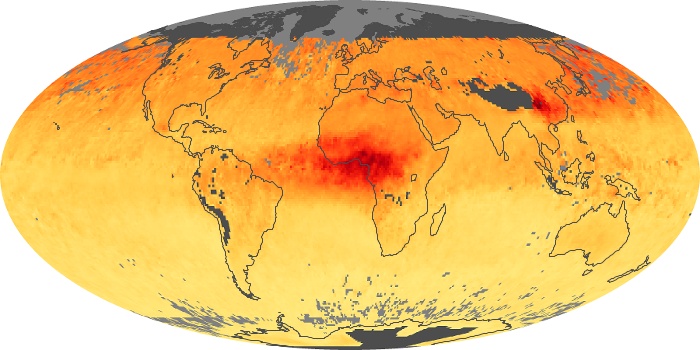
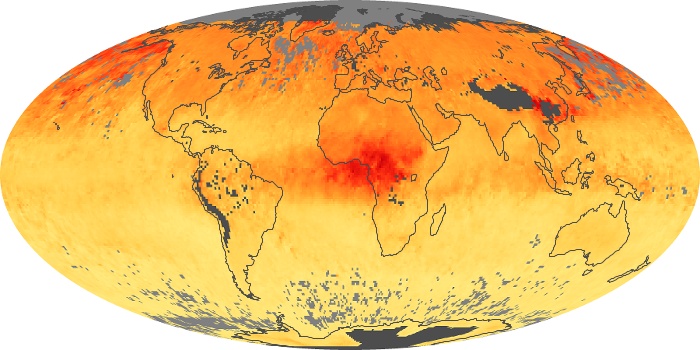
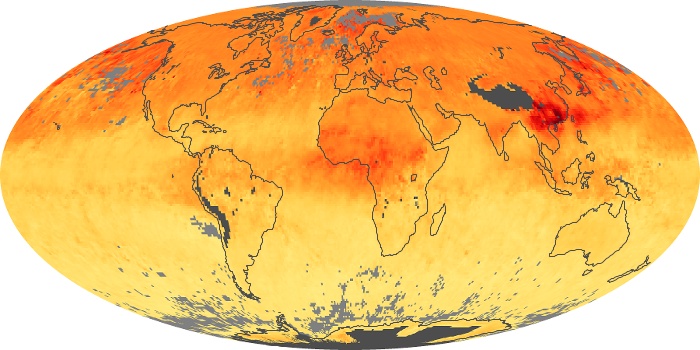
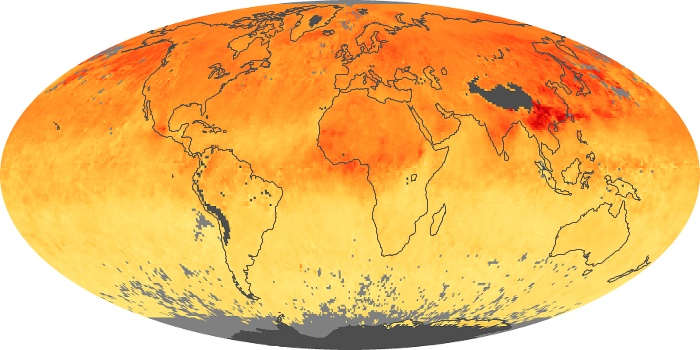
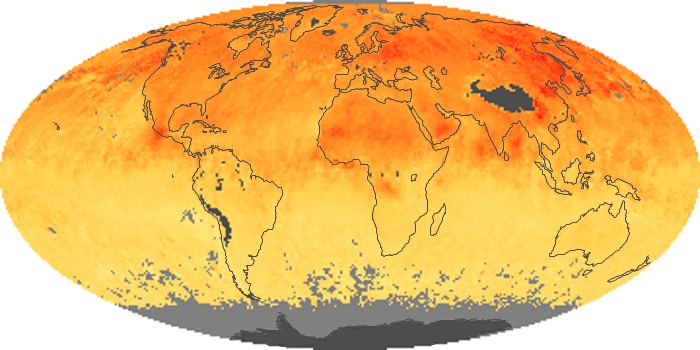
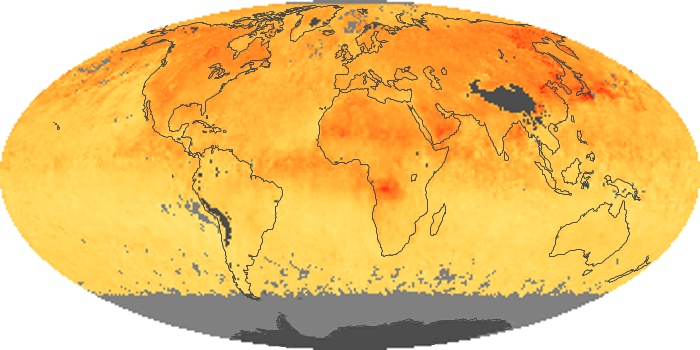
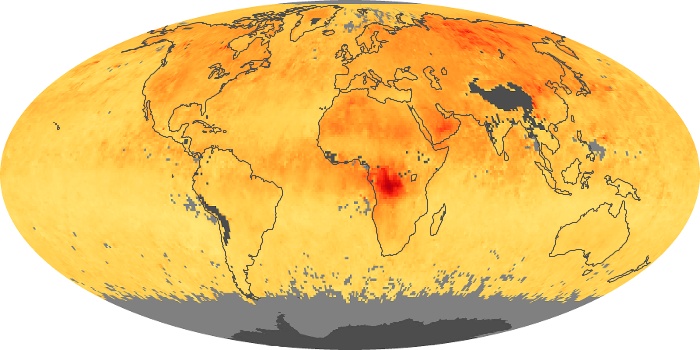
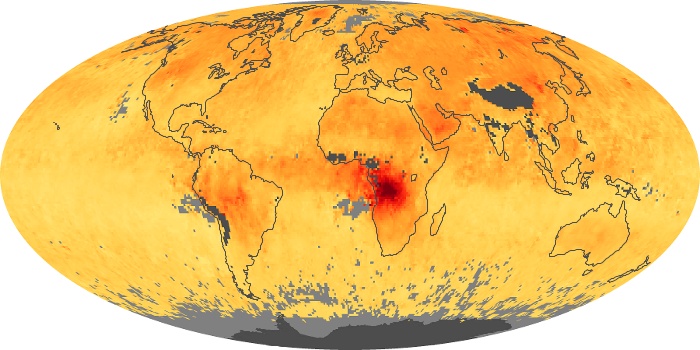
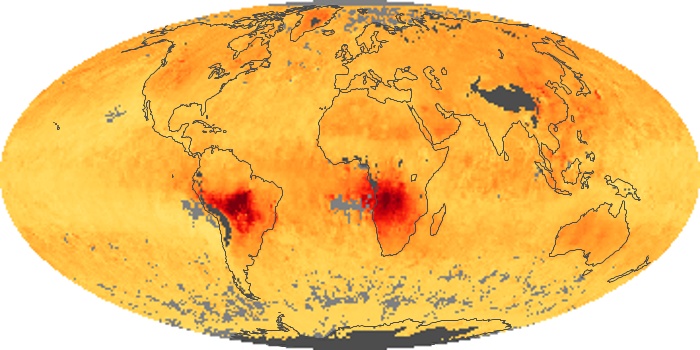
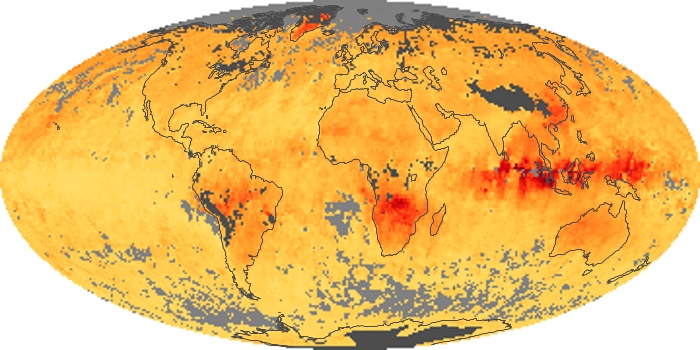
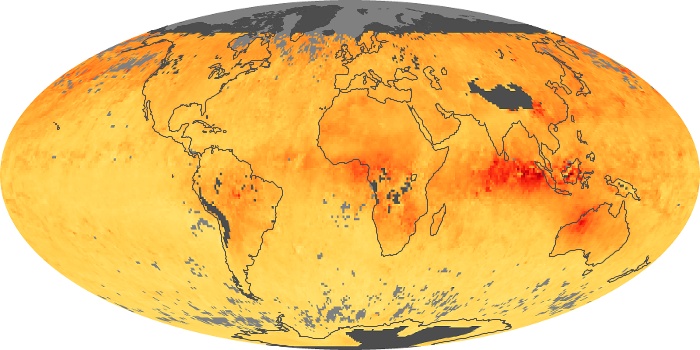
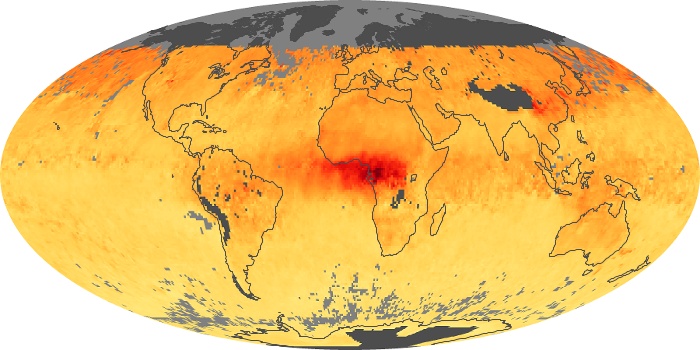
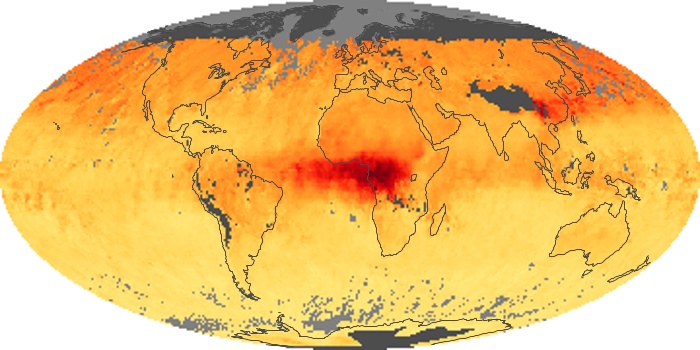
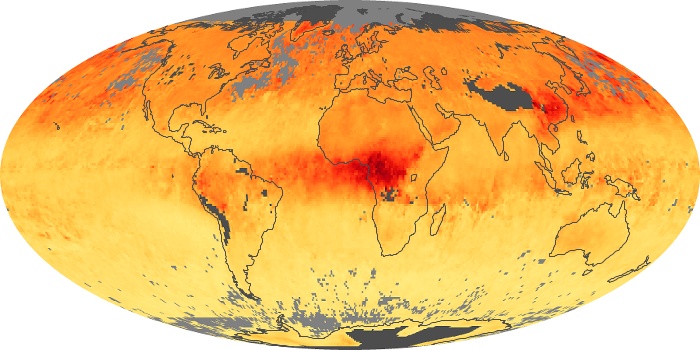
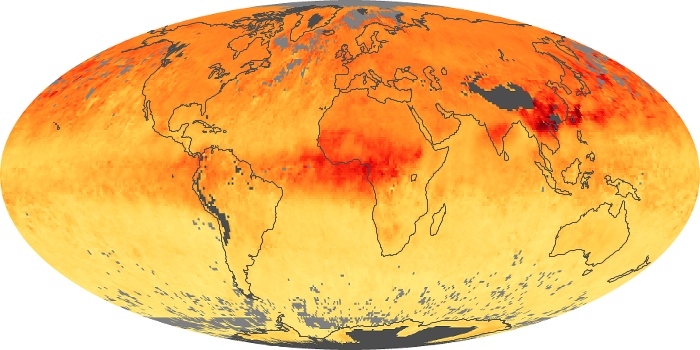
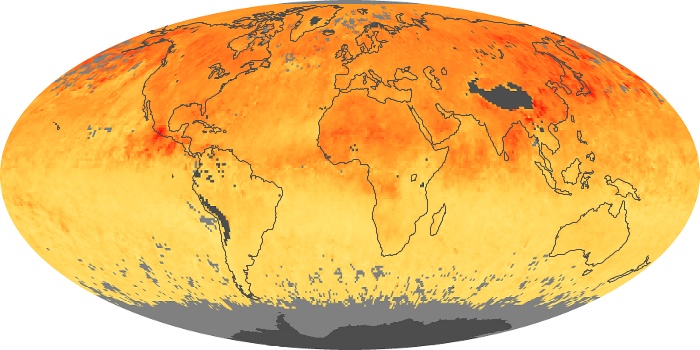
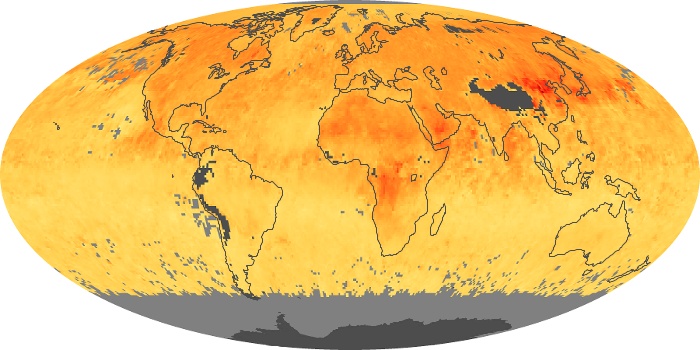
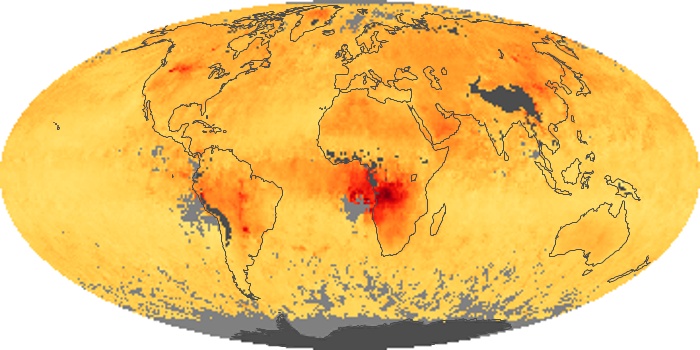
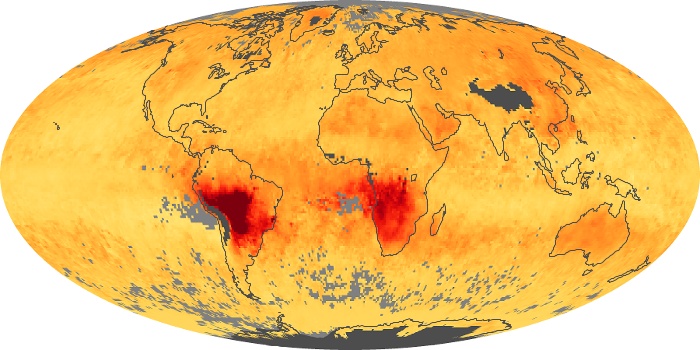
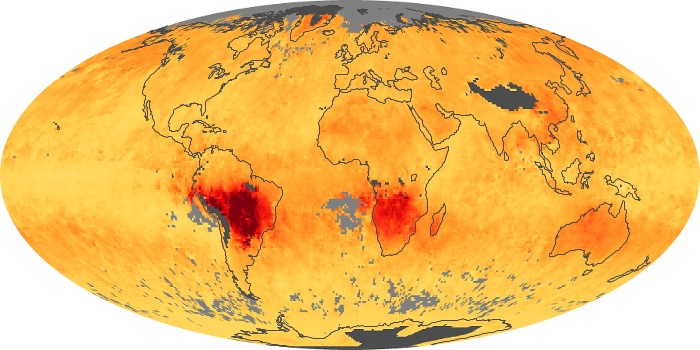
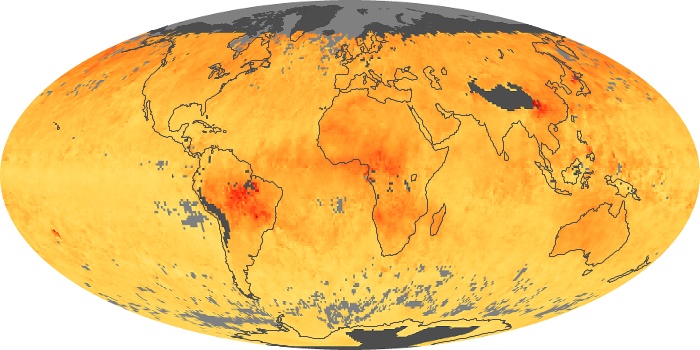
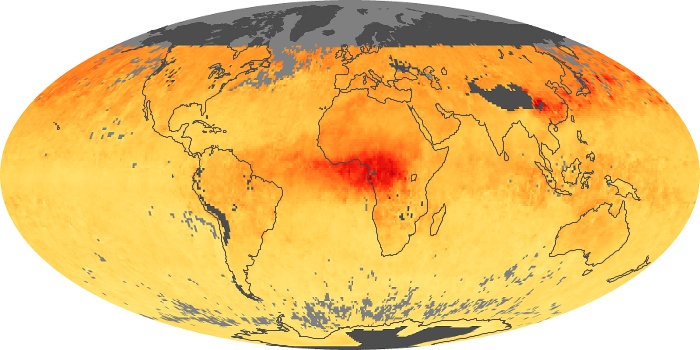
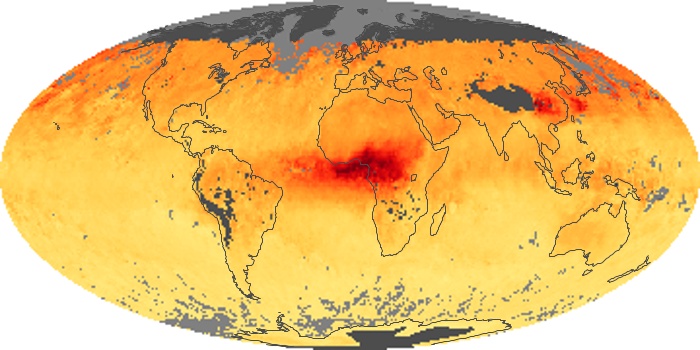
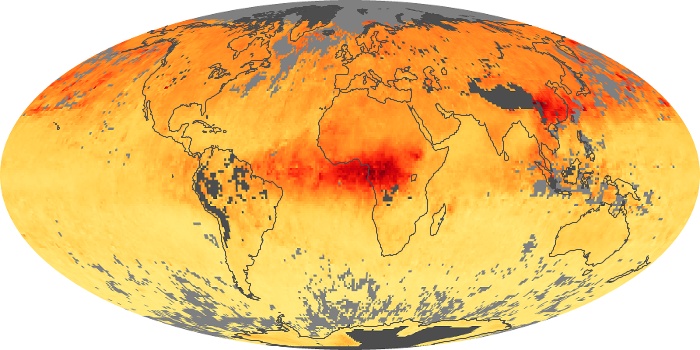
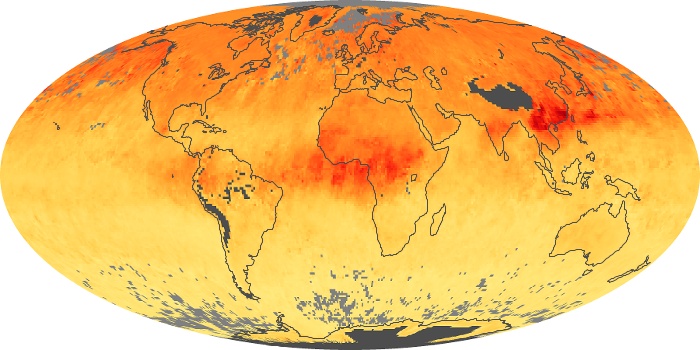
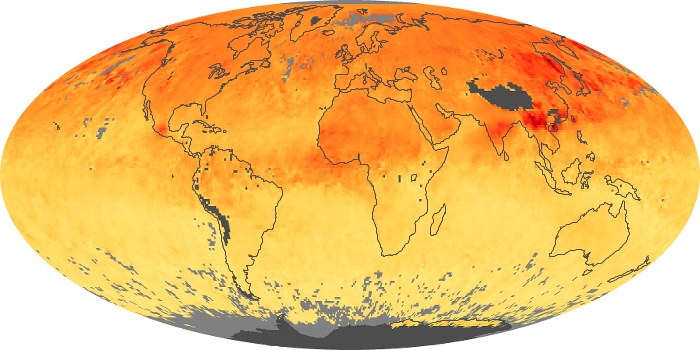
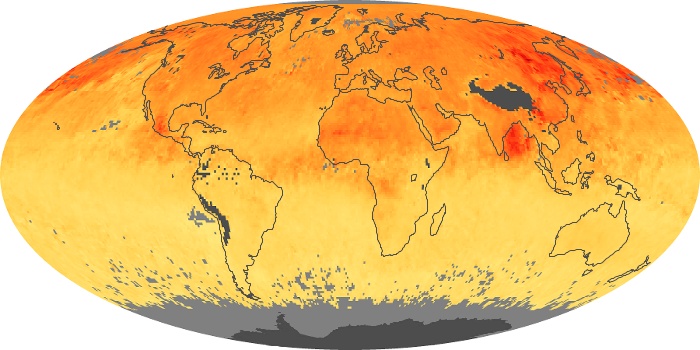
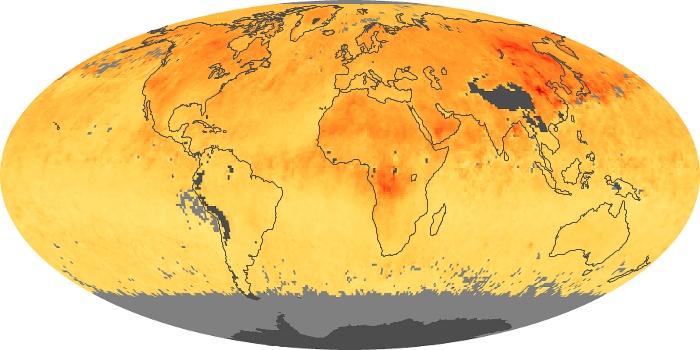
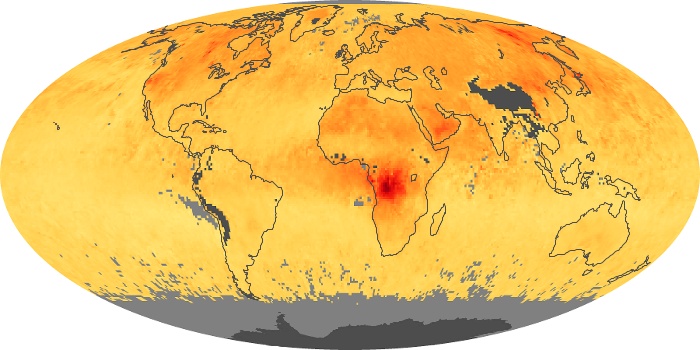
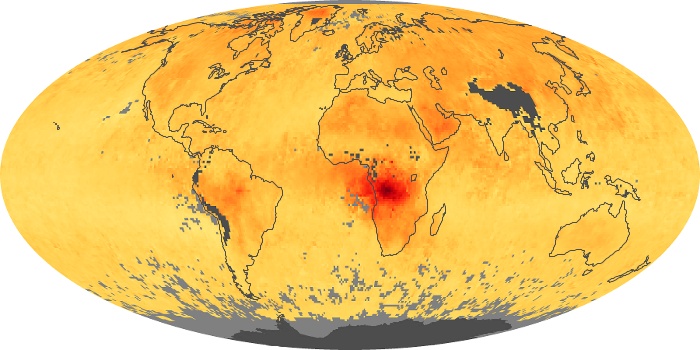
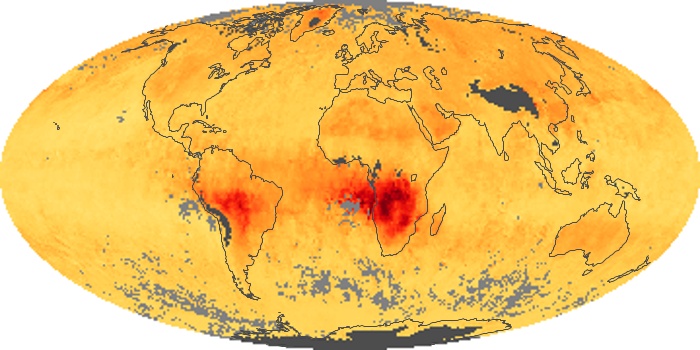
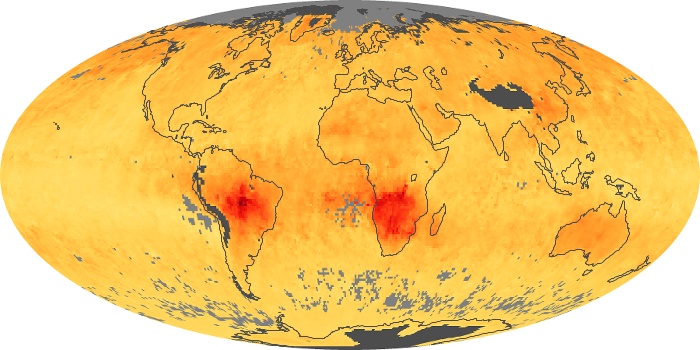
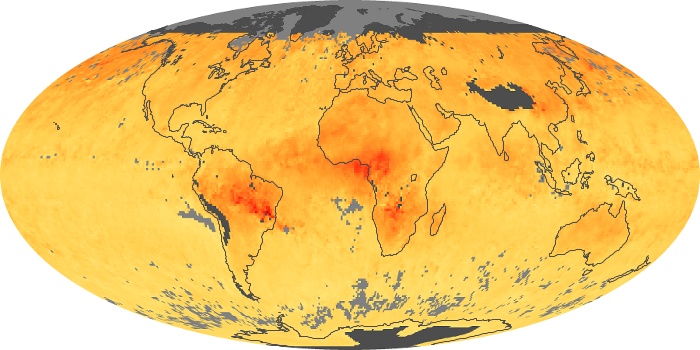
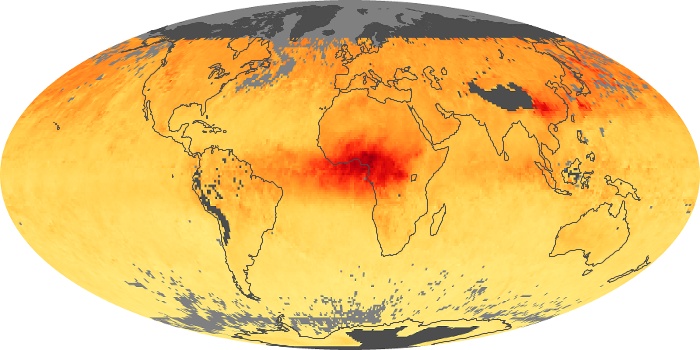
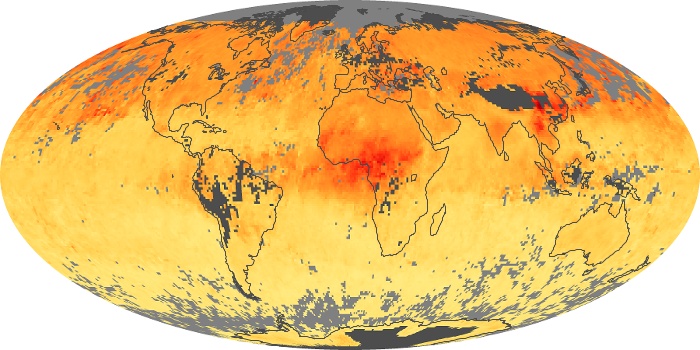
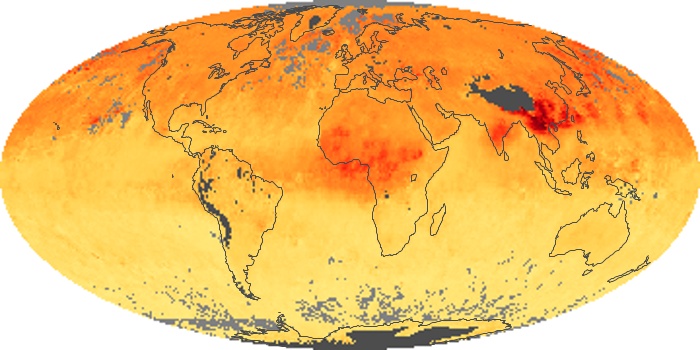
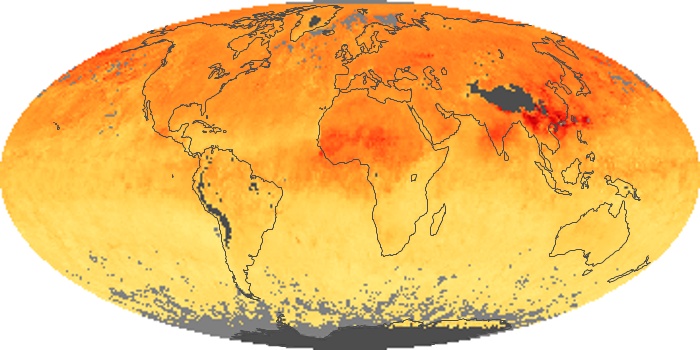
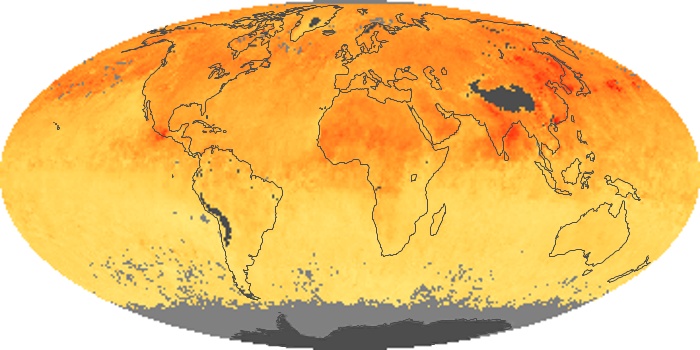
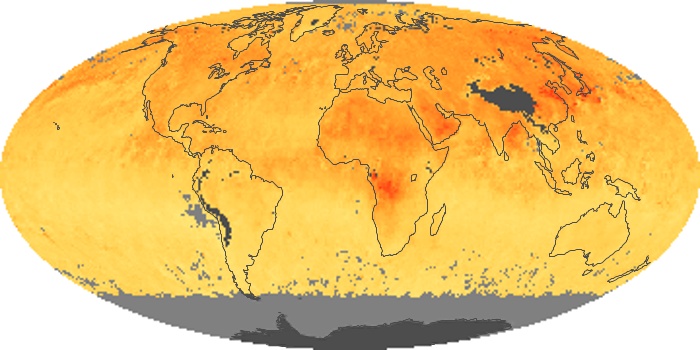
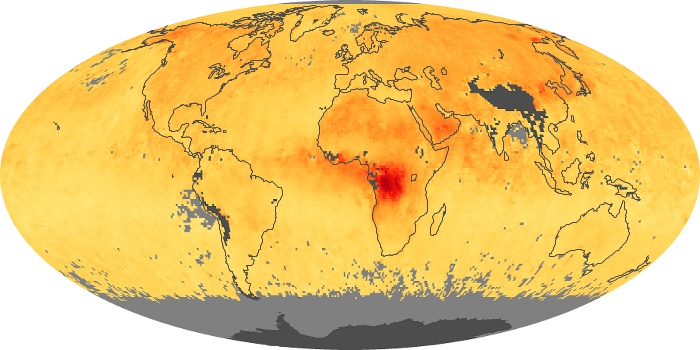
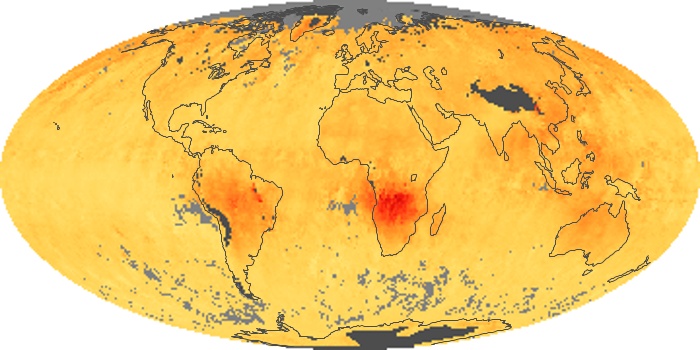
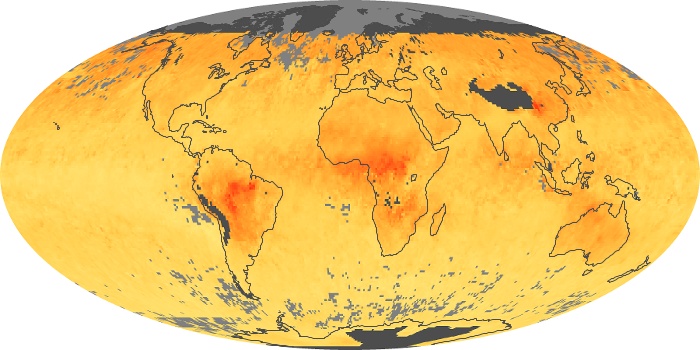
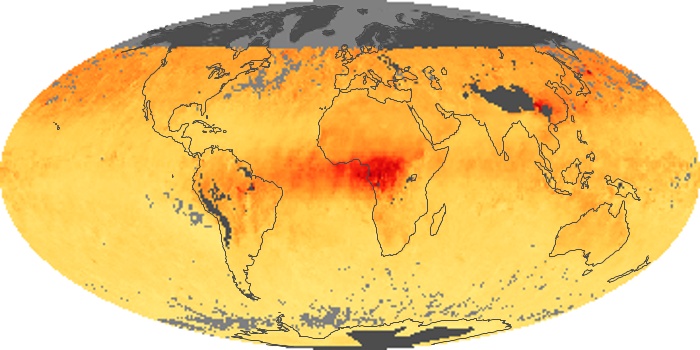
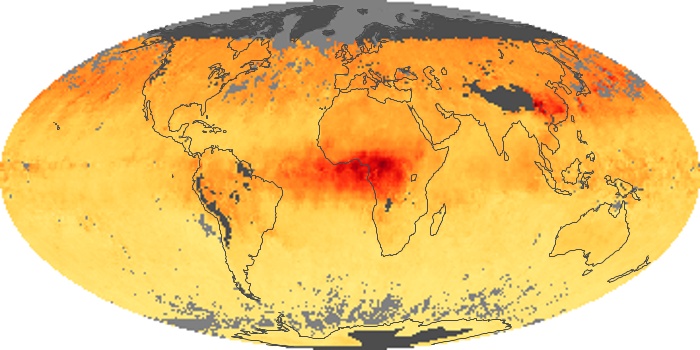
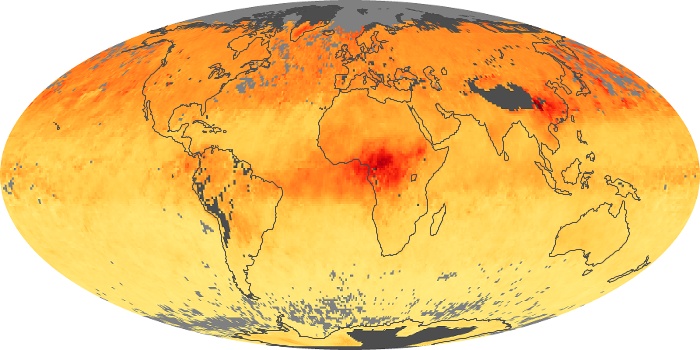
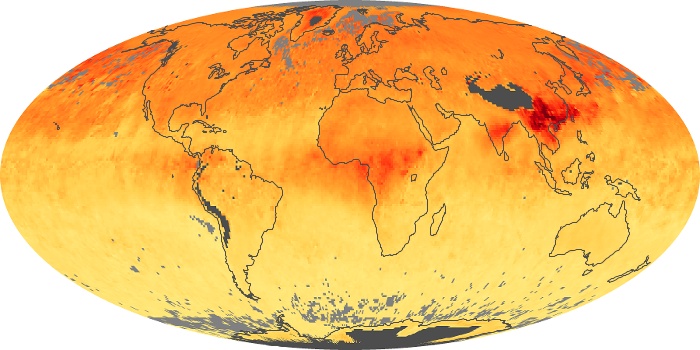
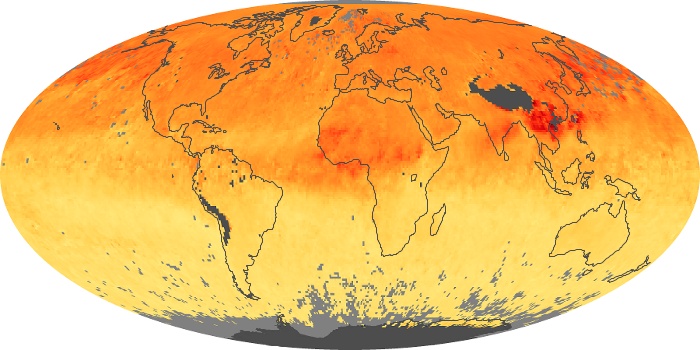
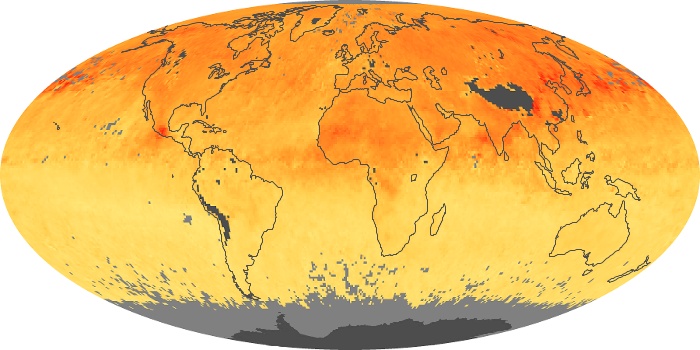
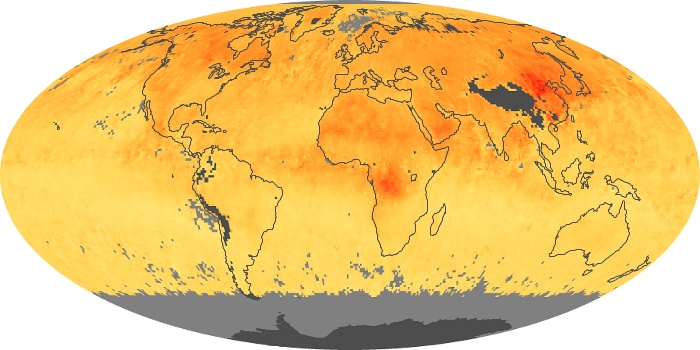
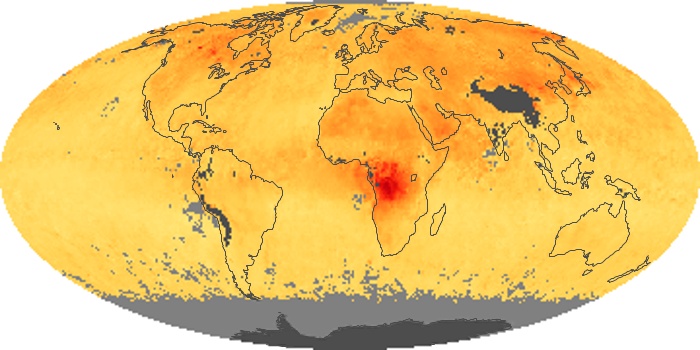
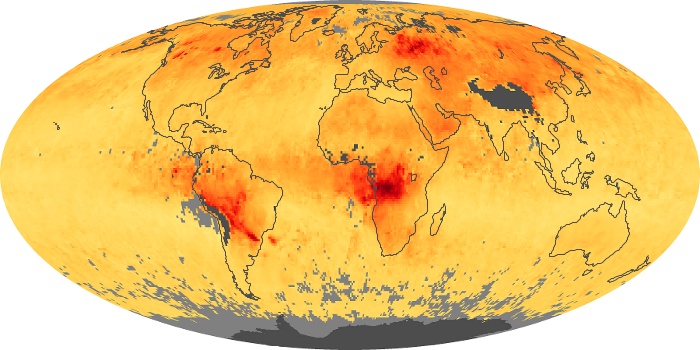
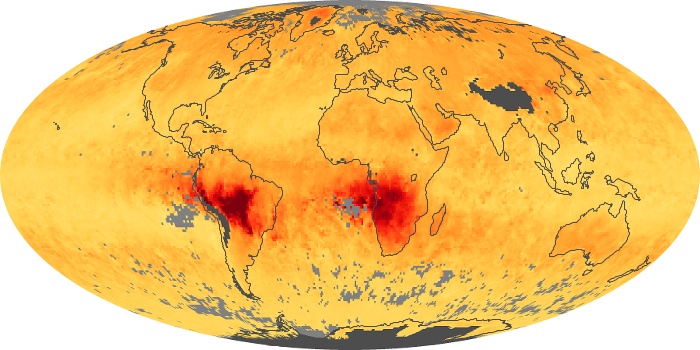
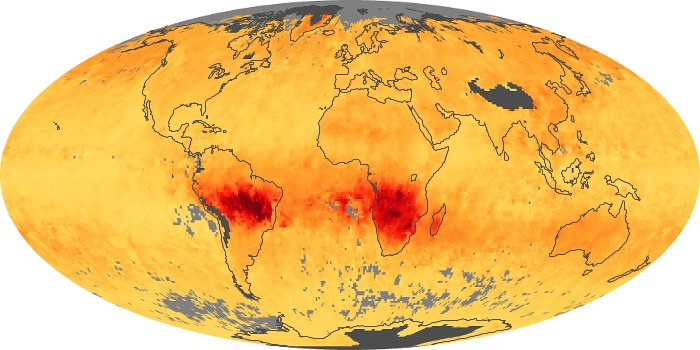
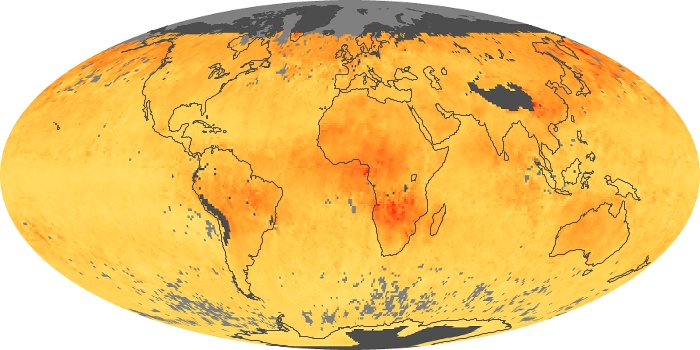
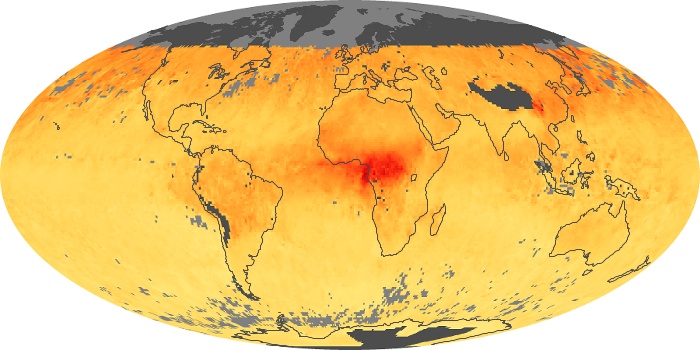
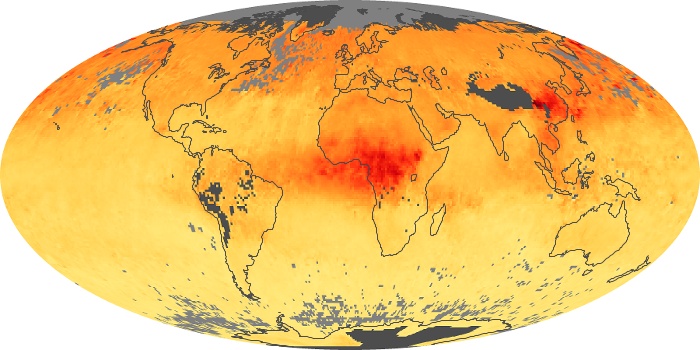
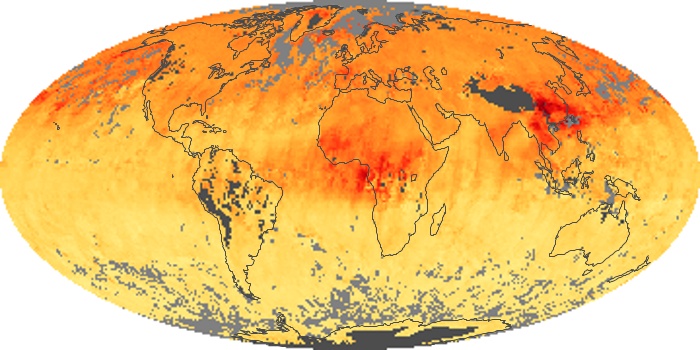
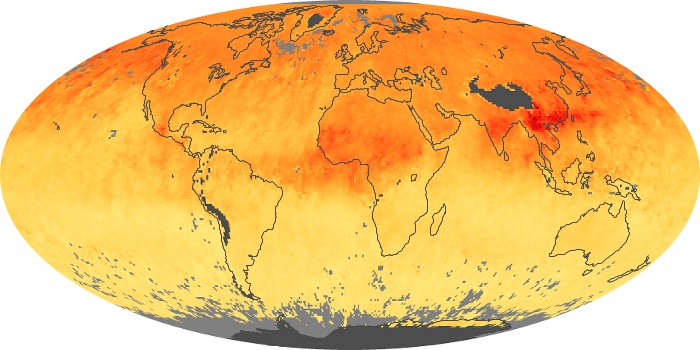
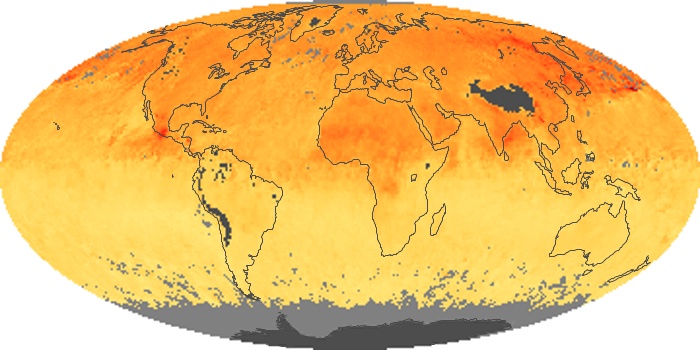
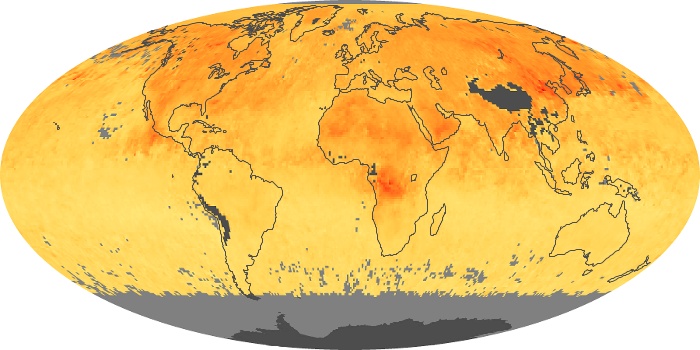
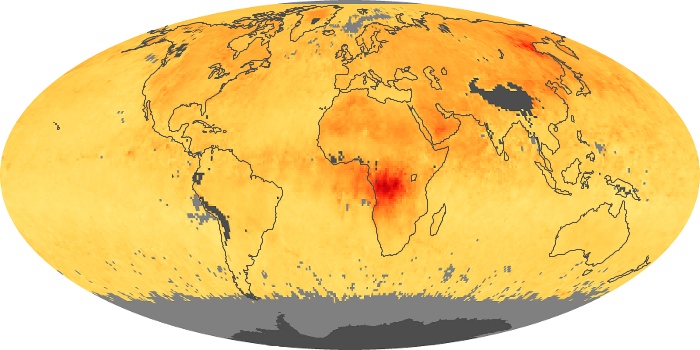
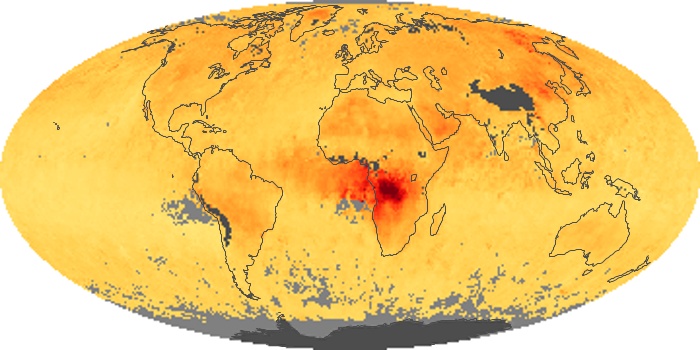
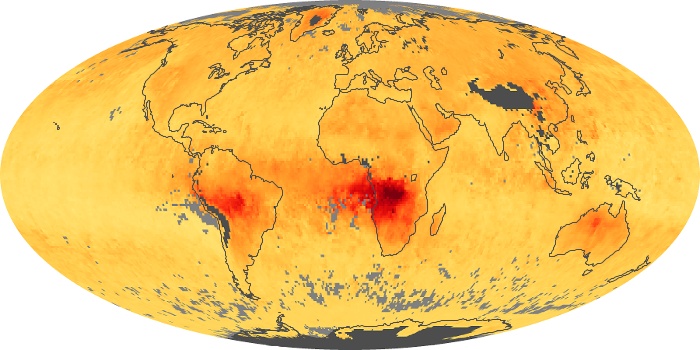
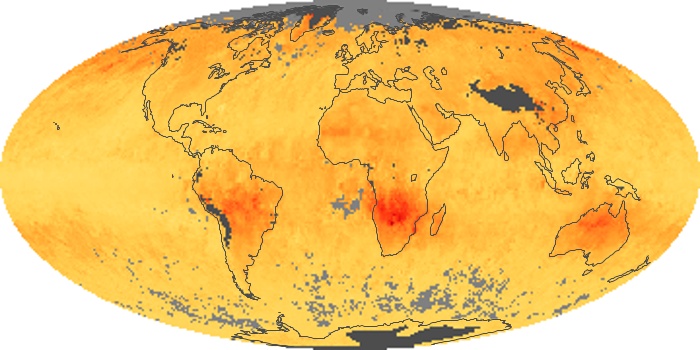
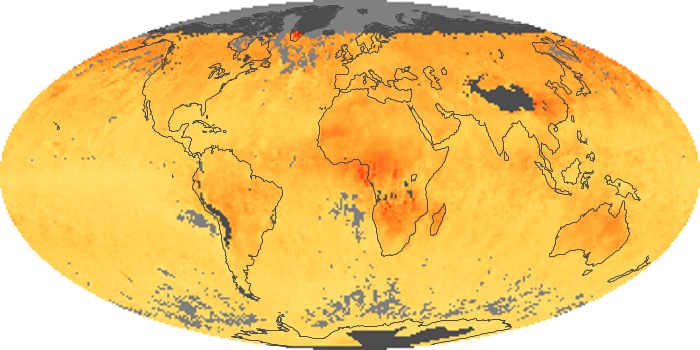
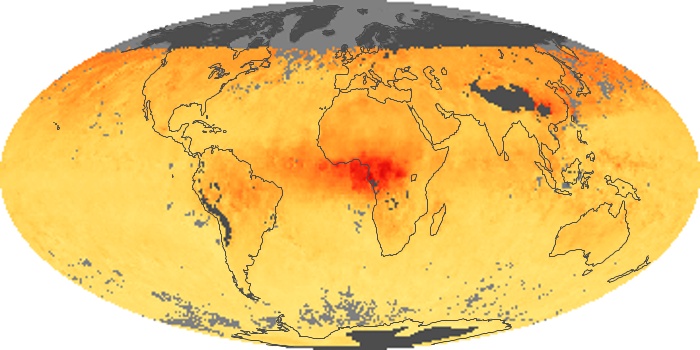
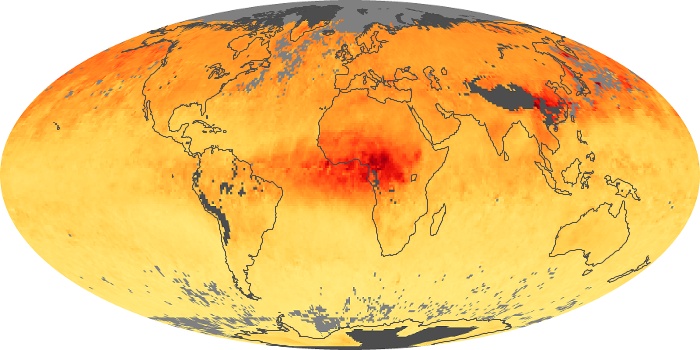
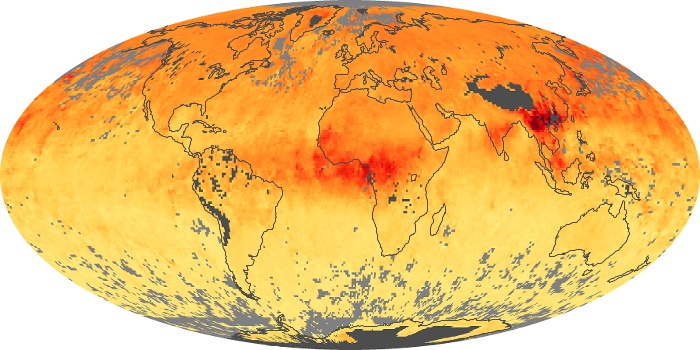
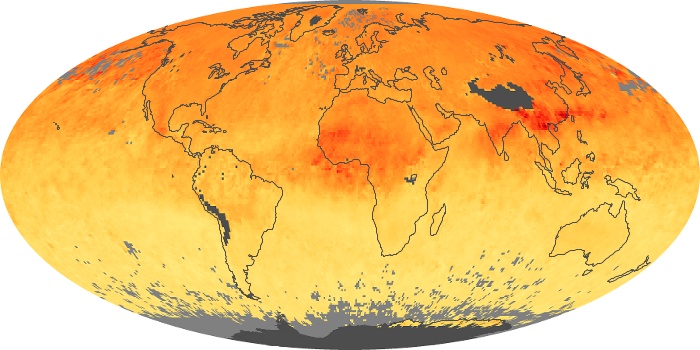
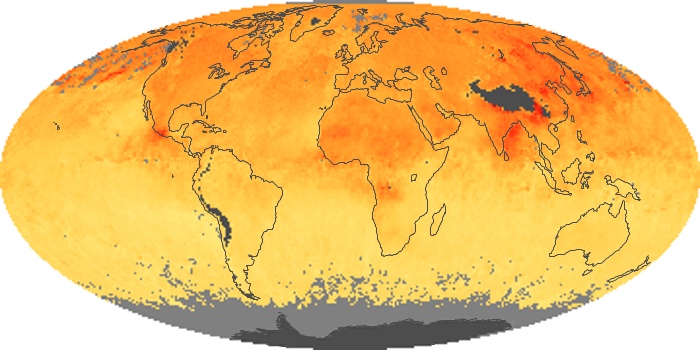
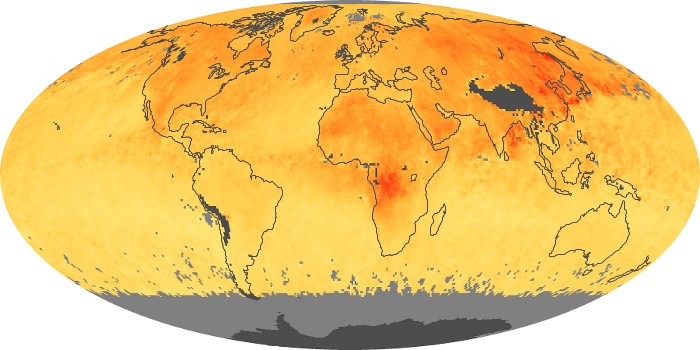
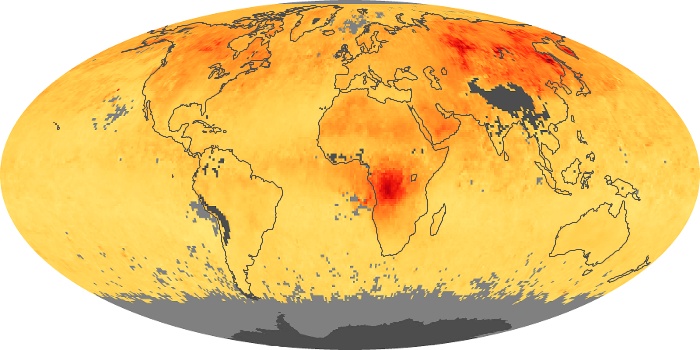
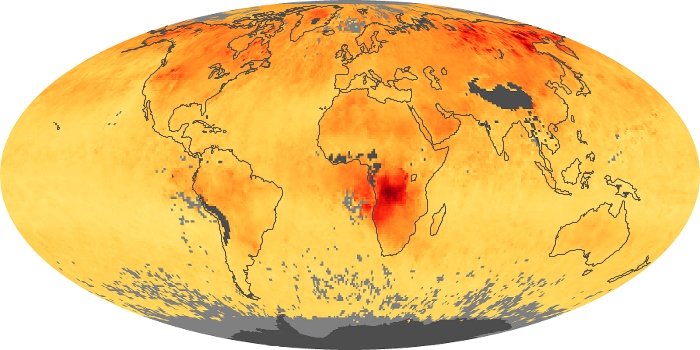
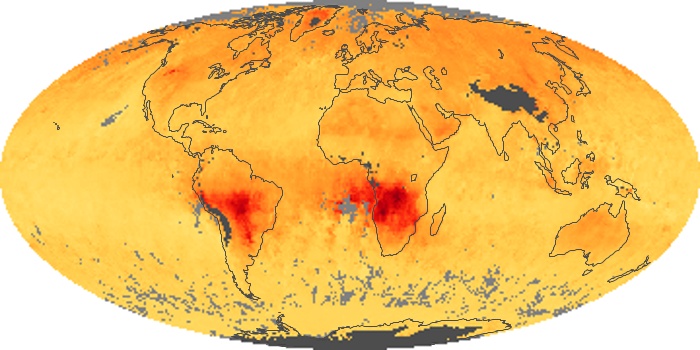
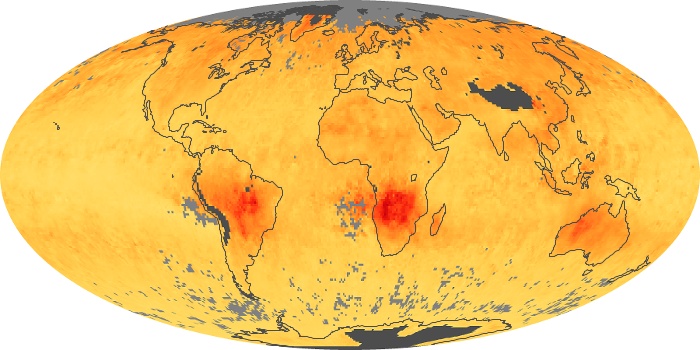
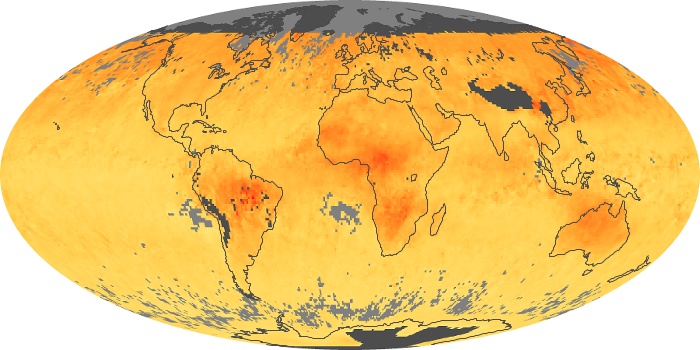
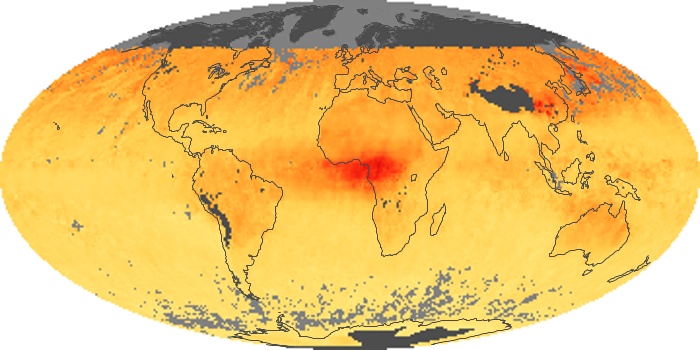
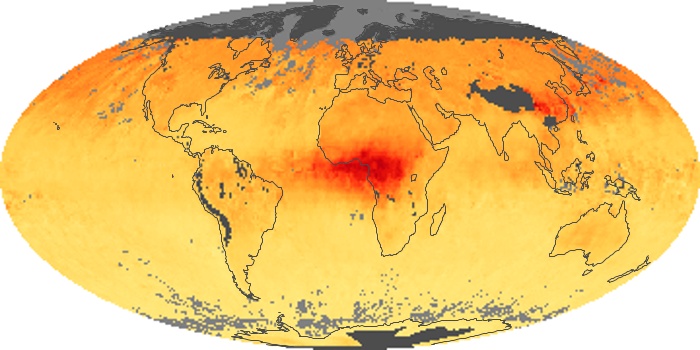
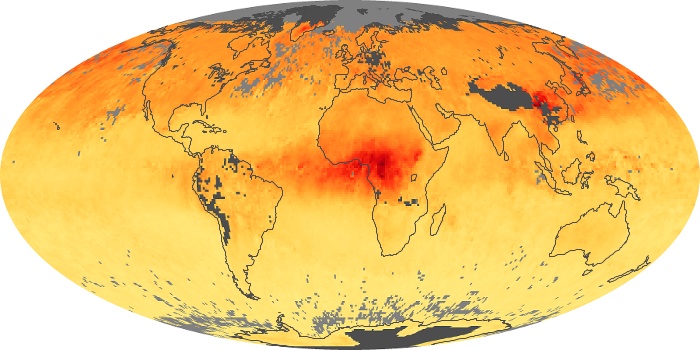
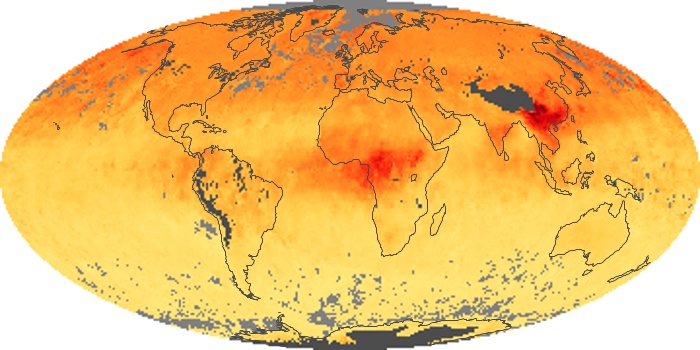
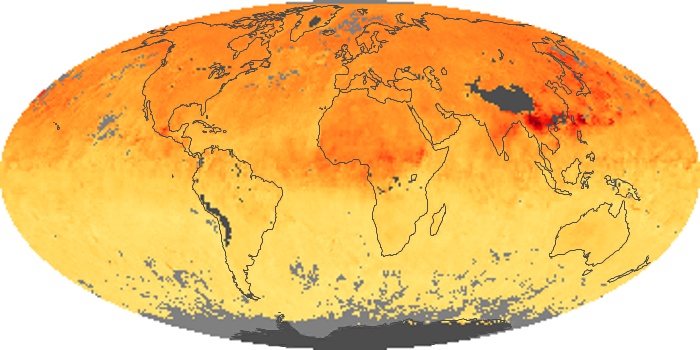
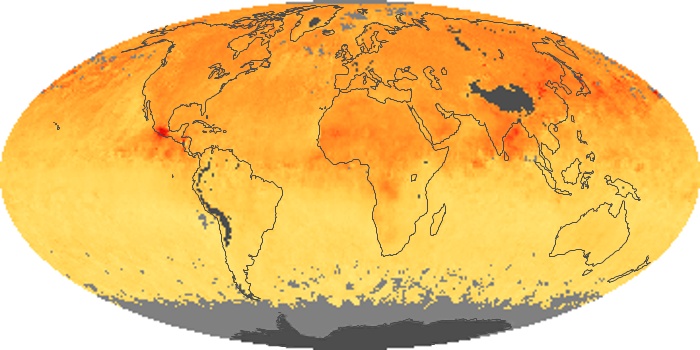
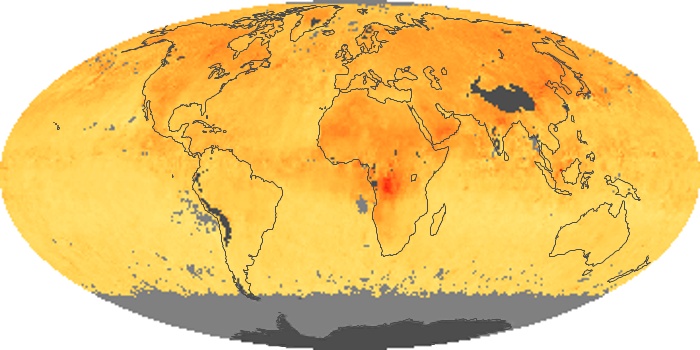
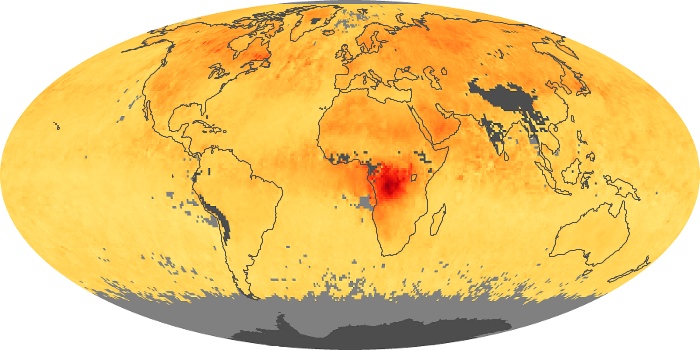
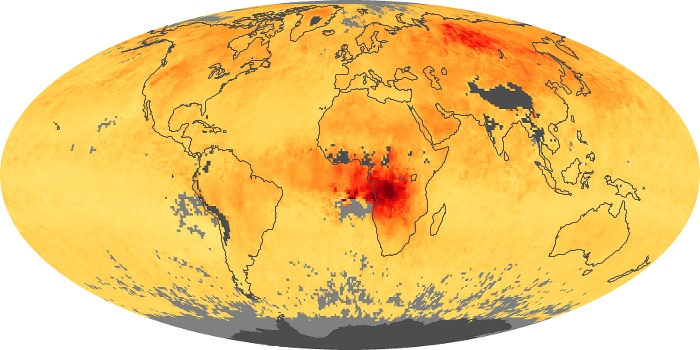
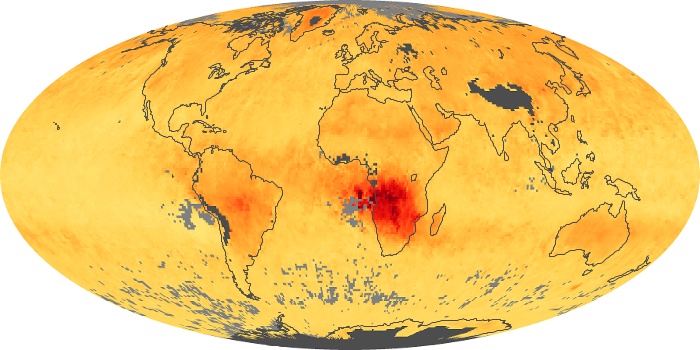
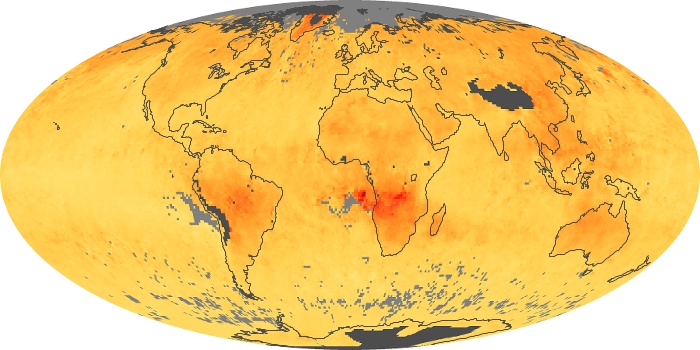
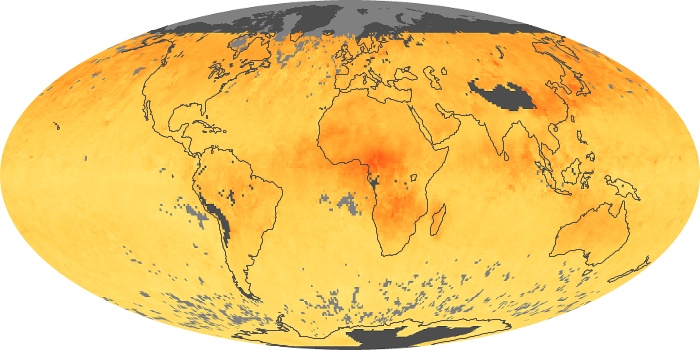
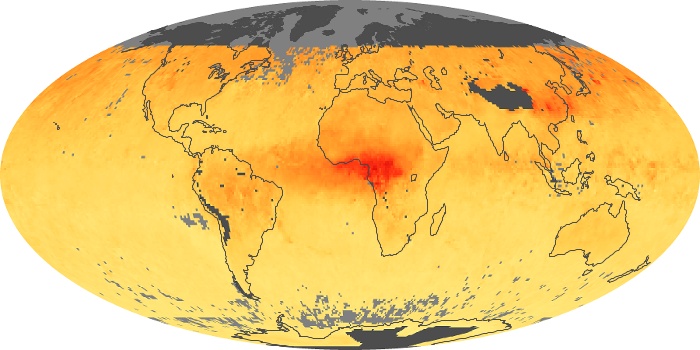
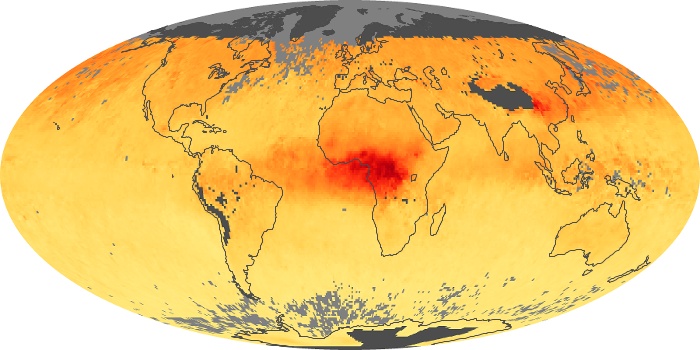
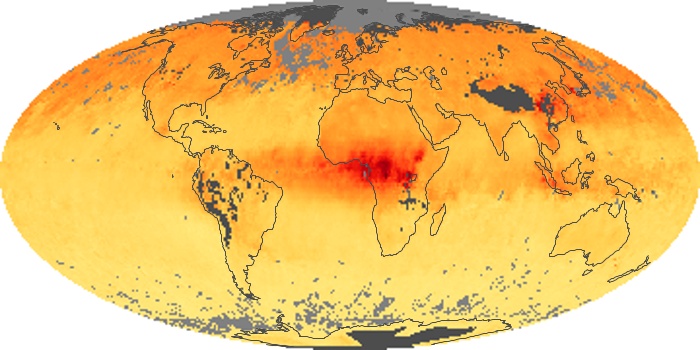
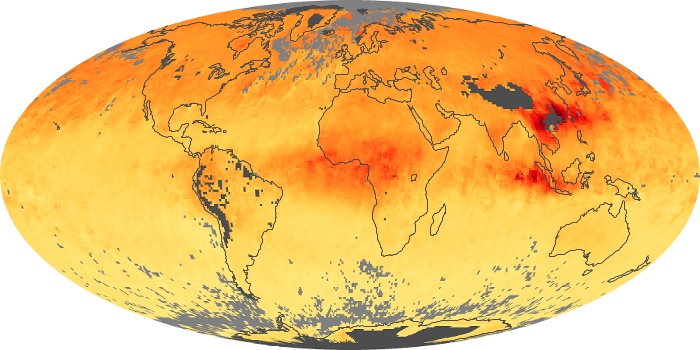
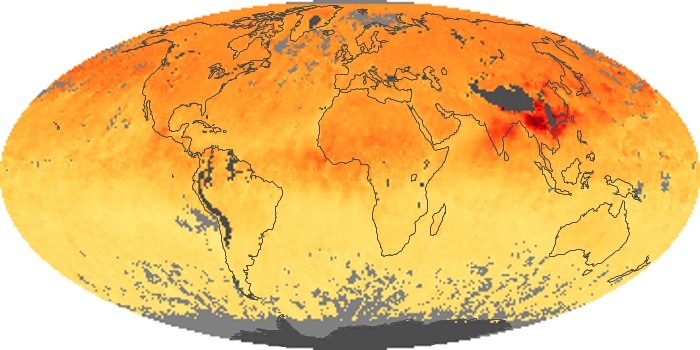
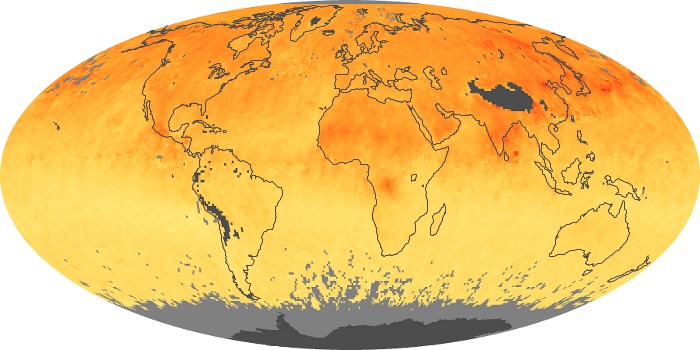
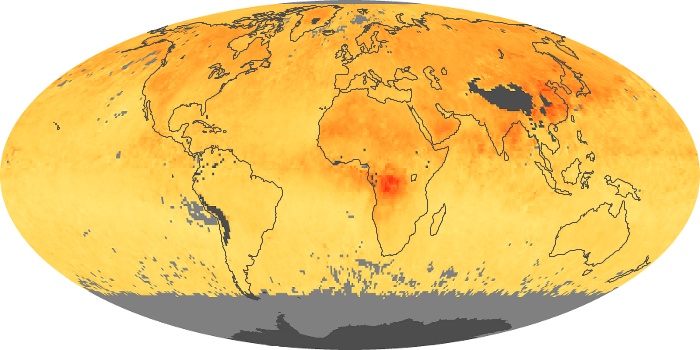
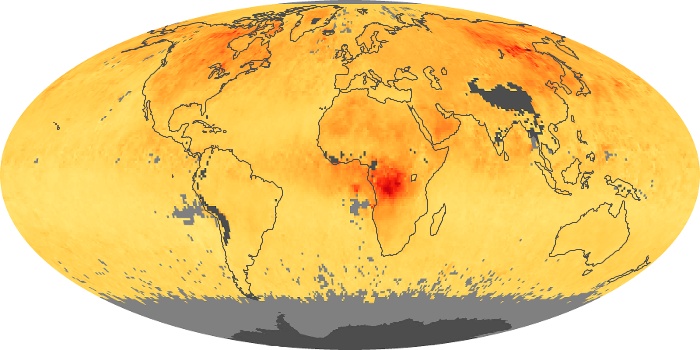
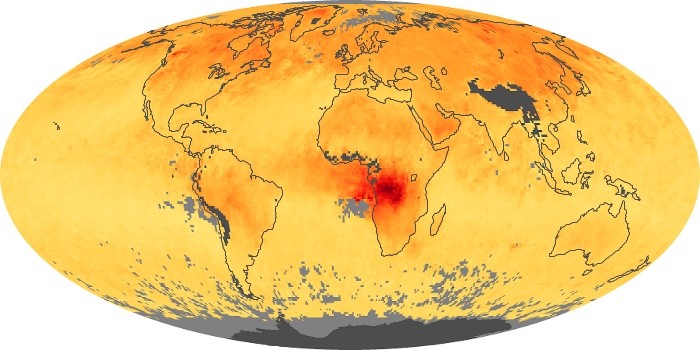
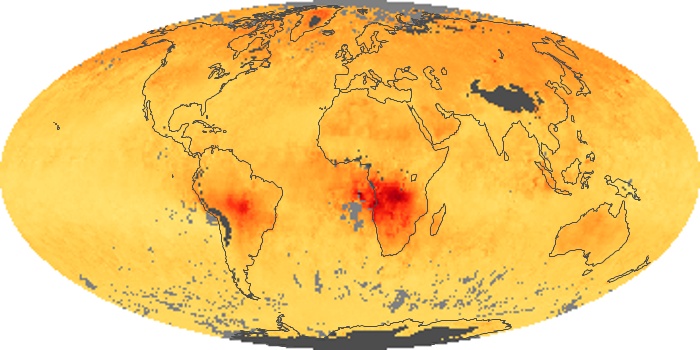
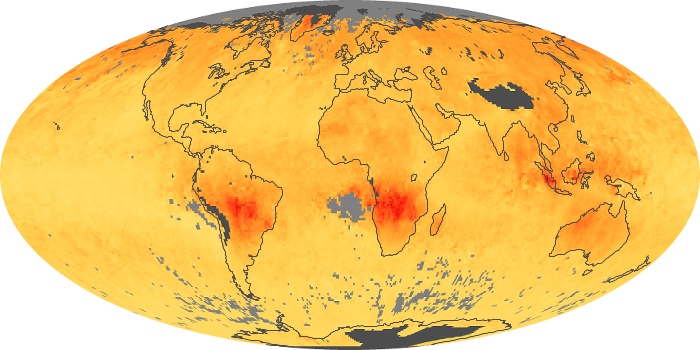
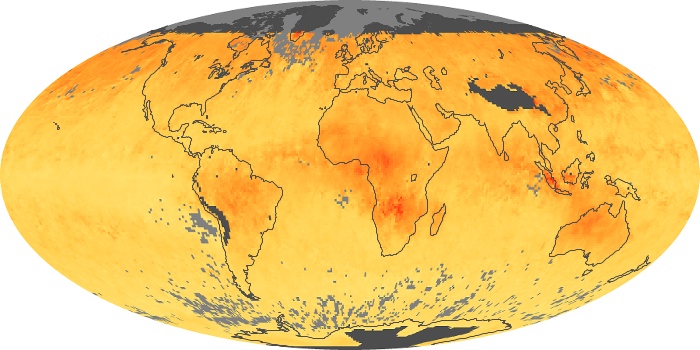
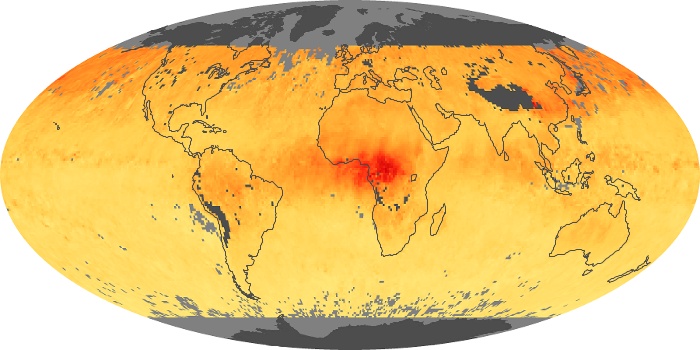
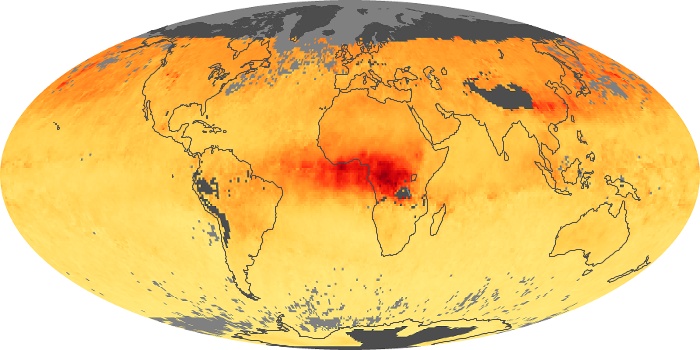
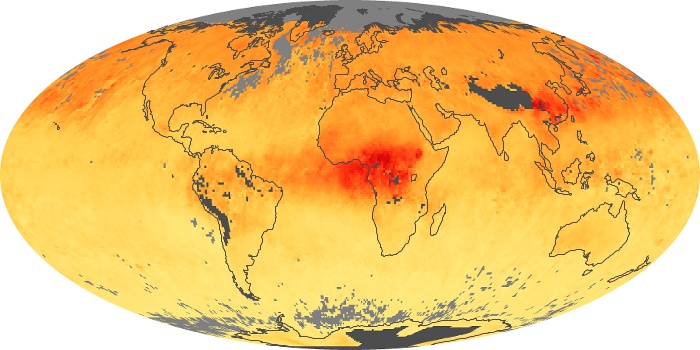
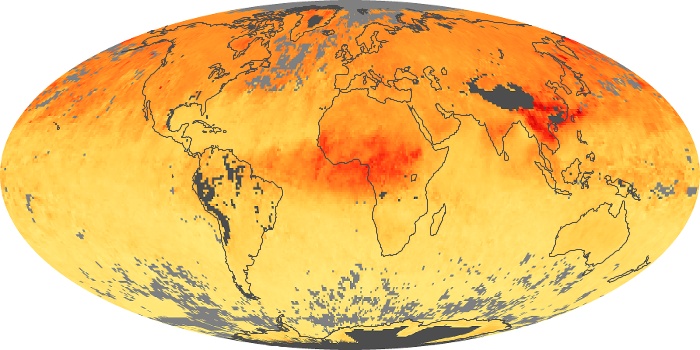
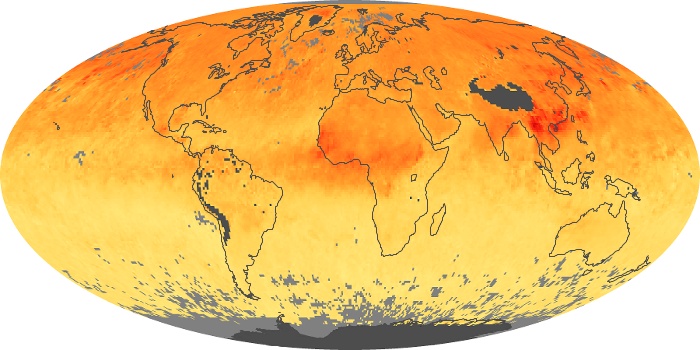
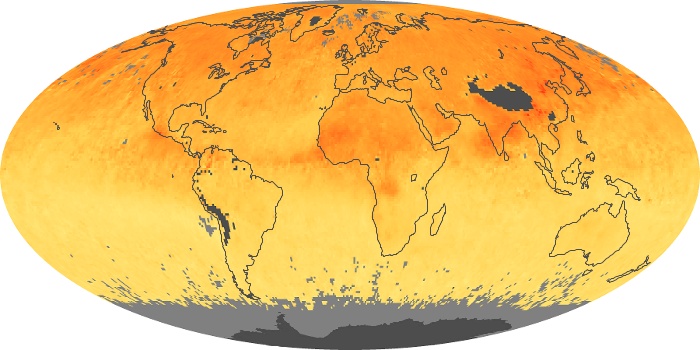
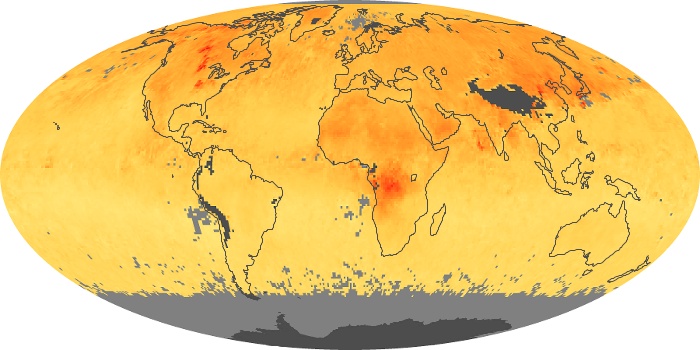
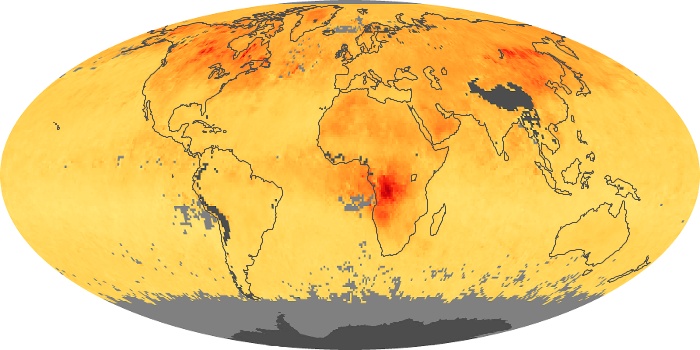
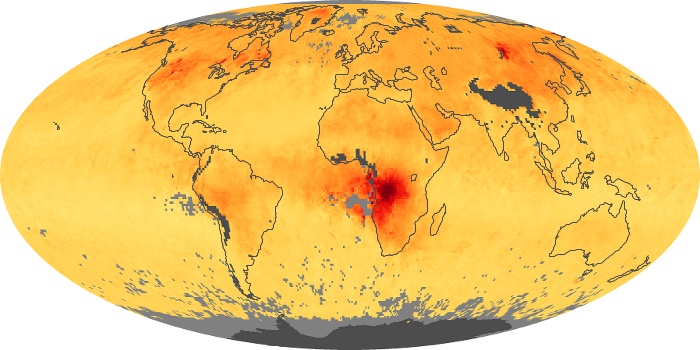
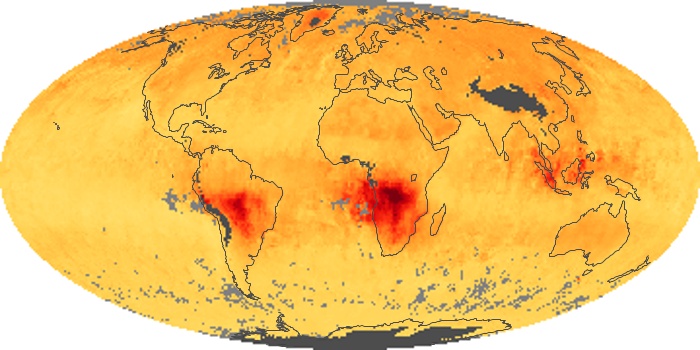
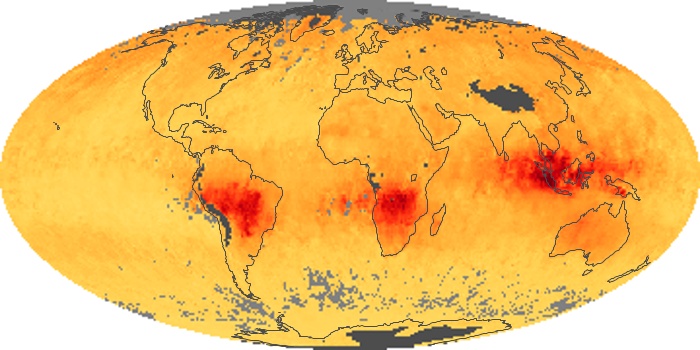
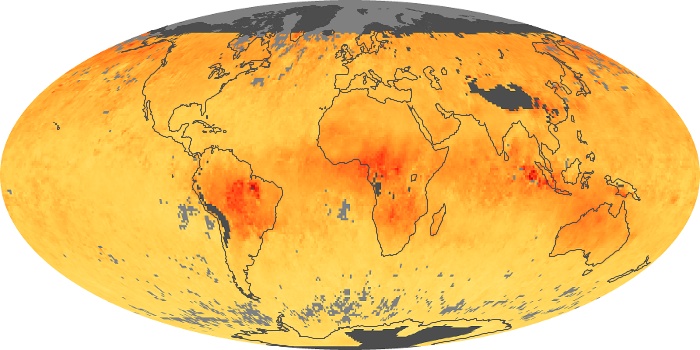
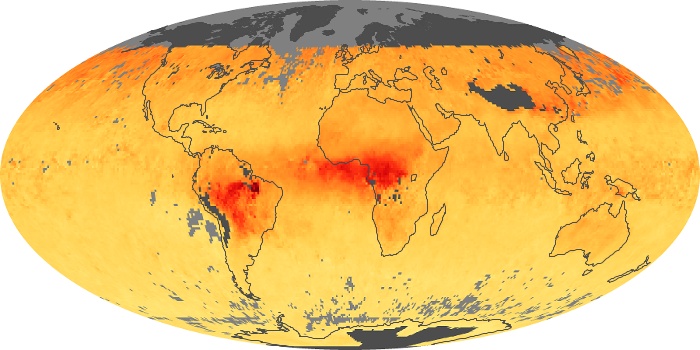
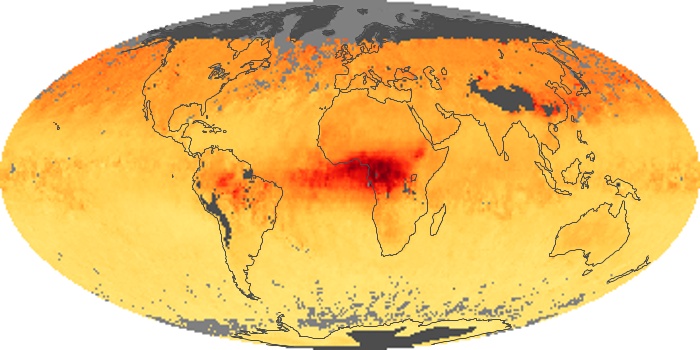
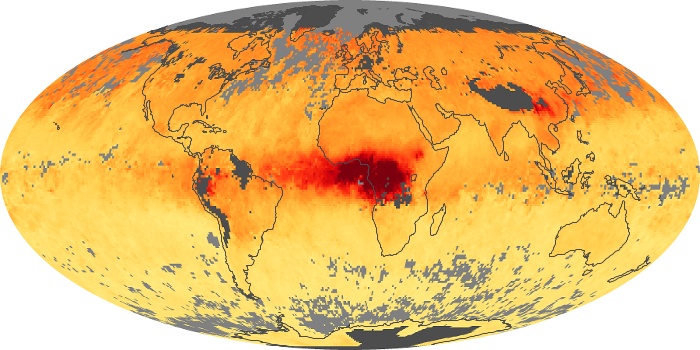
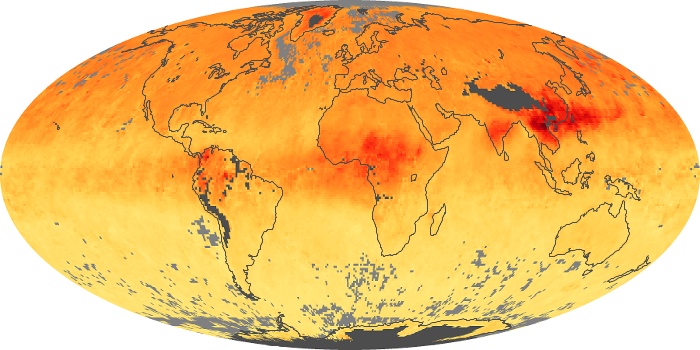
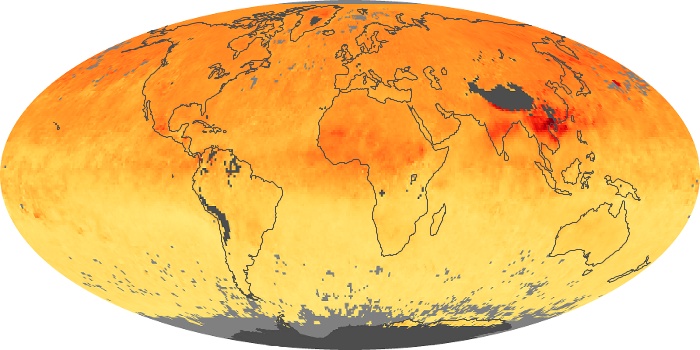
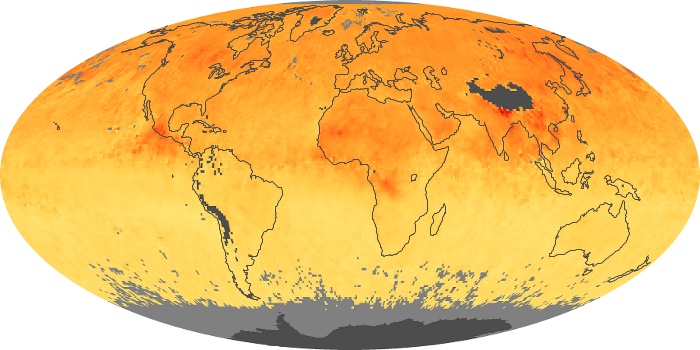
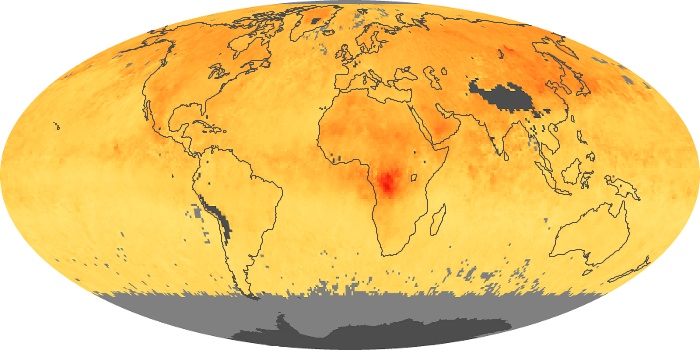
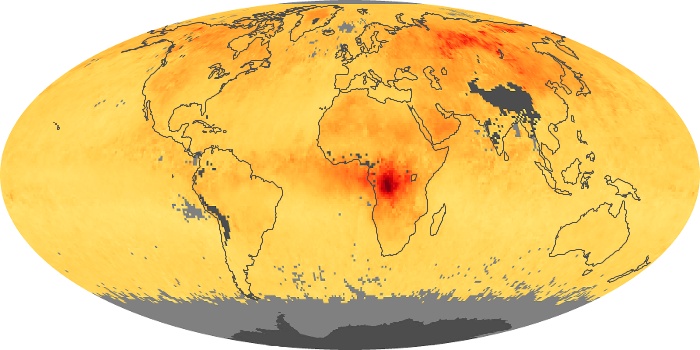
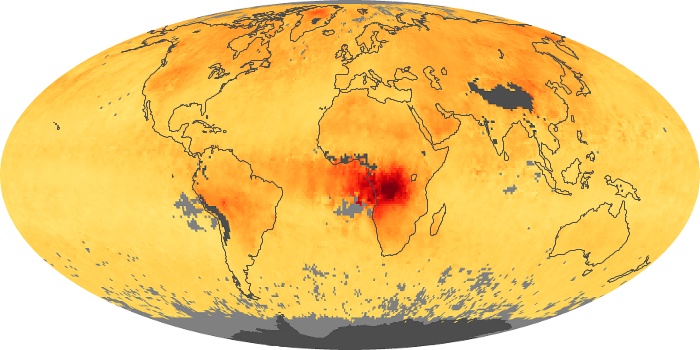
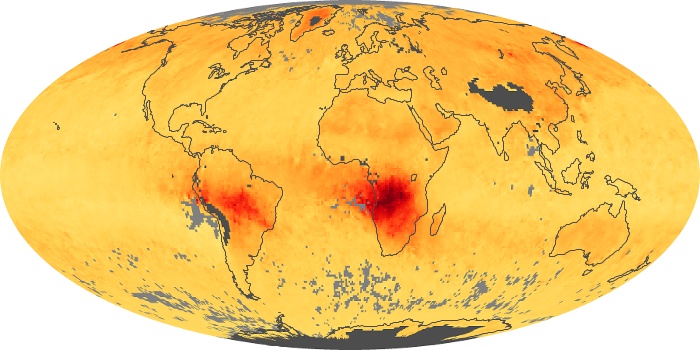
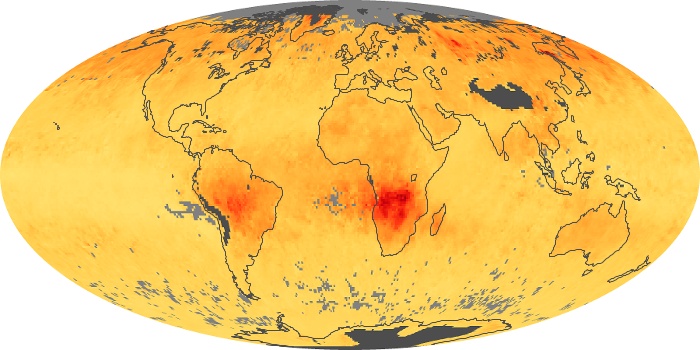
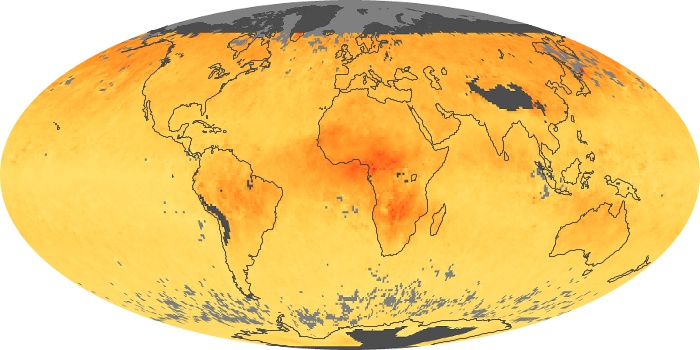
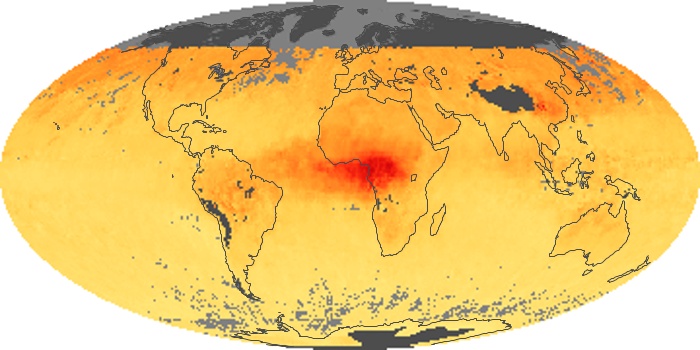
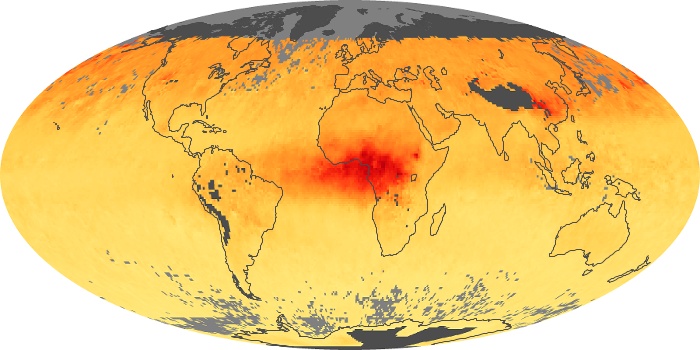
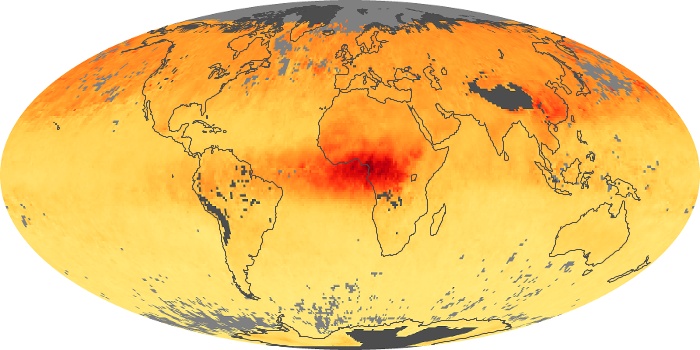
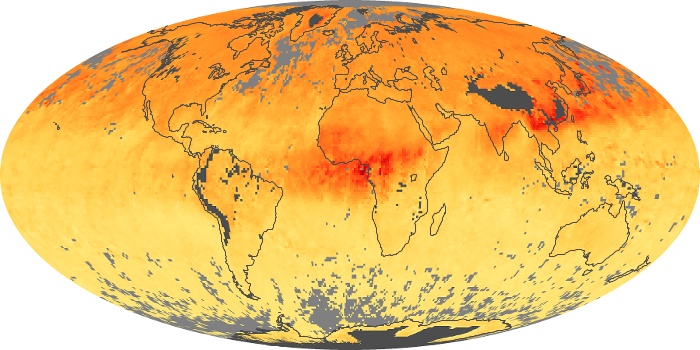
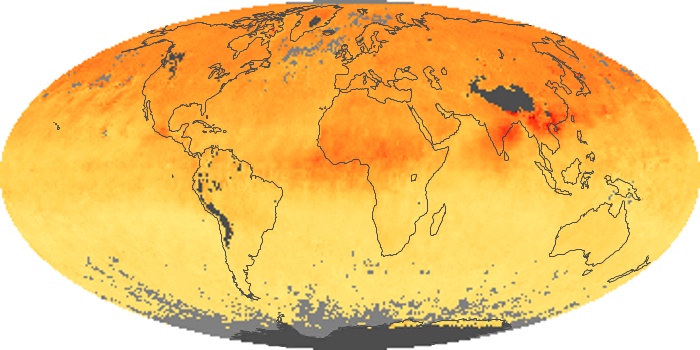
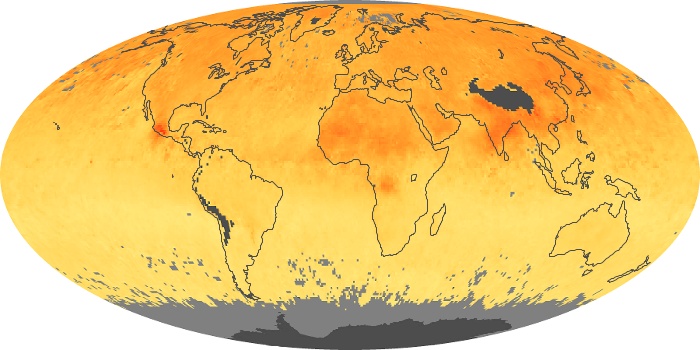
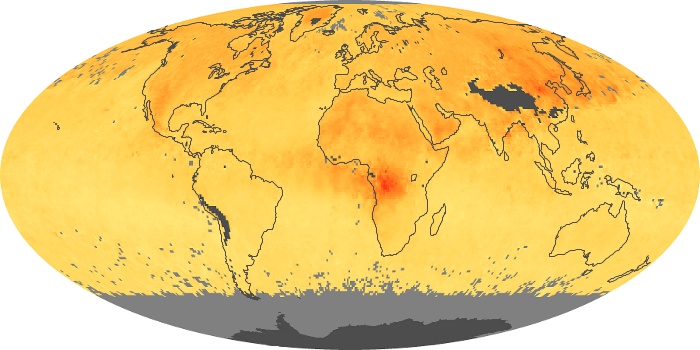
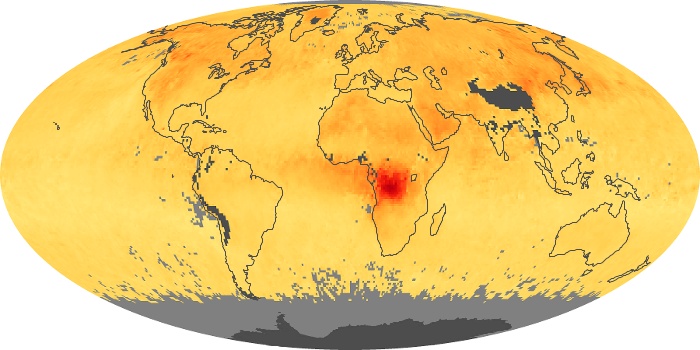
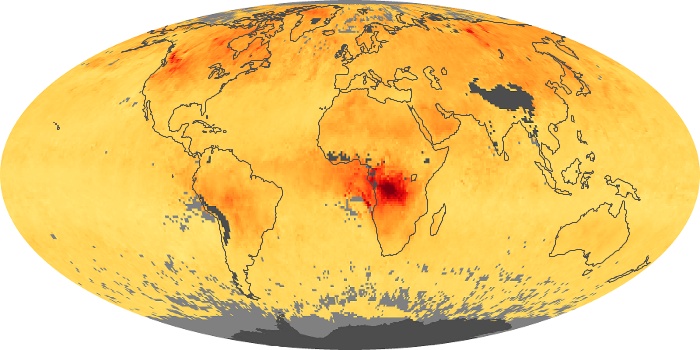
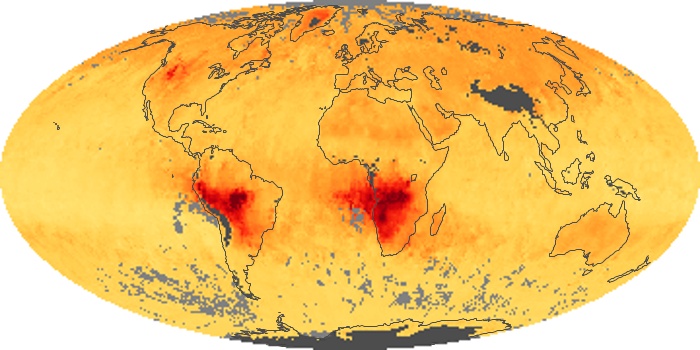
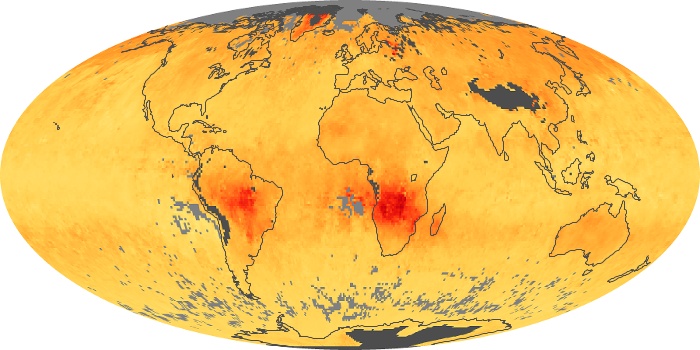
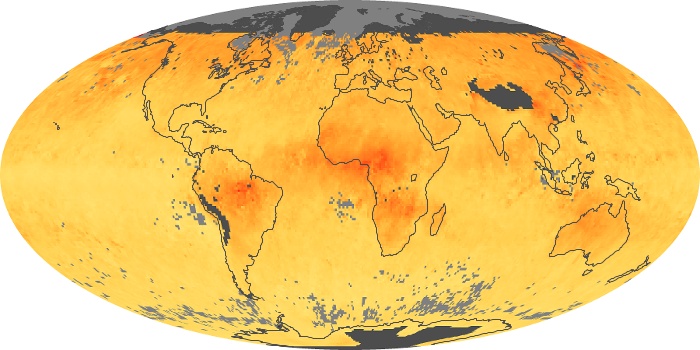
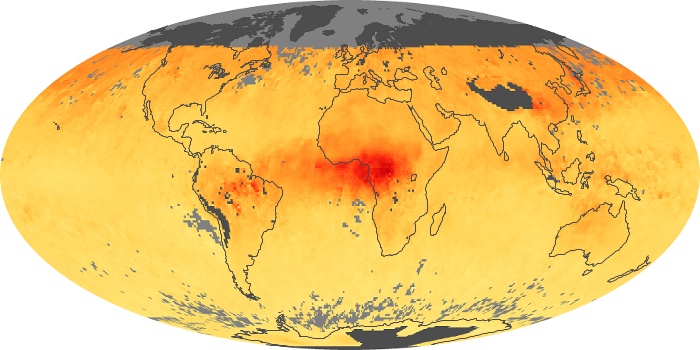
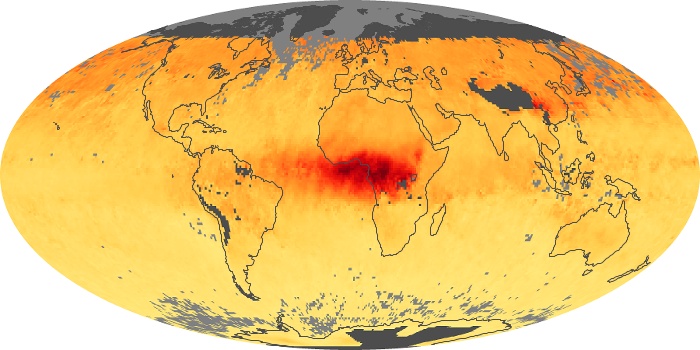
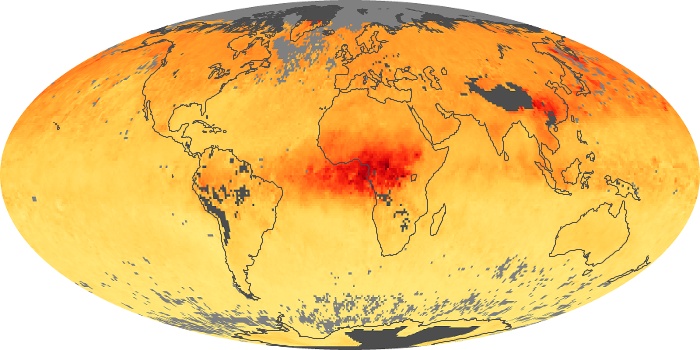
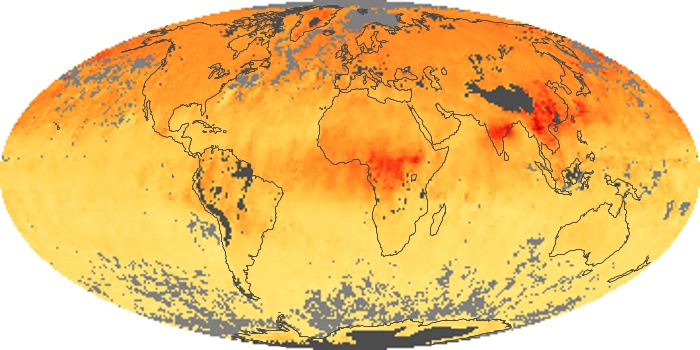
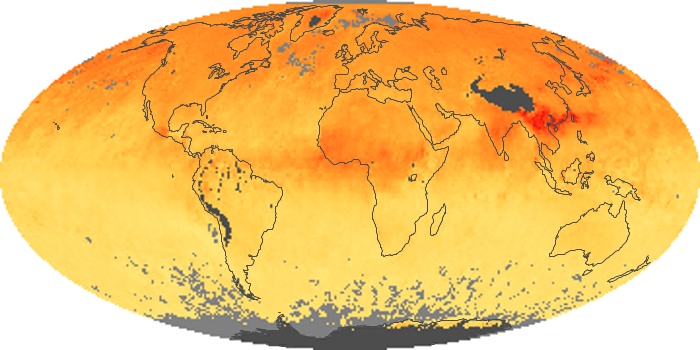
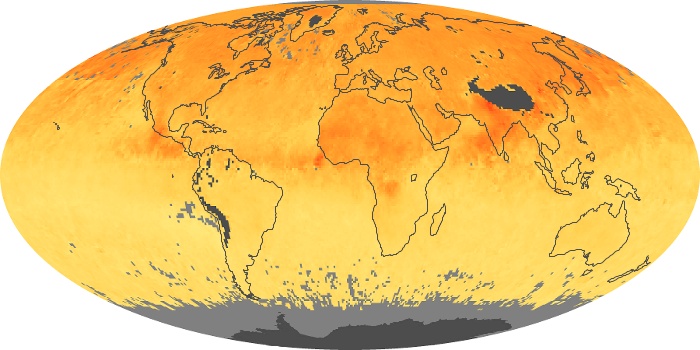
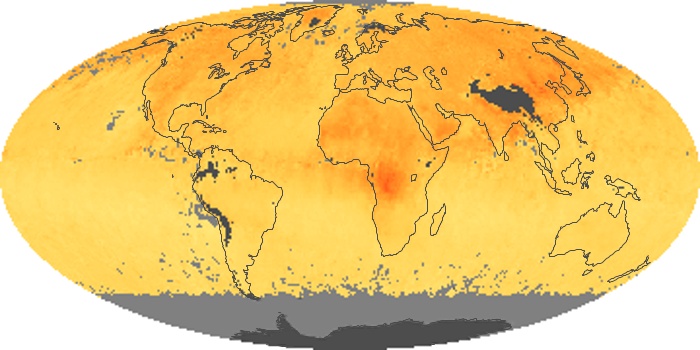
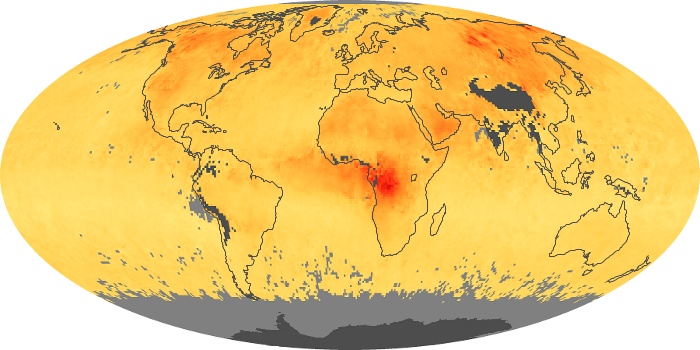
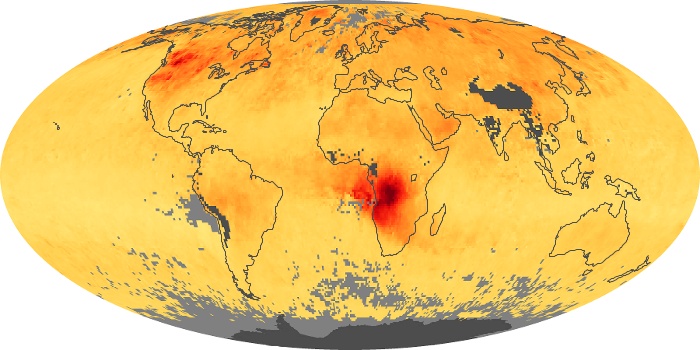
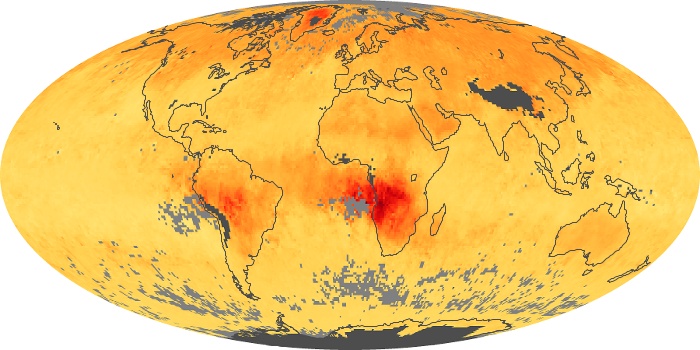
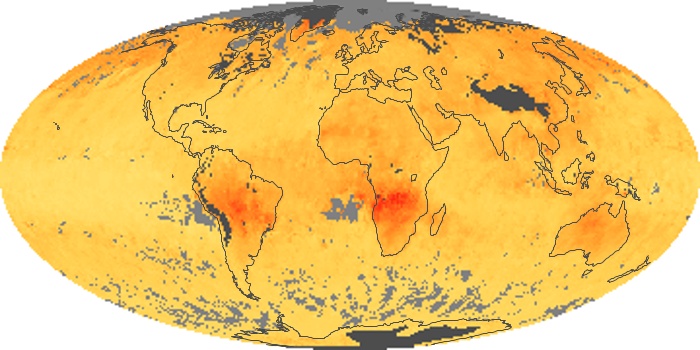
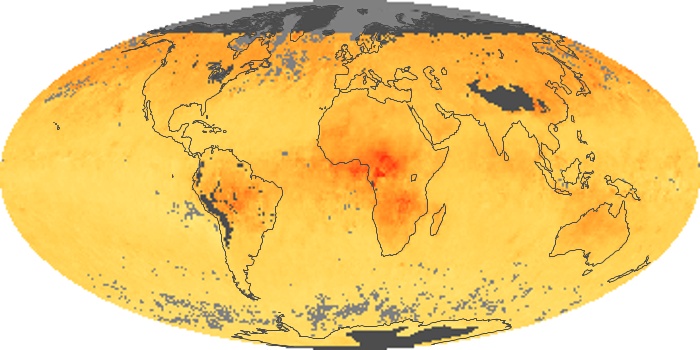
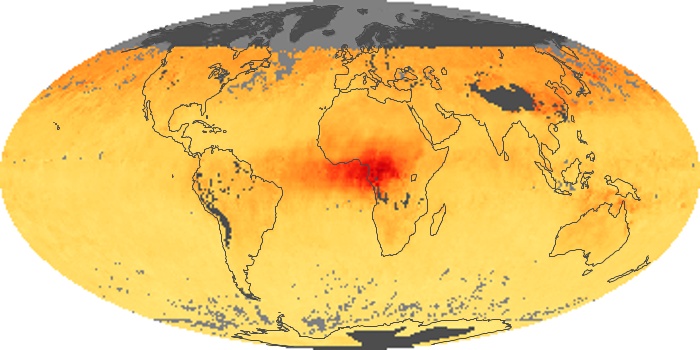
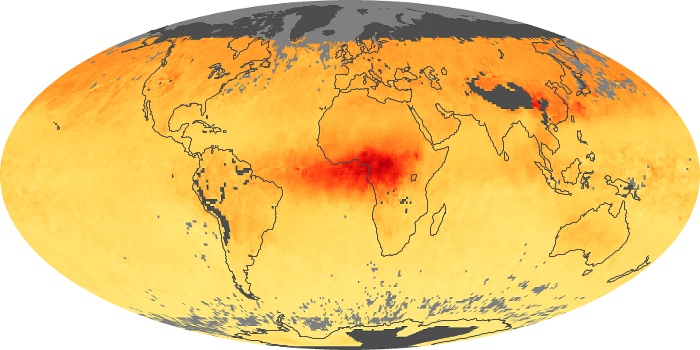
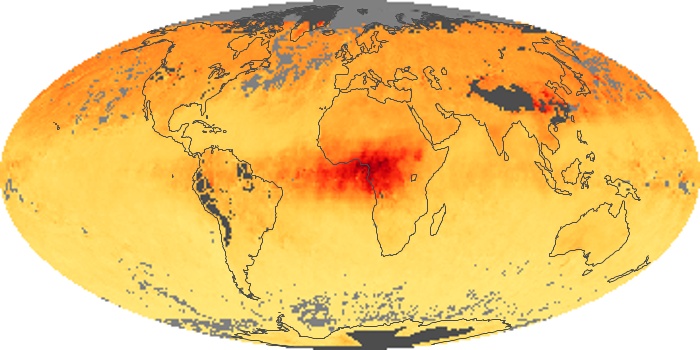
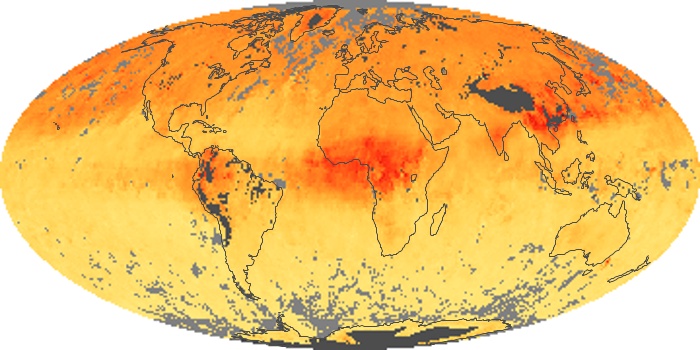
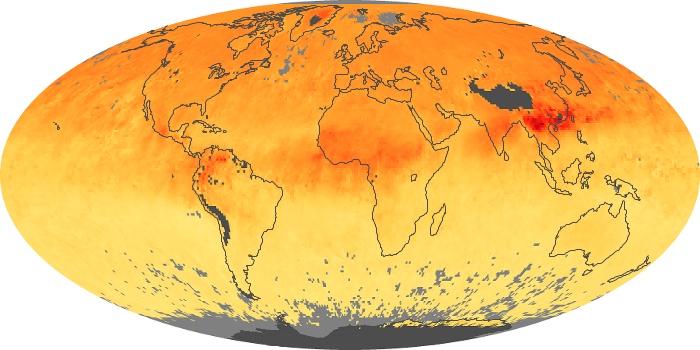
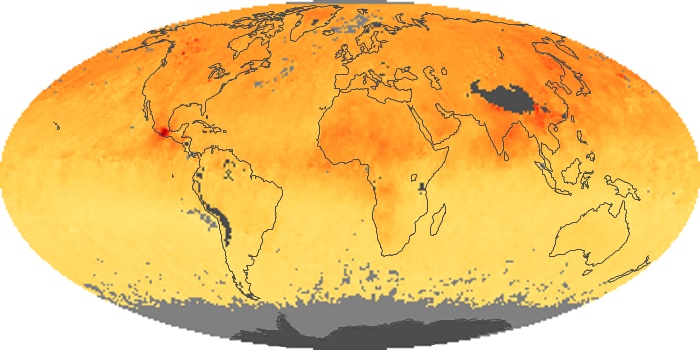
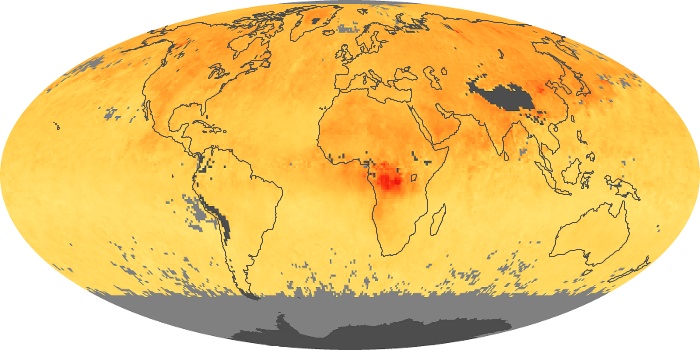
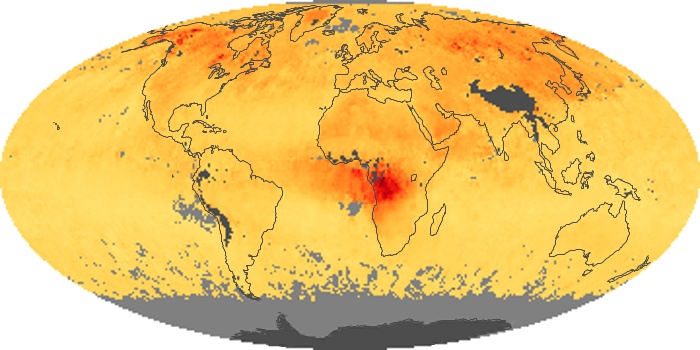
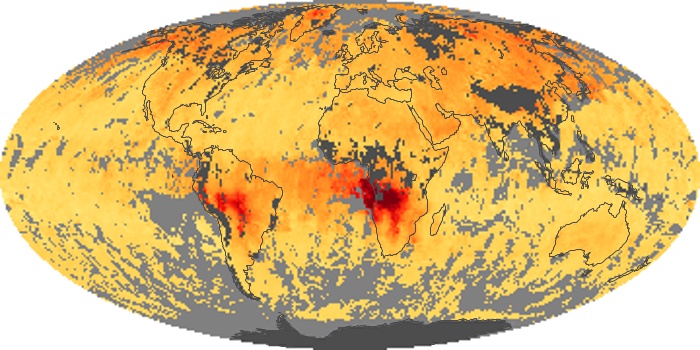
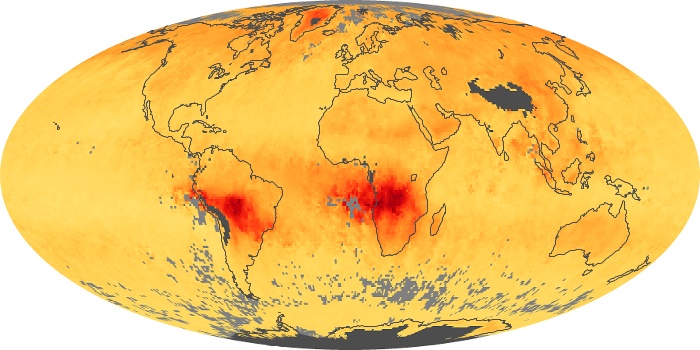
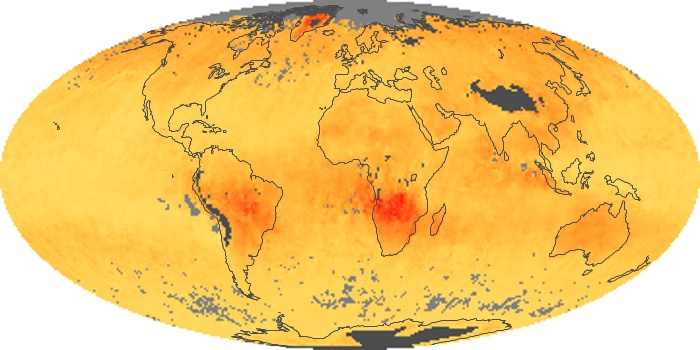
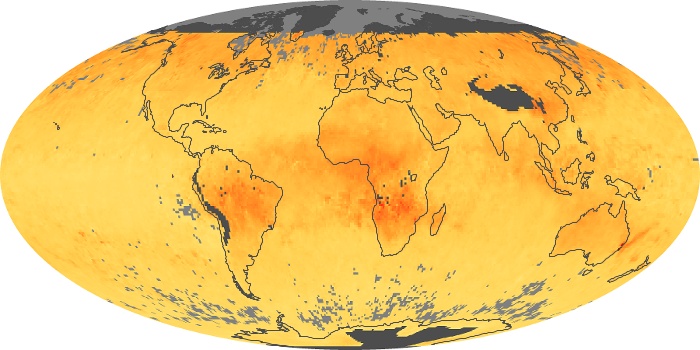
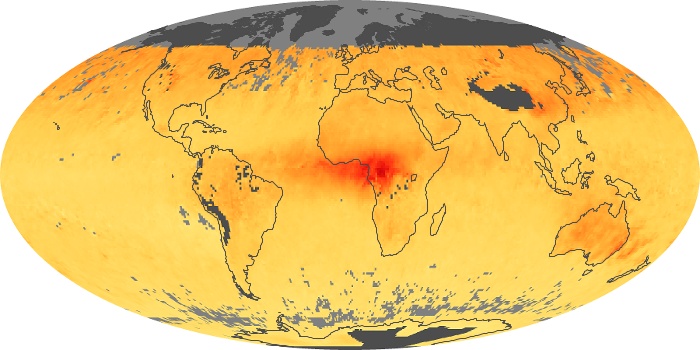
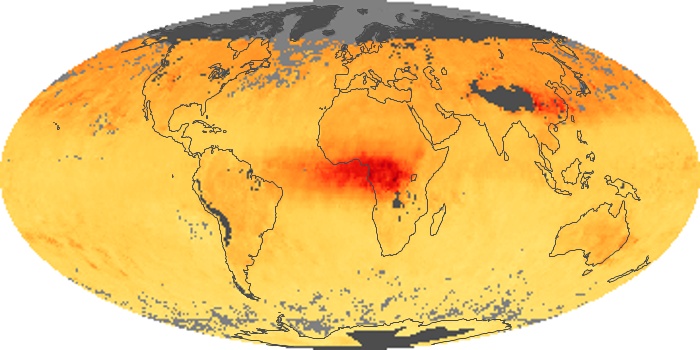
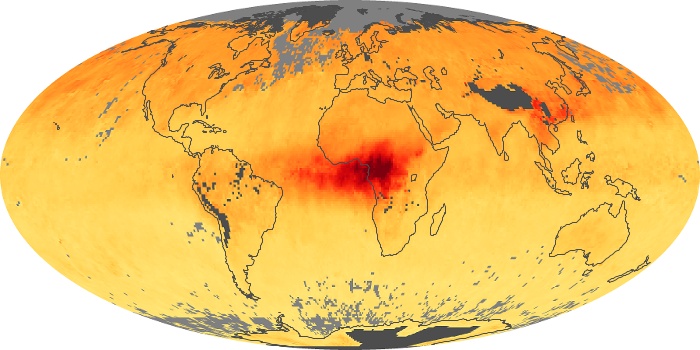
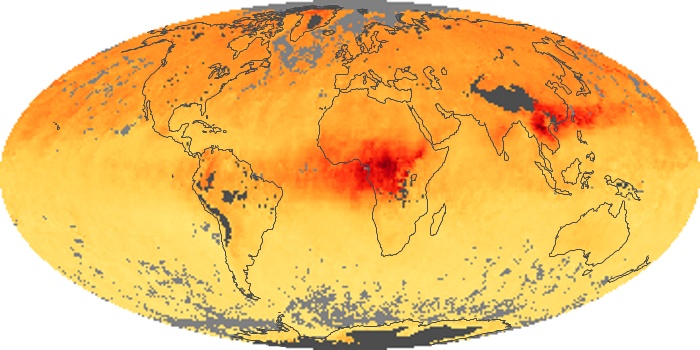
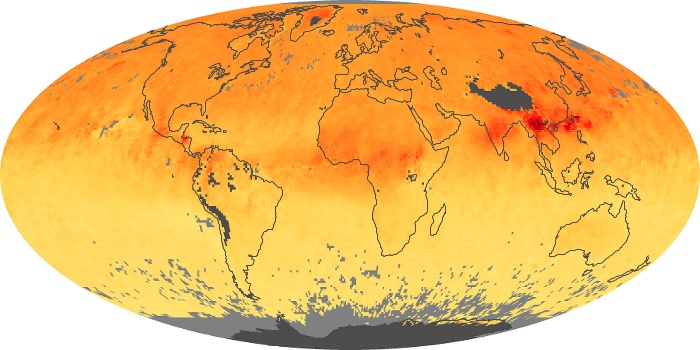
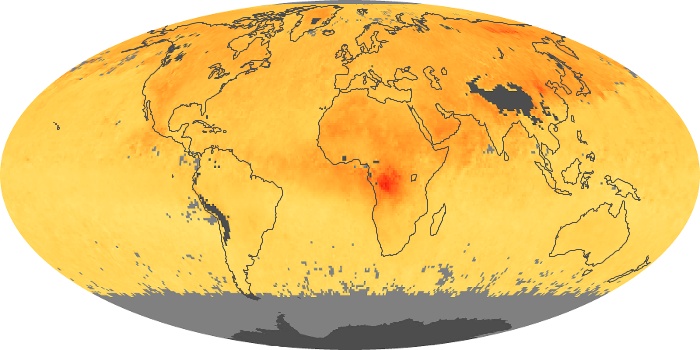
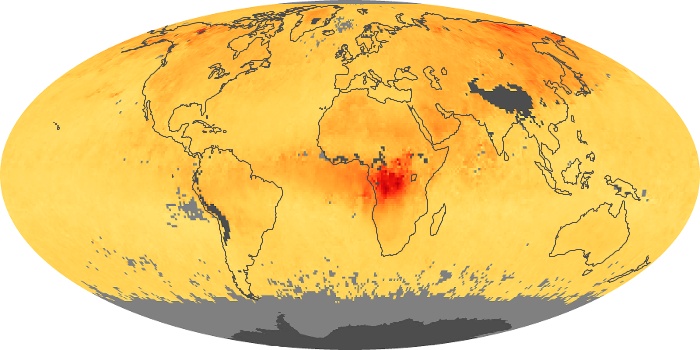
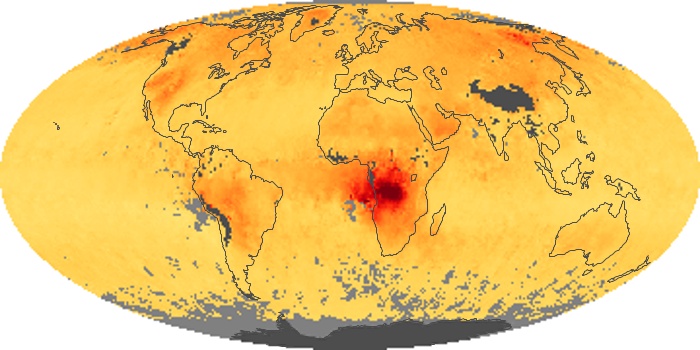
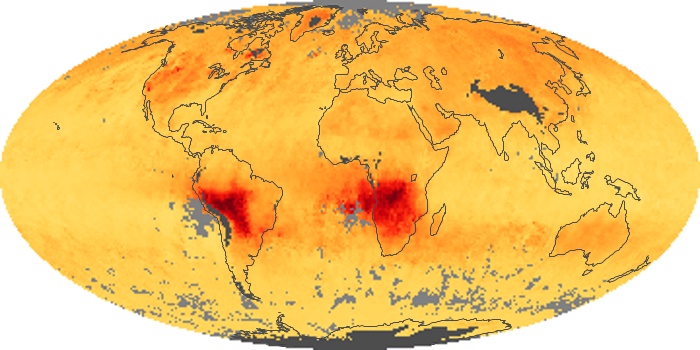
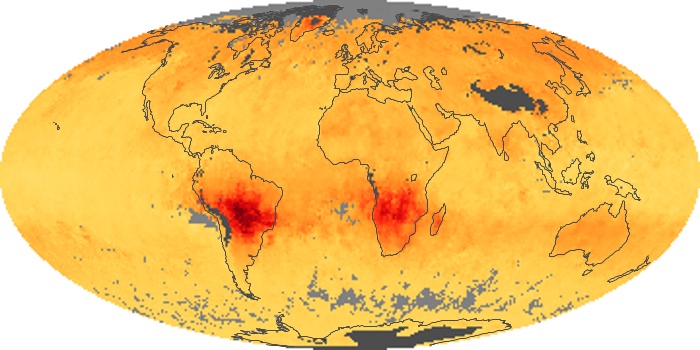
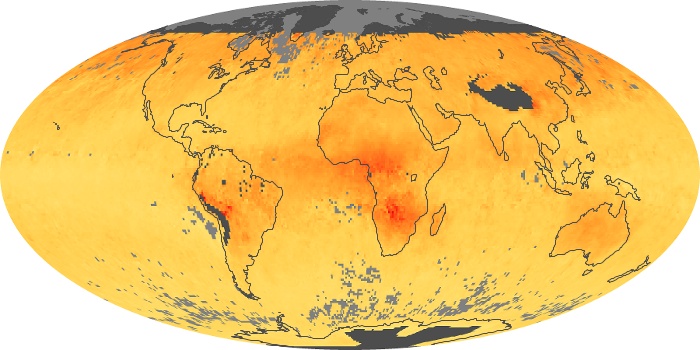
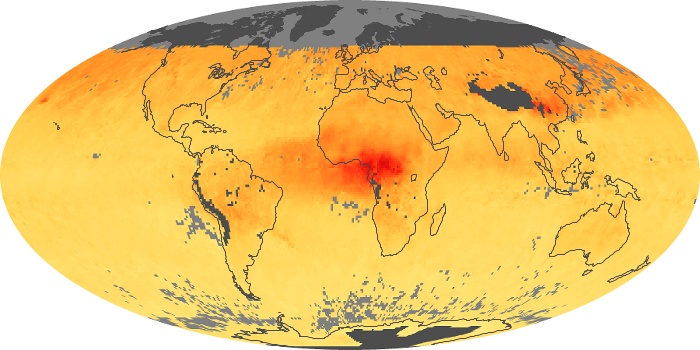
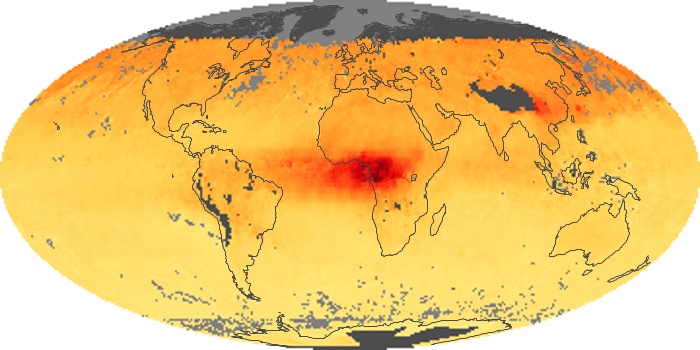
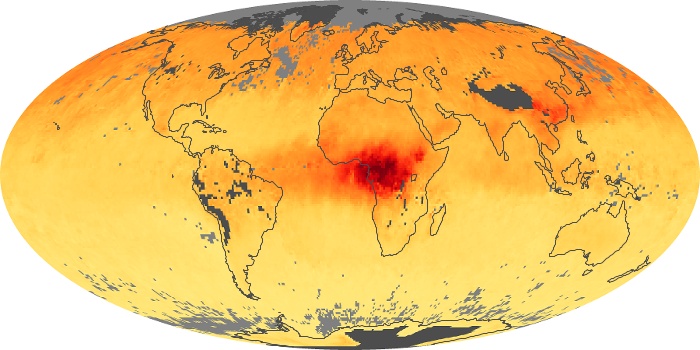
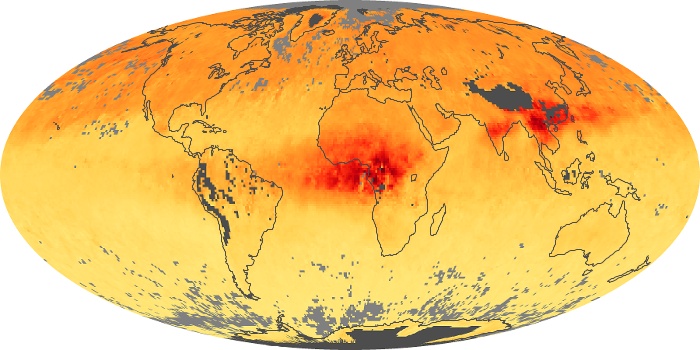
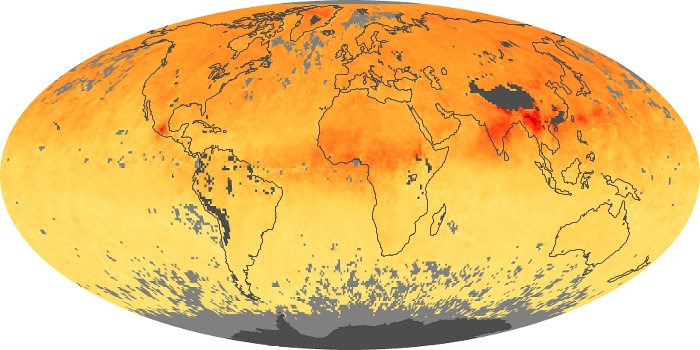
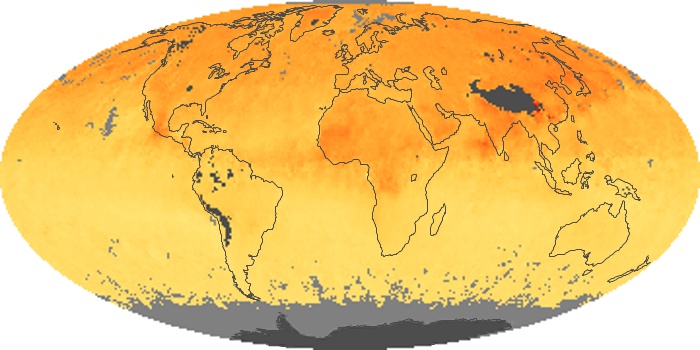
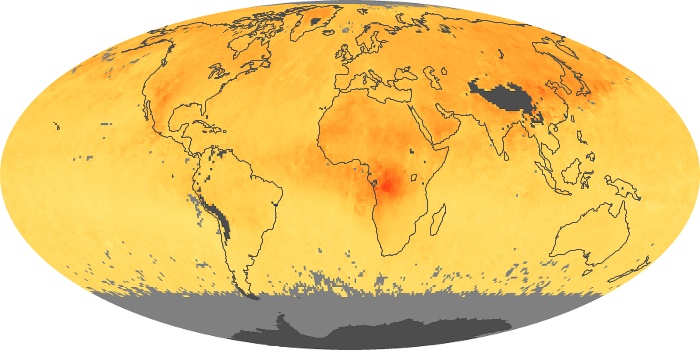
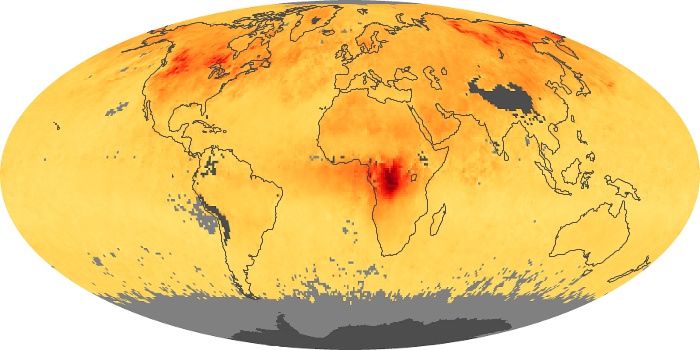
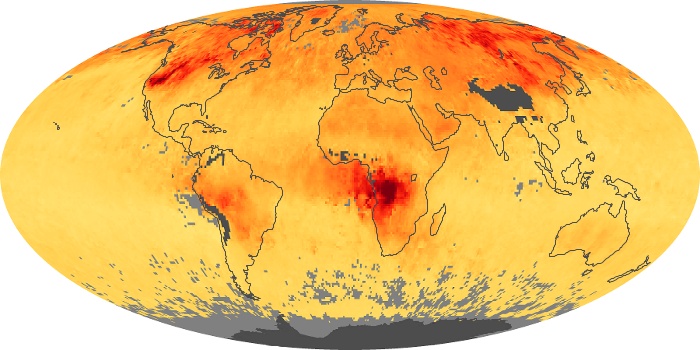
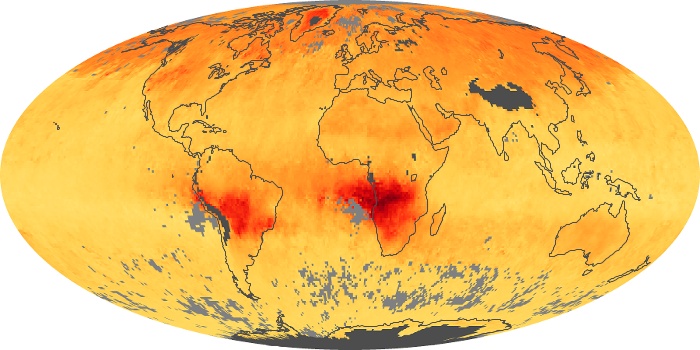
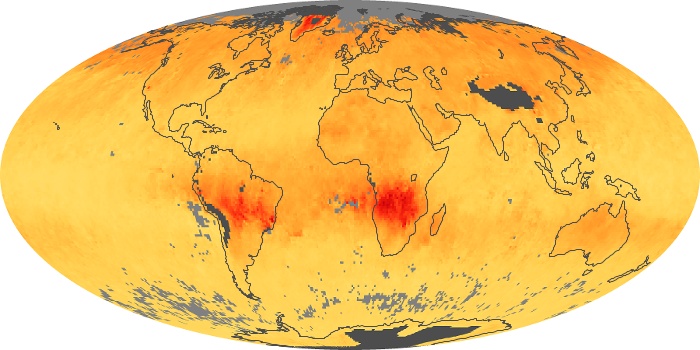
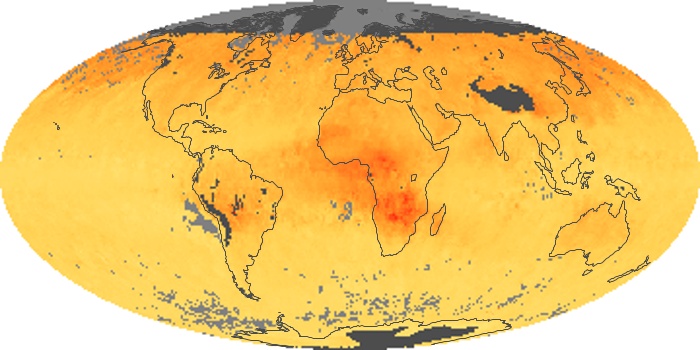
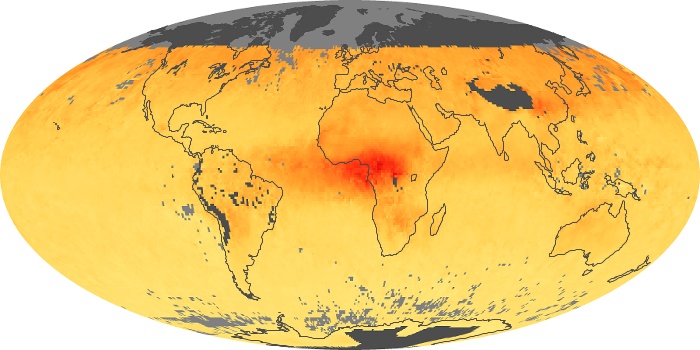
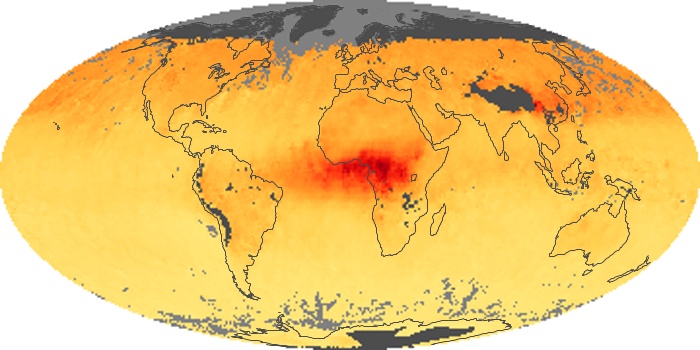
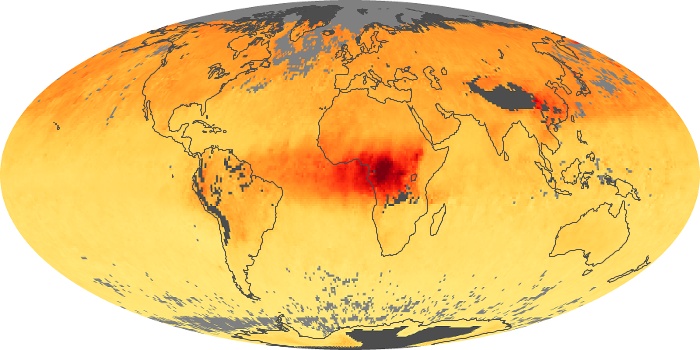
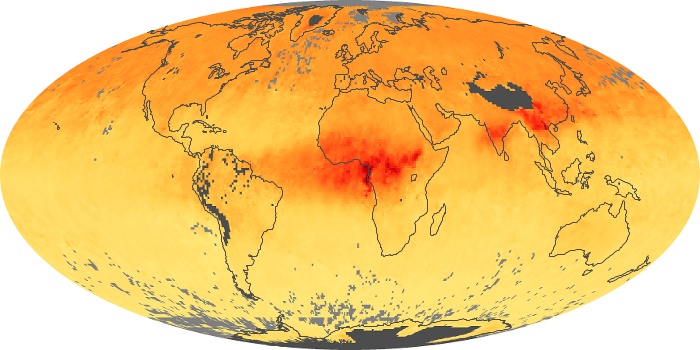
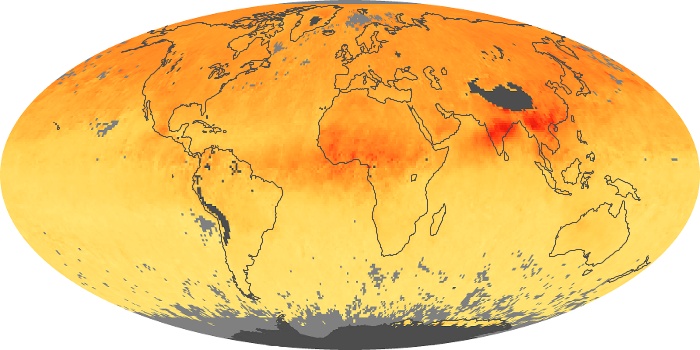
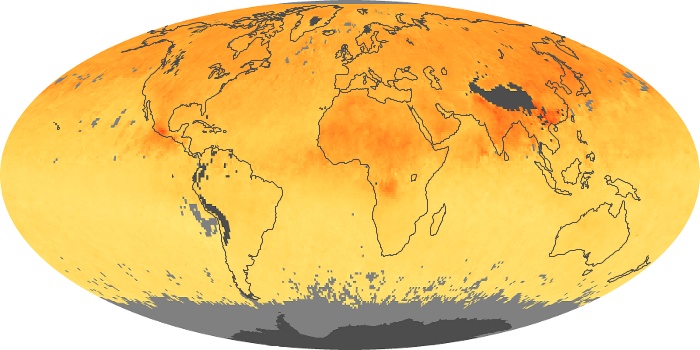
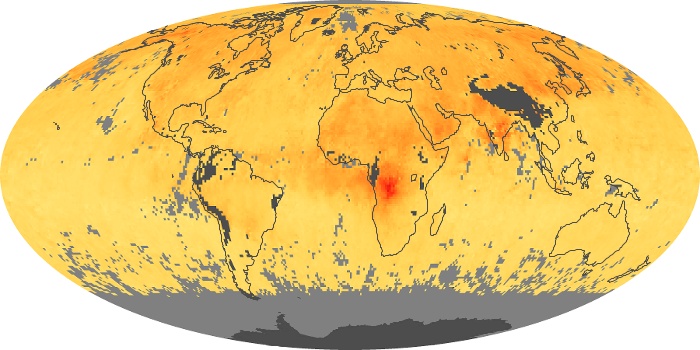
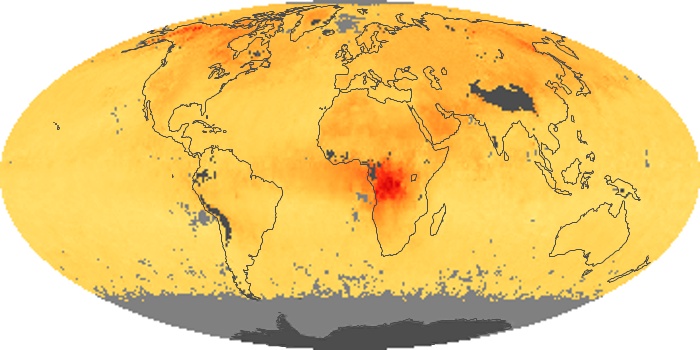
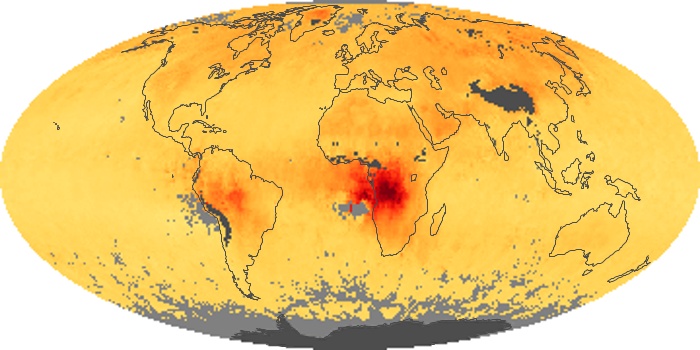
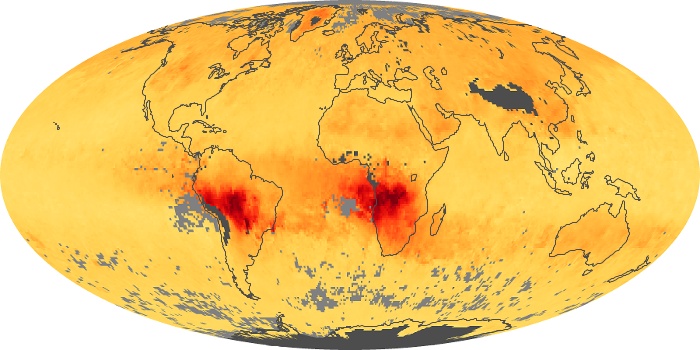
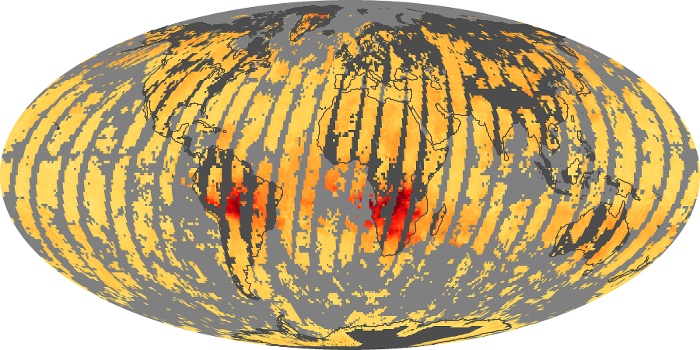
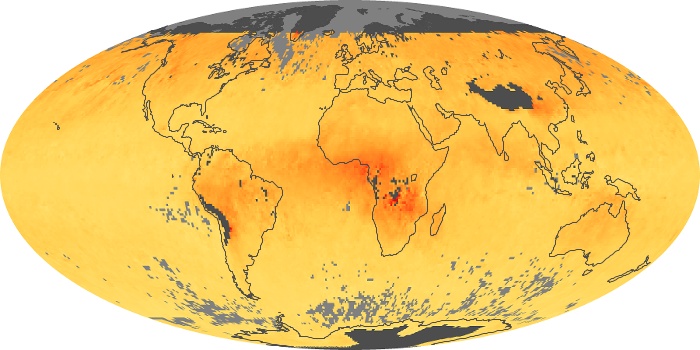
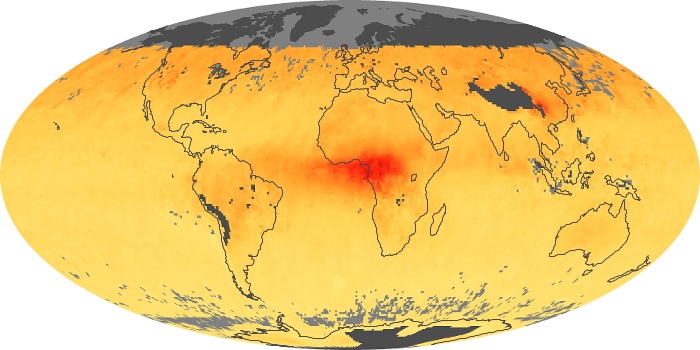
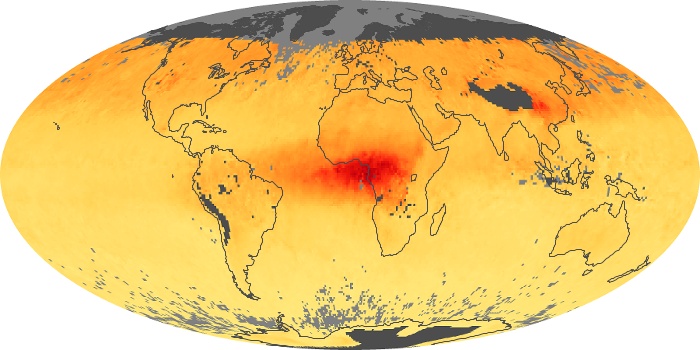
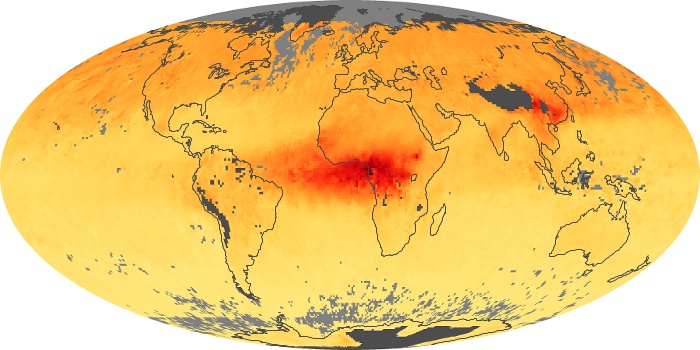
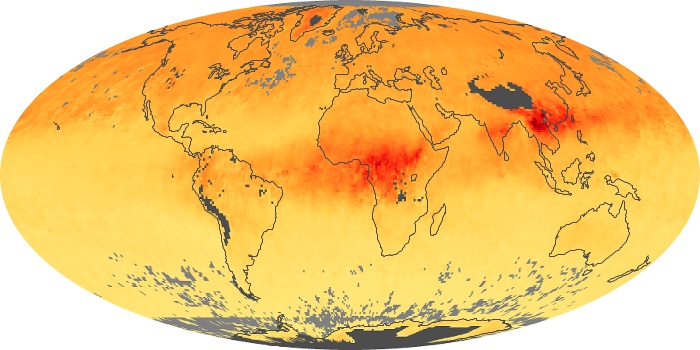
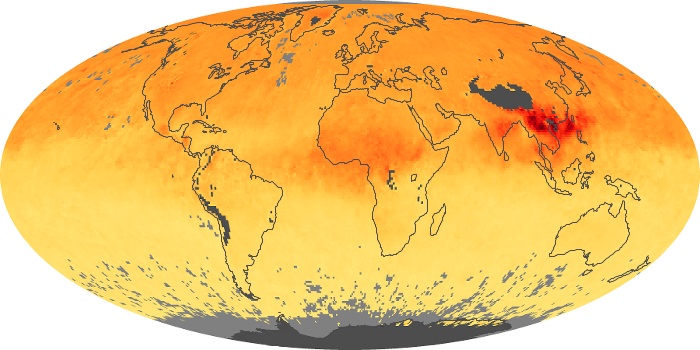
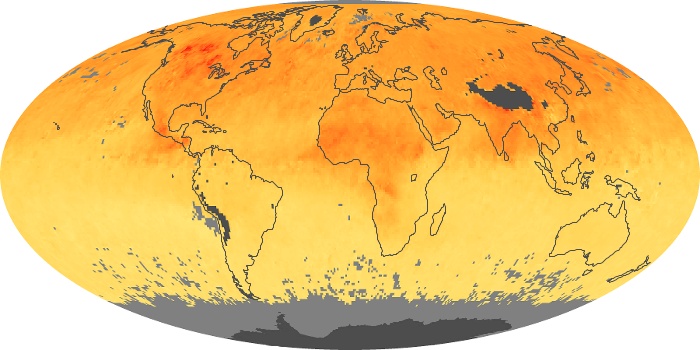
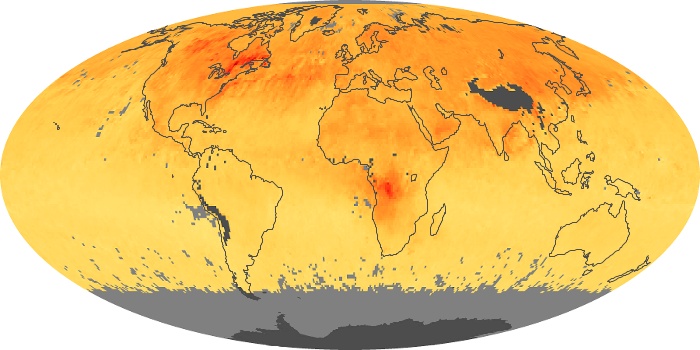
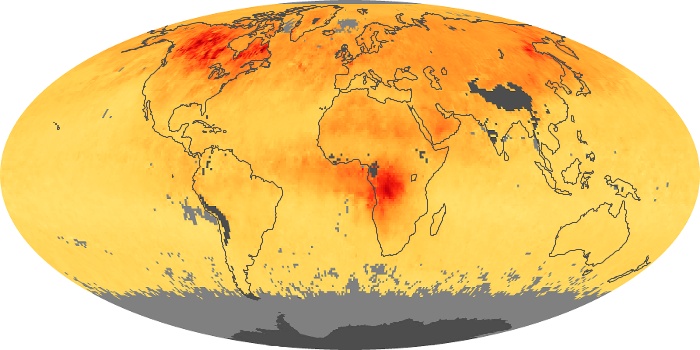
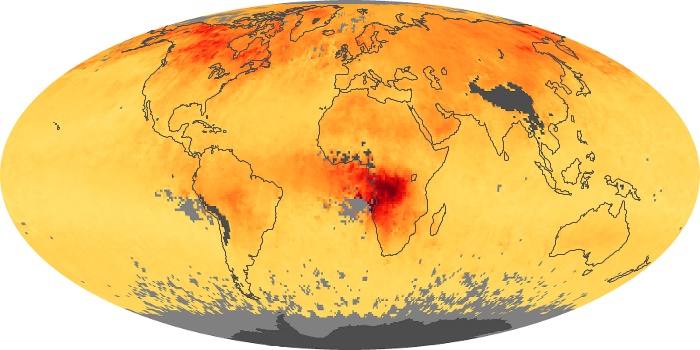
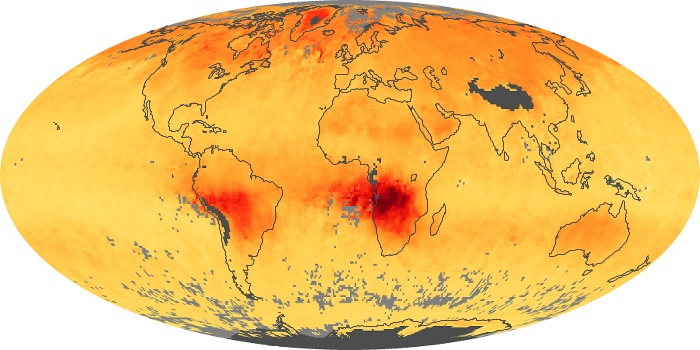
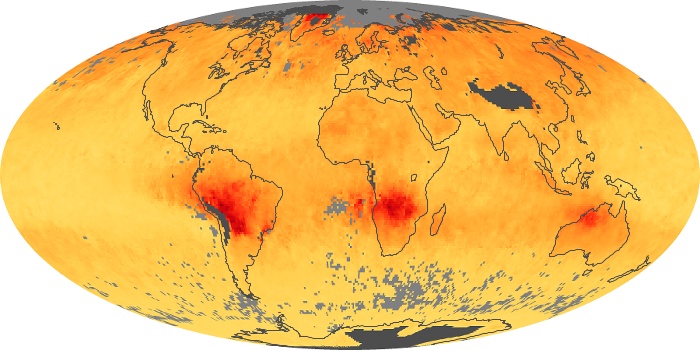
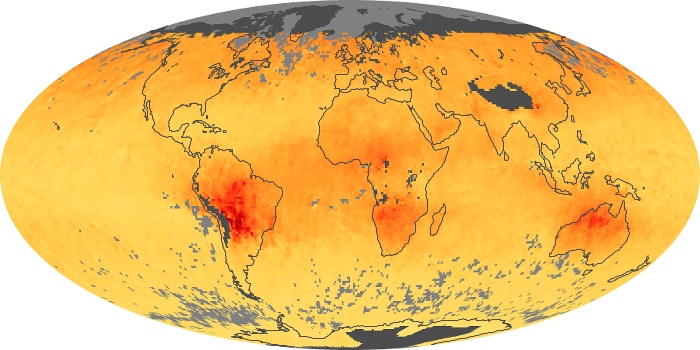
The carbon monoxide maps show the monthly averages of carbon monoxide at an altitude of about 12,000 feet, based on data from the MOPITT sensor on NASA’s Terra satellite. Concentrations of carbon monoxide are expressed in parts per billion by volume (ppbv). A concentration of 1 ppbv means that for every billion molecules of gas in the measured volume, one of them is a carbon monoxide molecule. Yellow areas have little or no carbon monoxide, while progressively higher concentrations are shown in orange and red.
View, download, or analyze more of these data from NASA Earth Observations (NEO):
Cloud Fraction
Carbon Monoxide