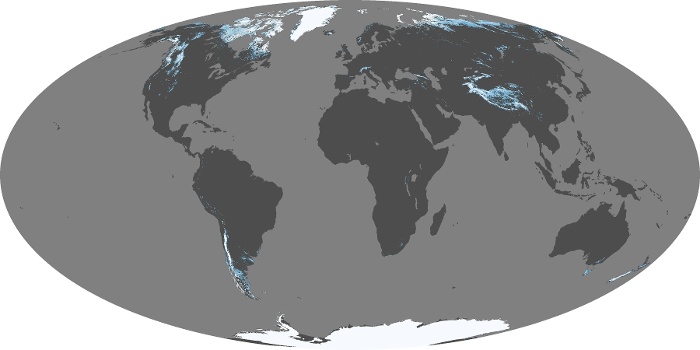
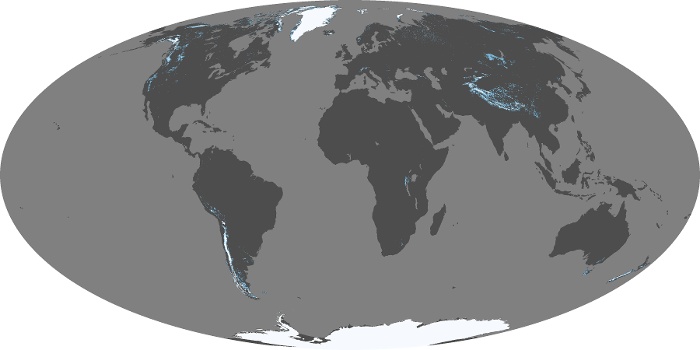

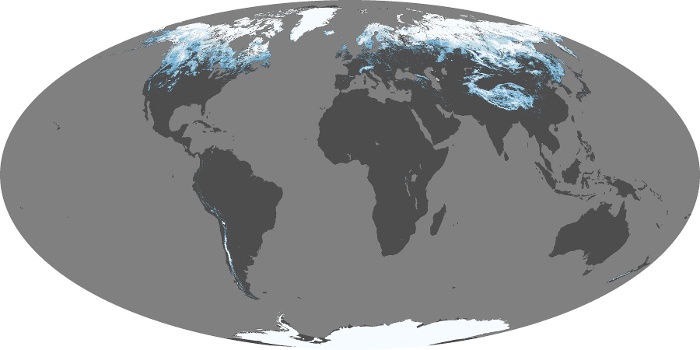

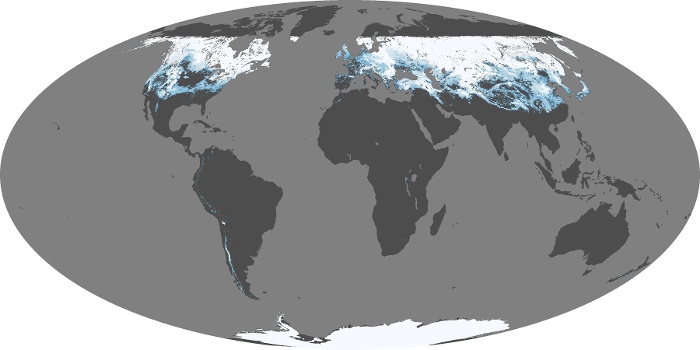

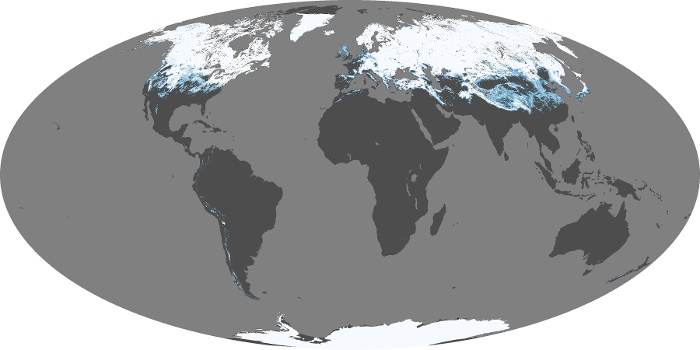
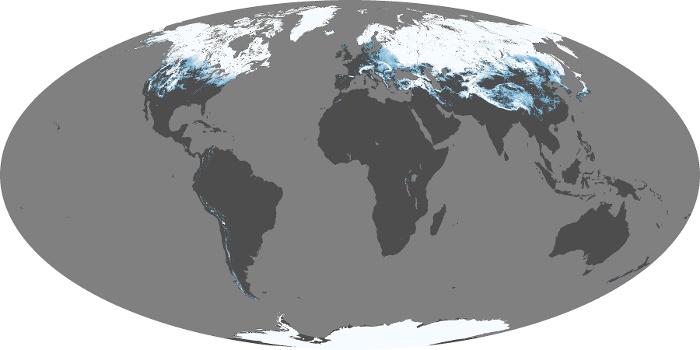
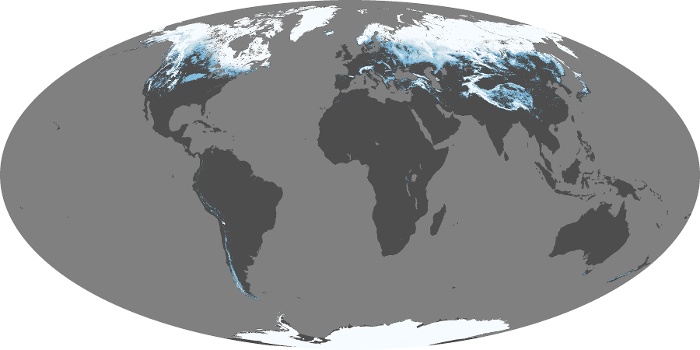
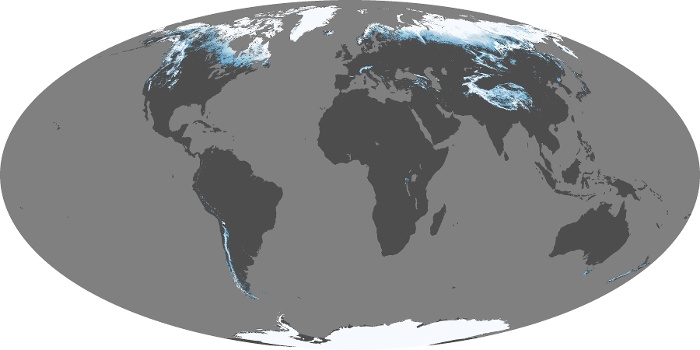
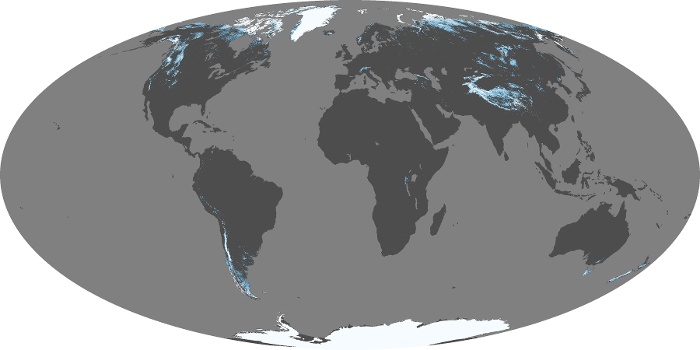
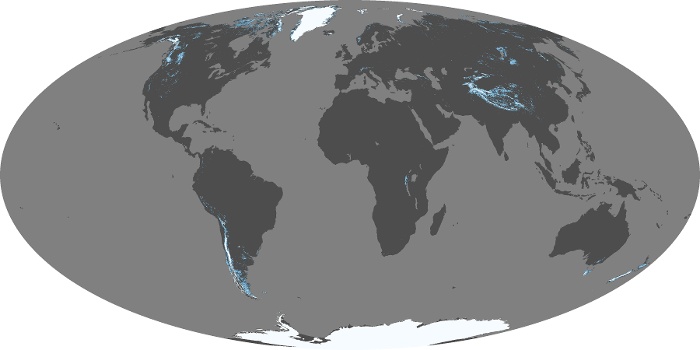
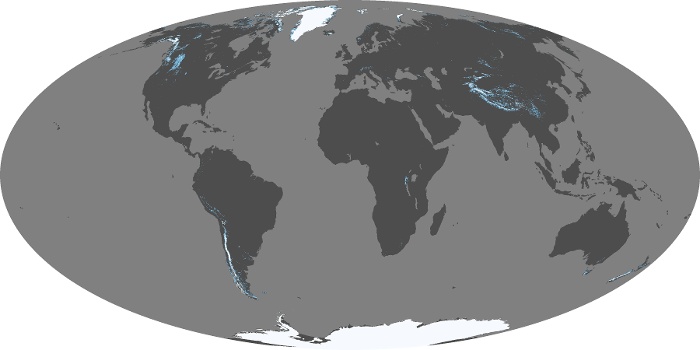
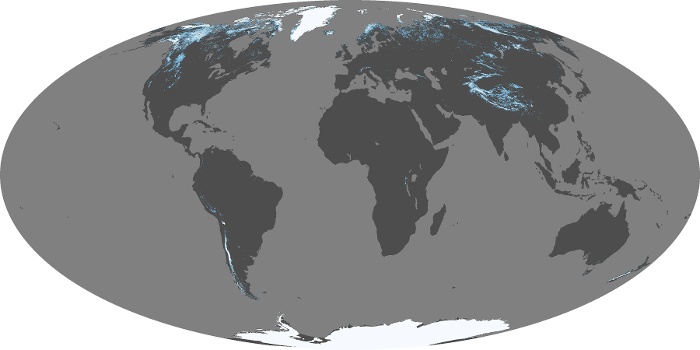

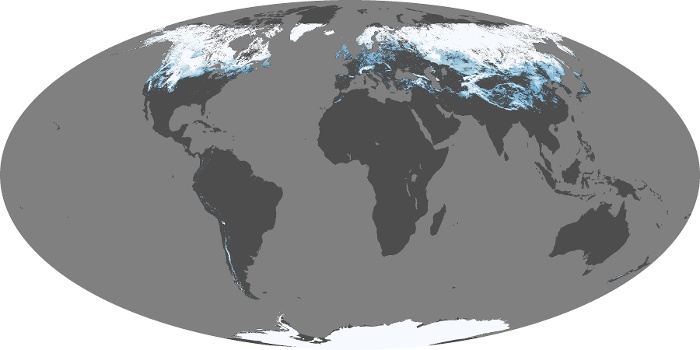
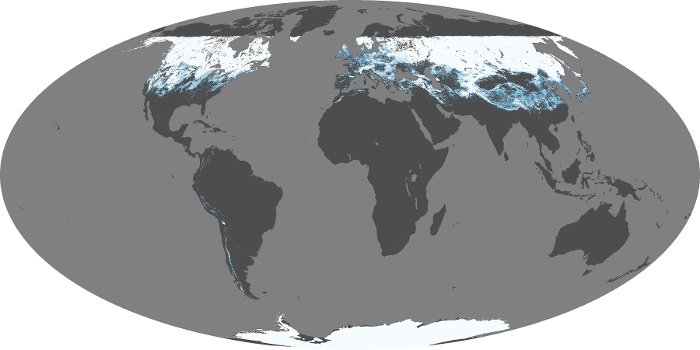

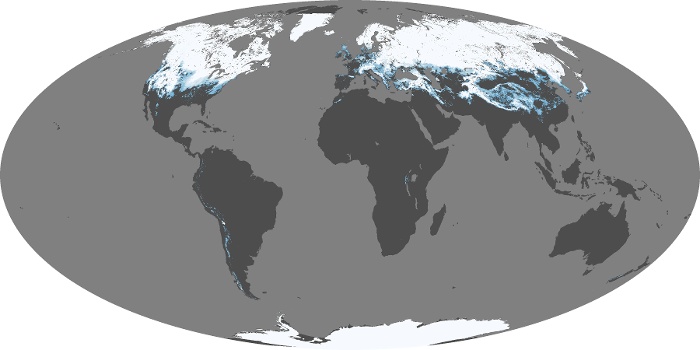


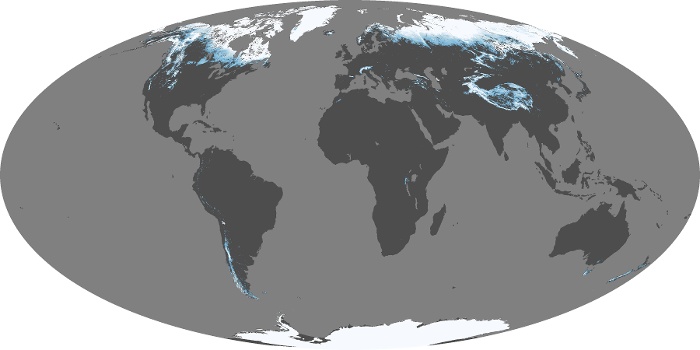
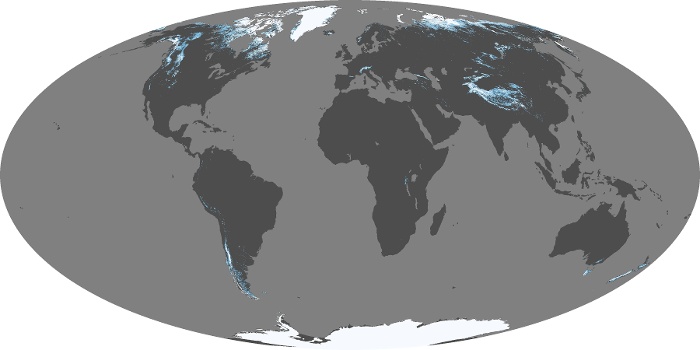
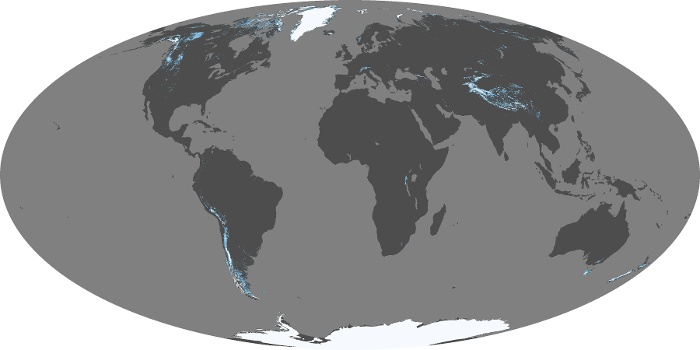
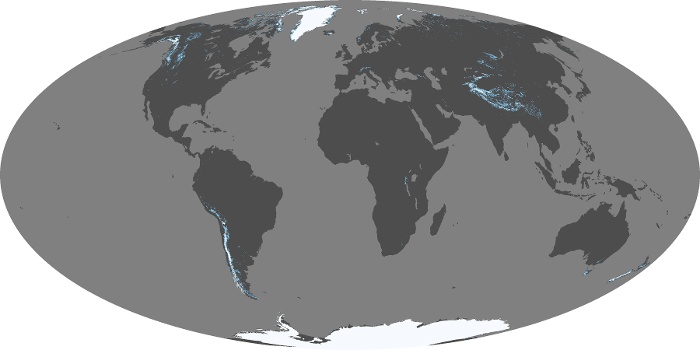
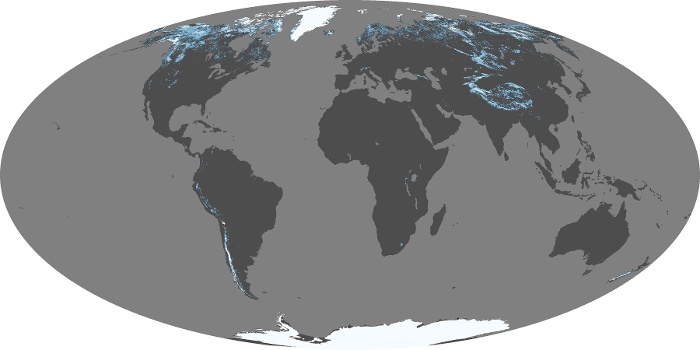
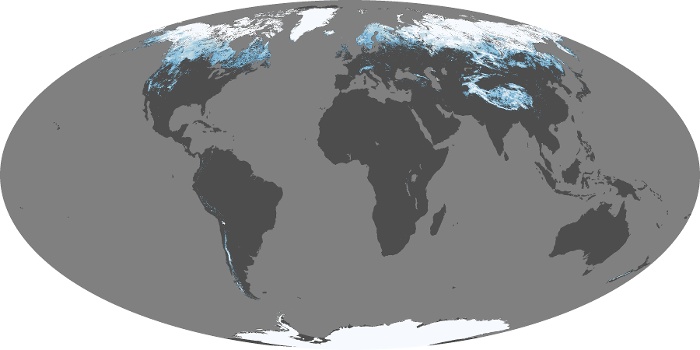
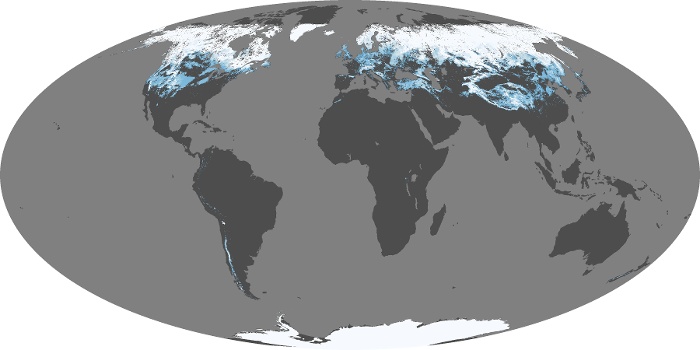
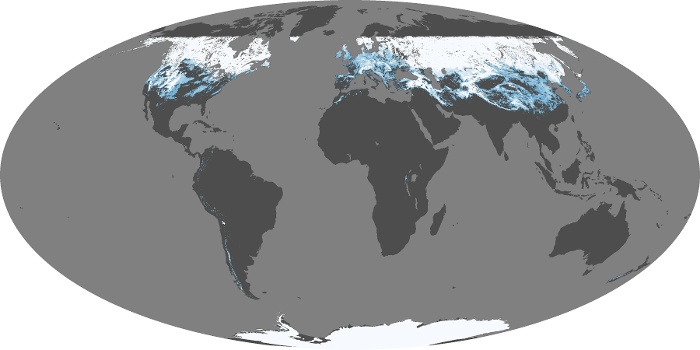
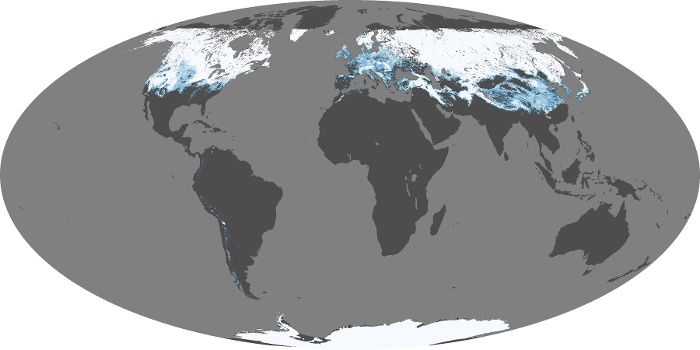
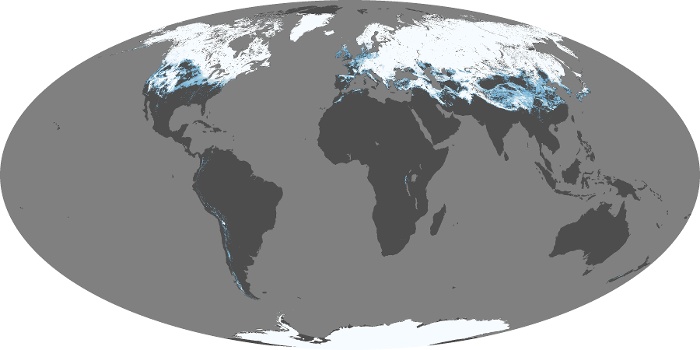

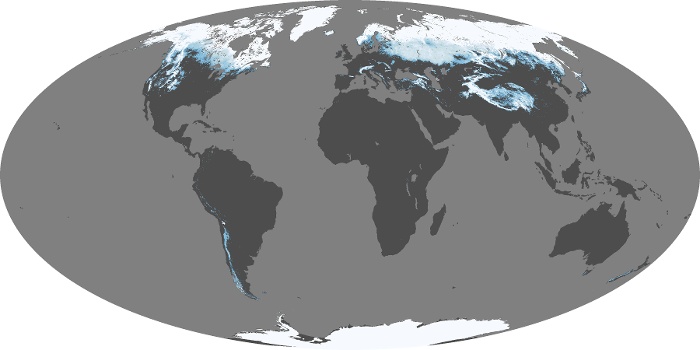
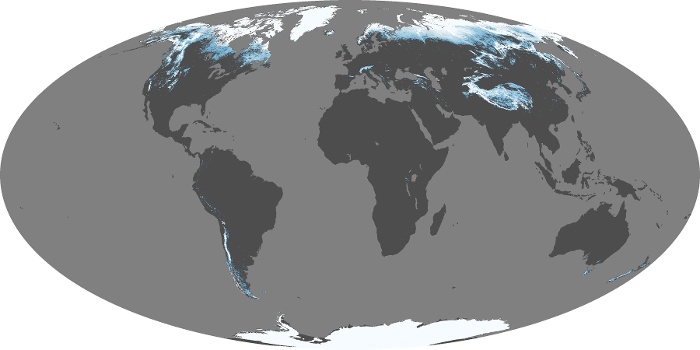
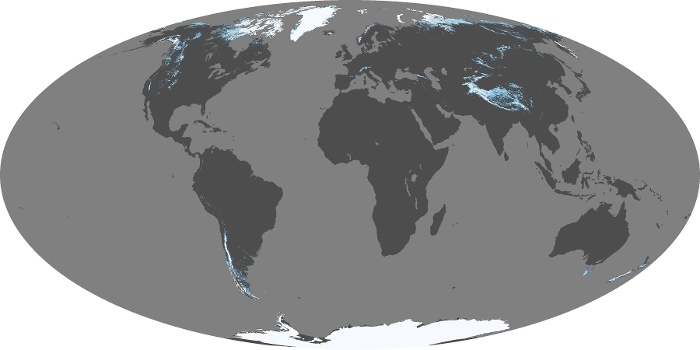

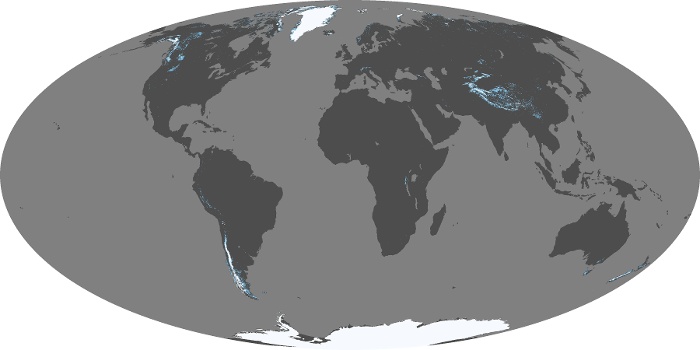

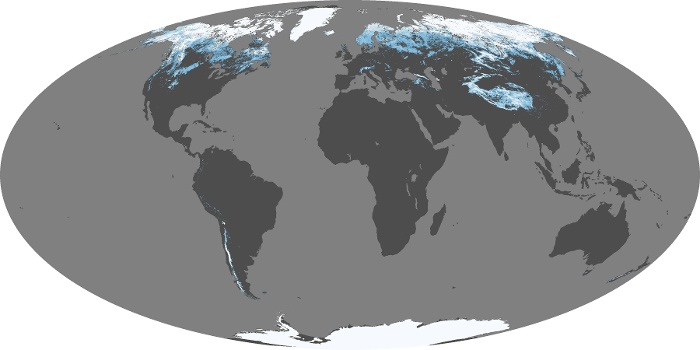
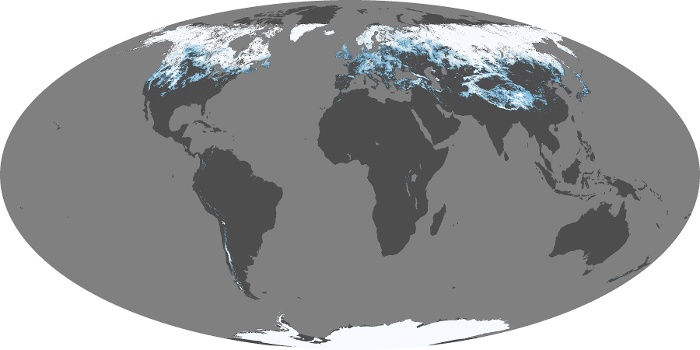

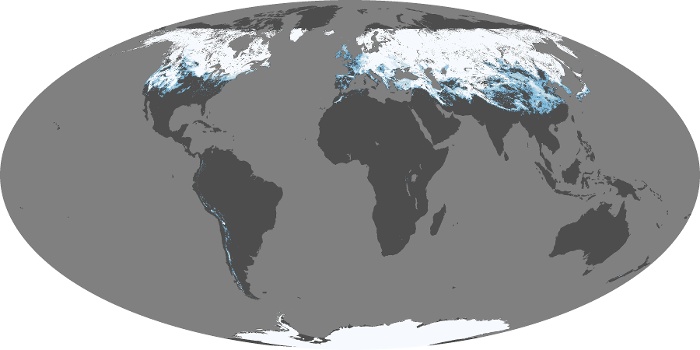
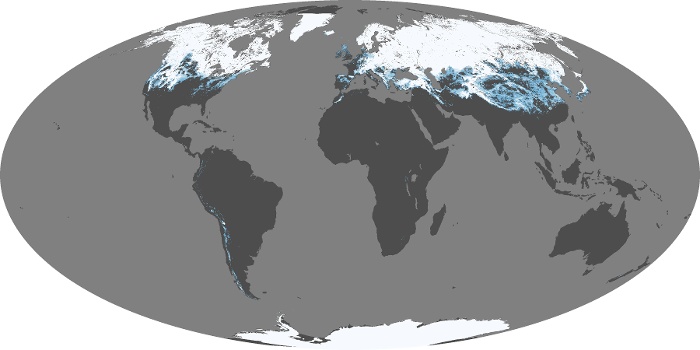

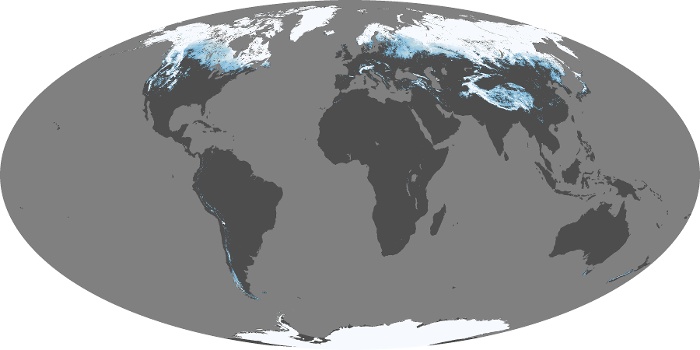
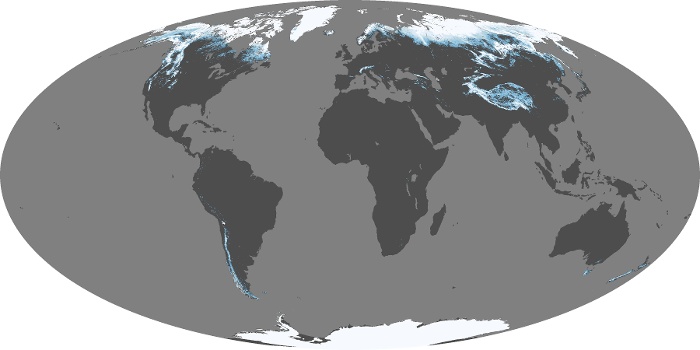
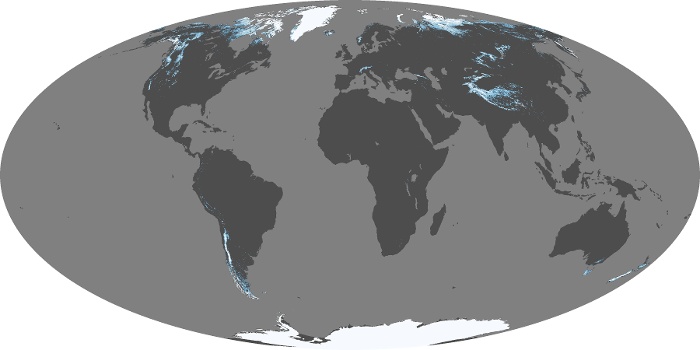
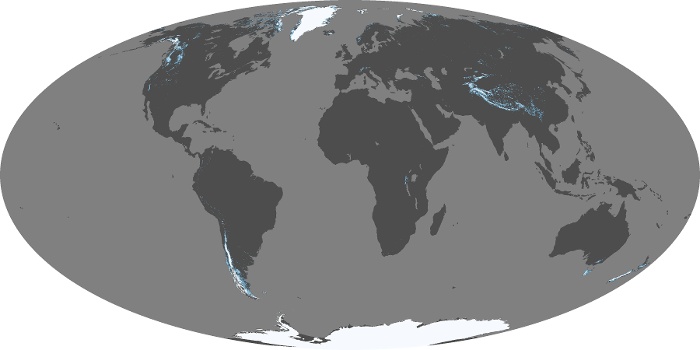
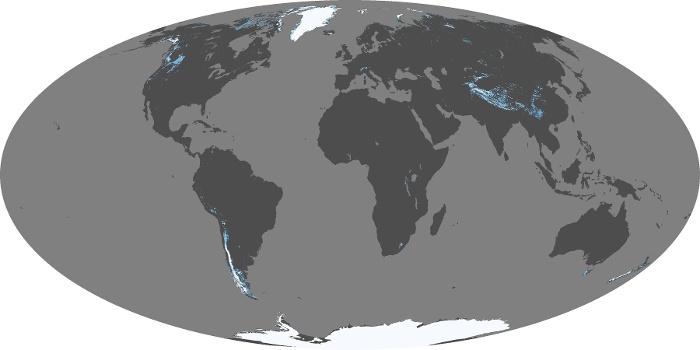

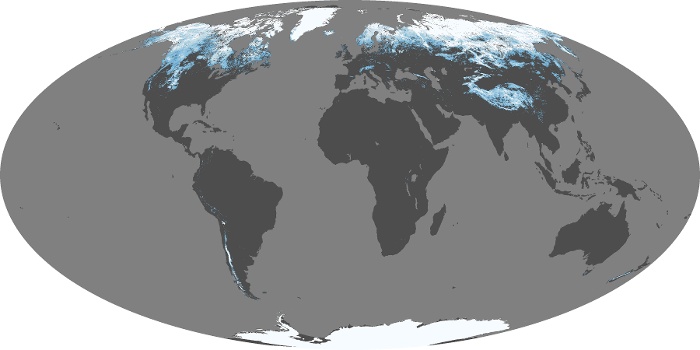
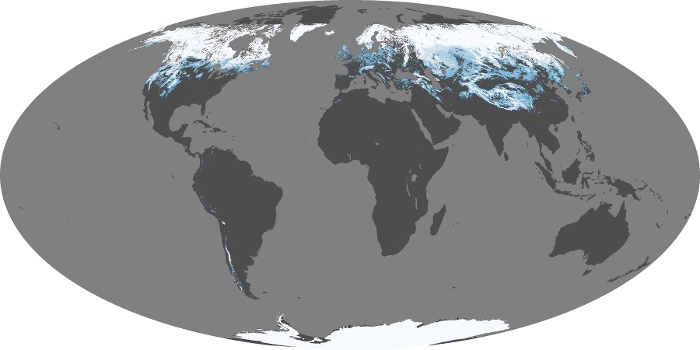
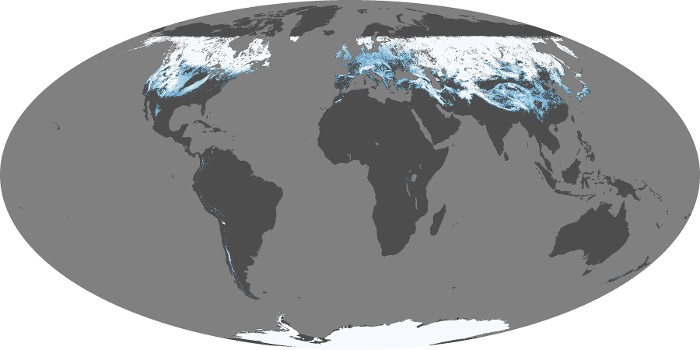
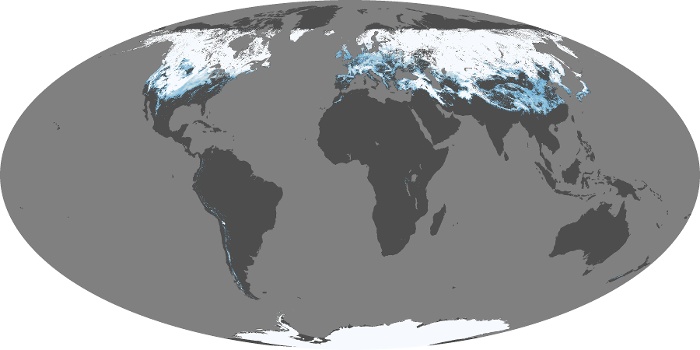

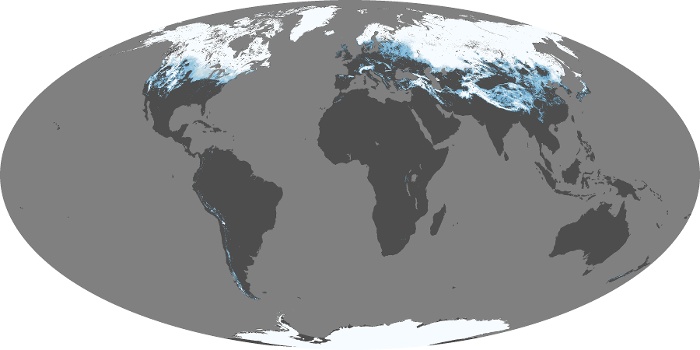
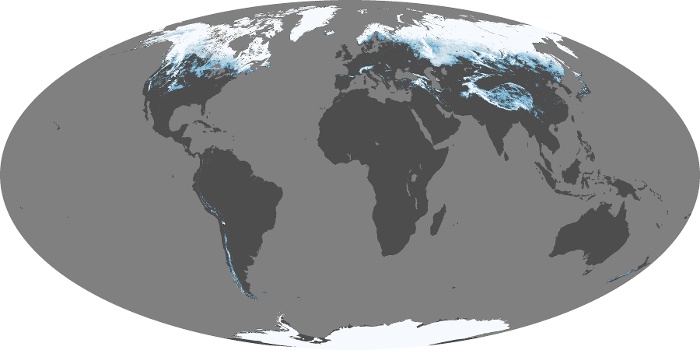
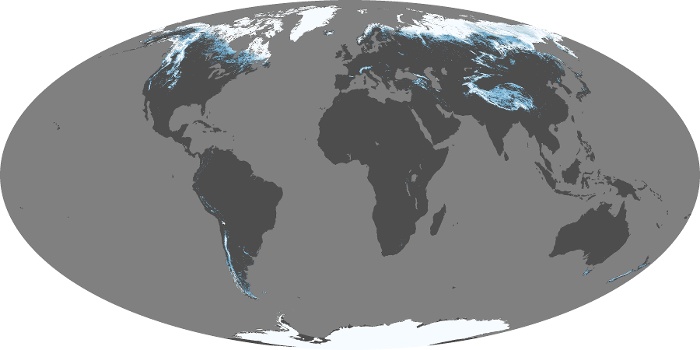
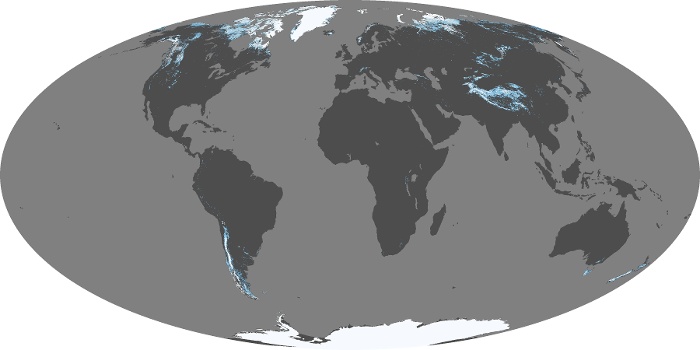
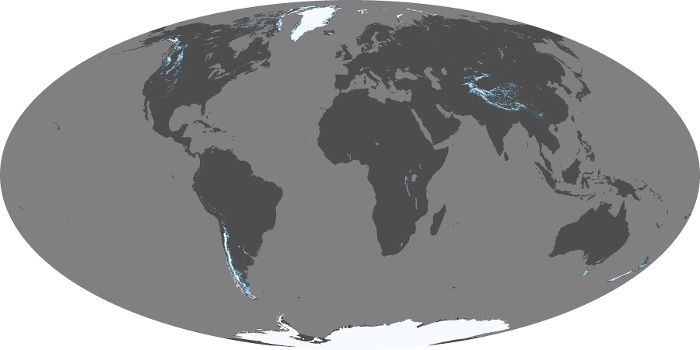
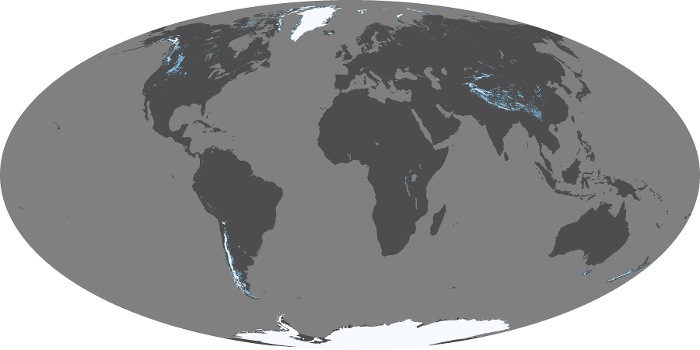
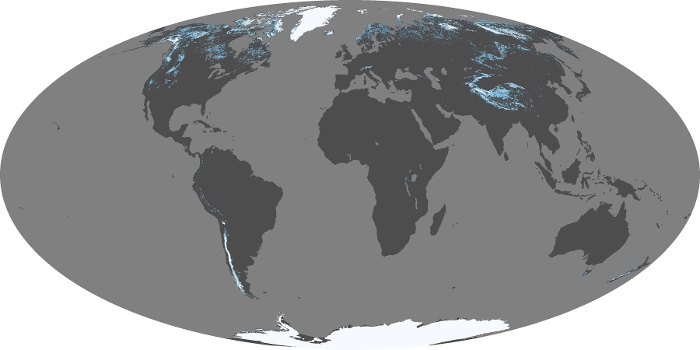

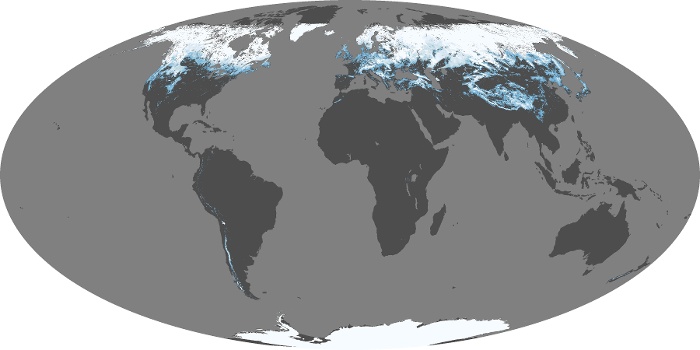
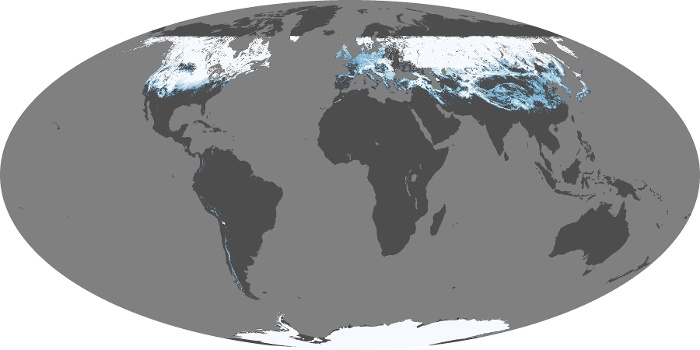

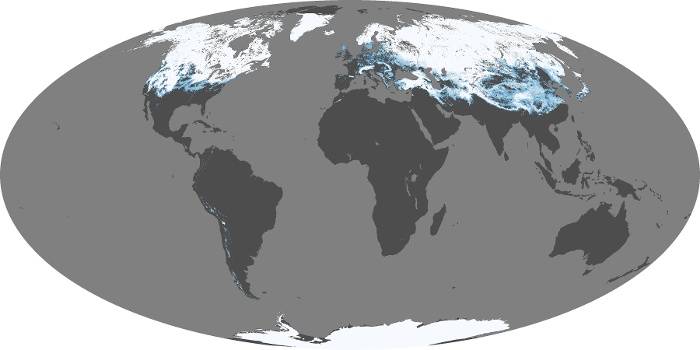
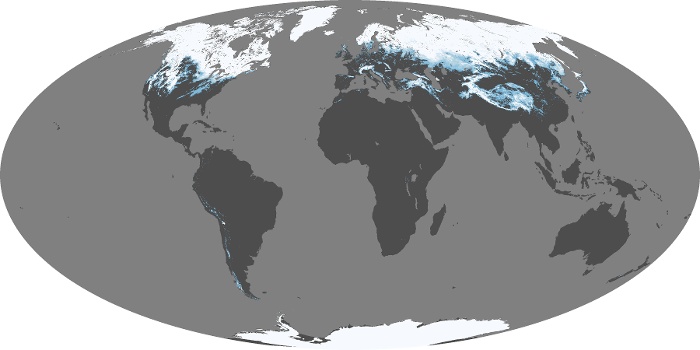
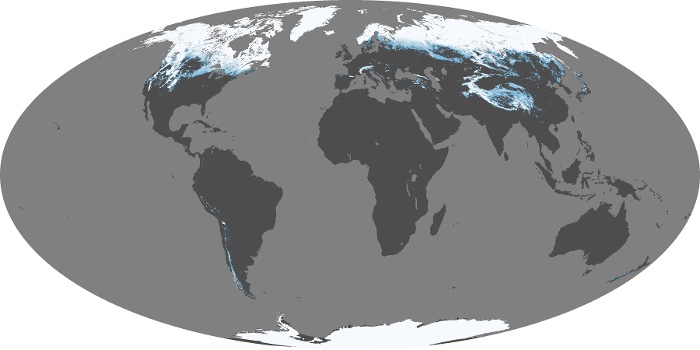
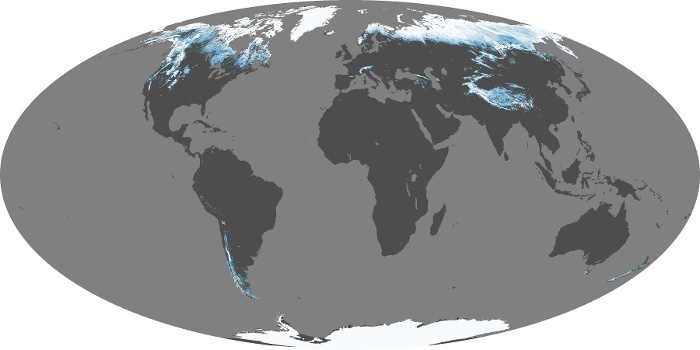
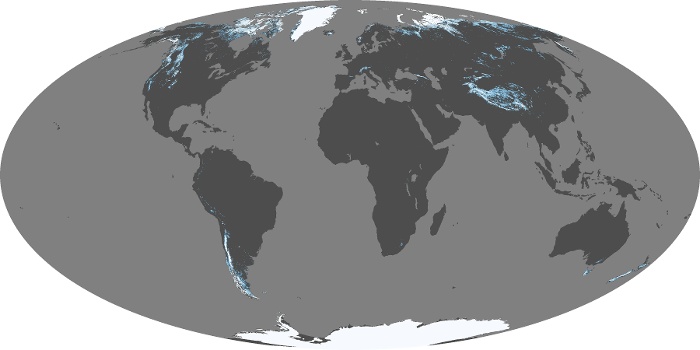
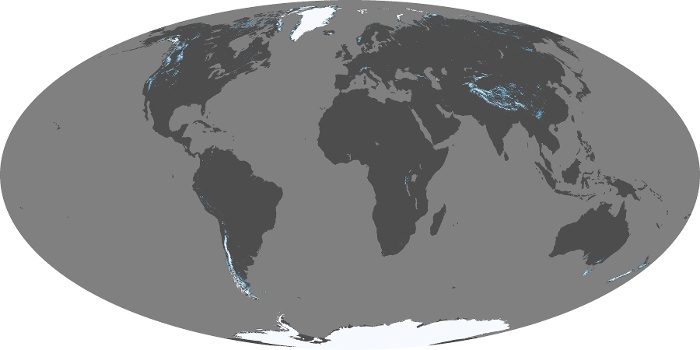
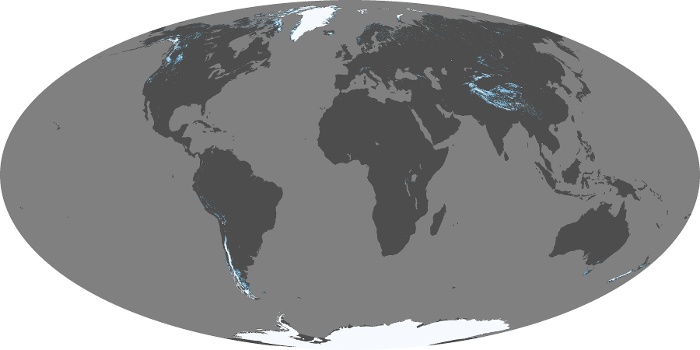
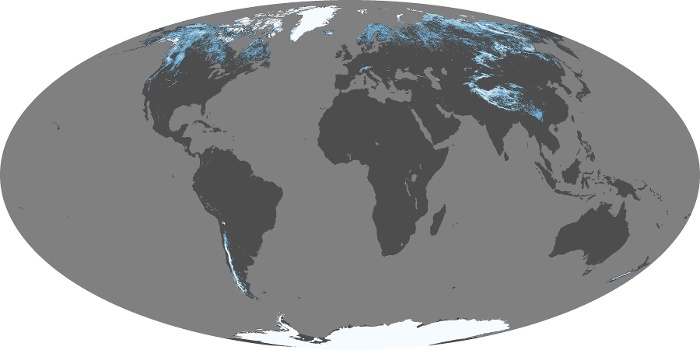
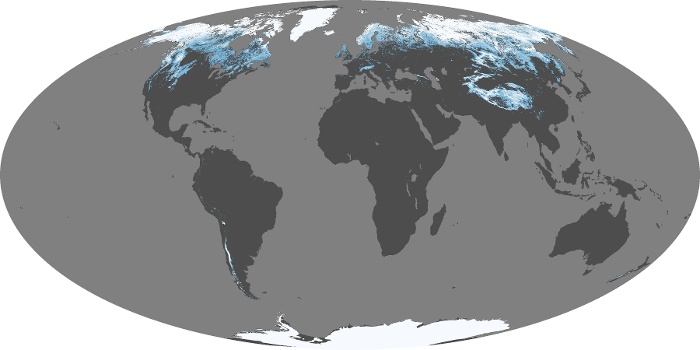
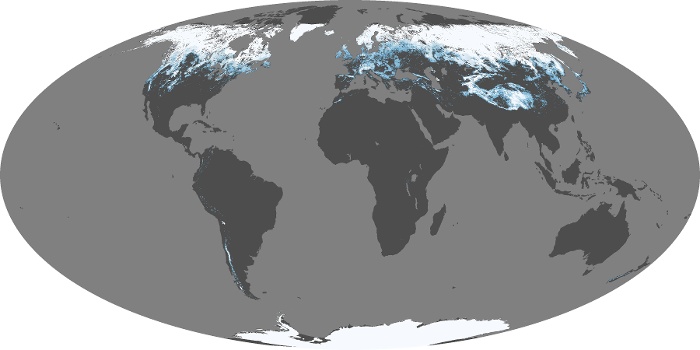
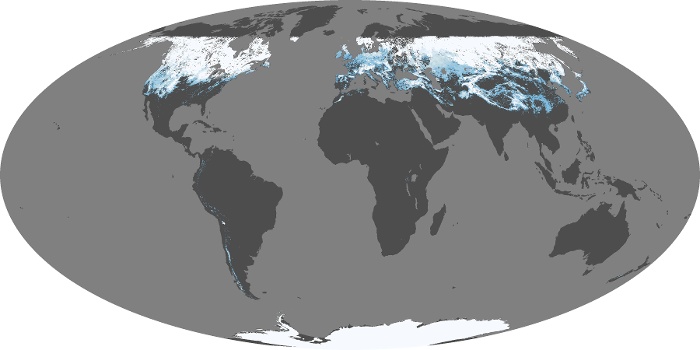
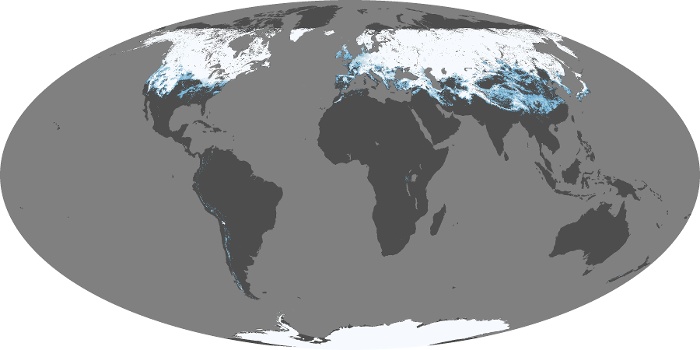

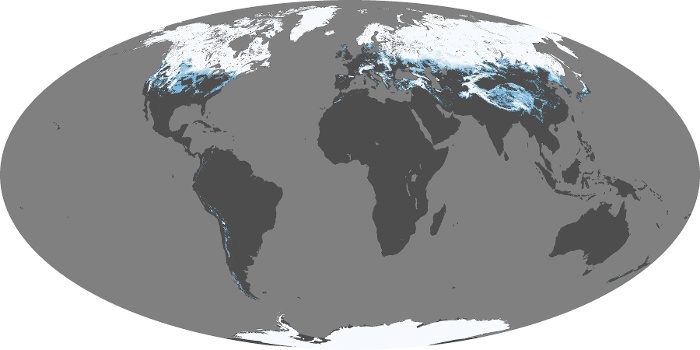
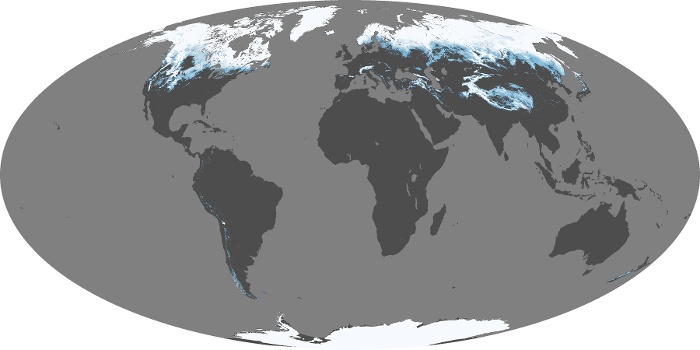
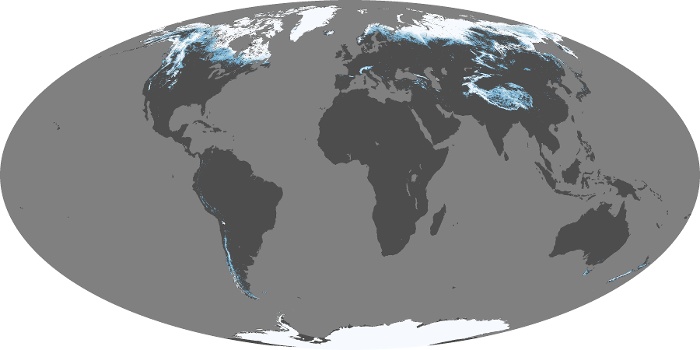
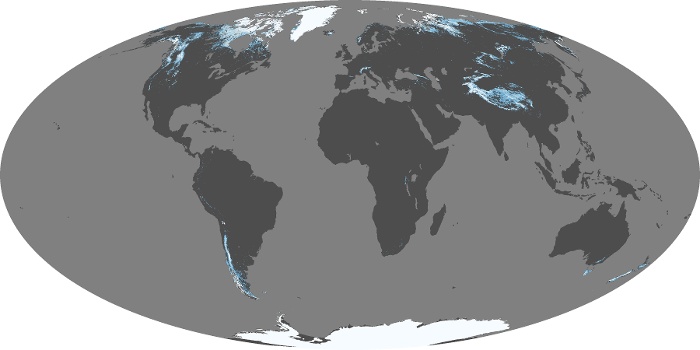
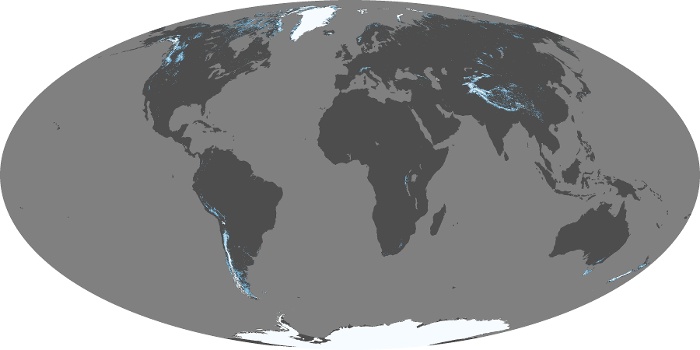
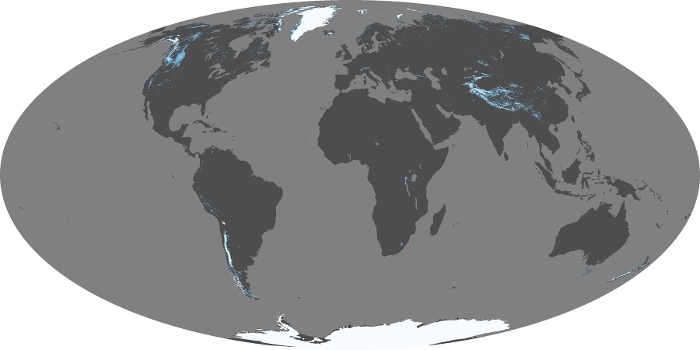

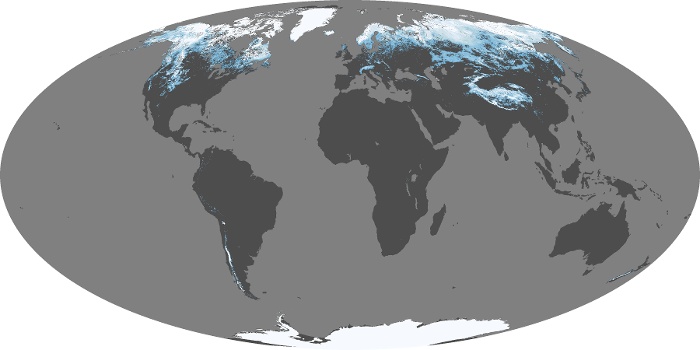
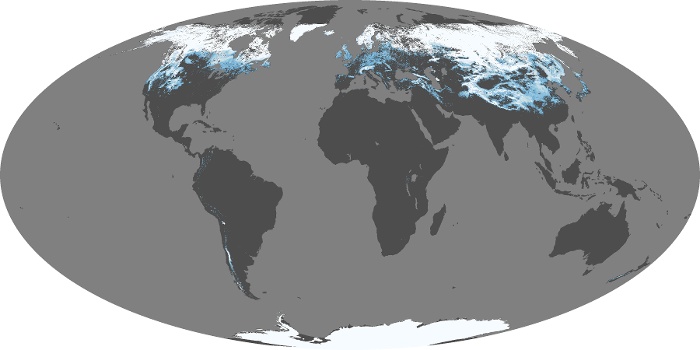
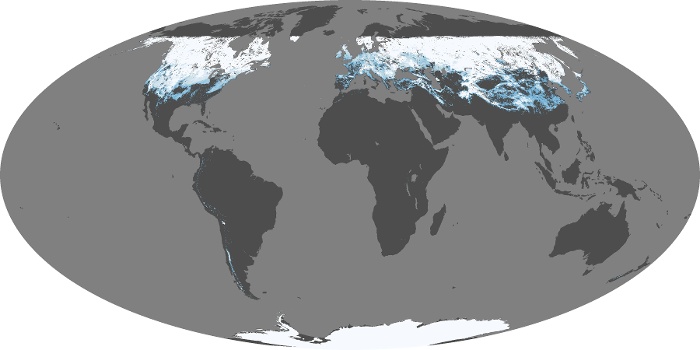
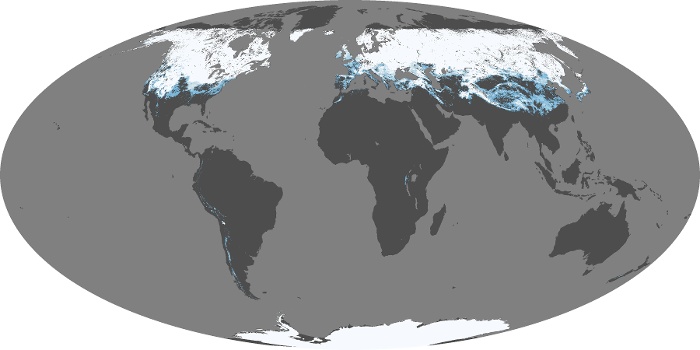
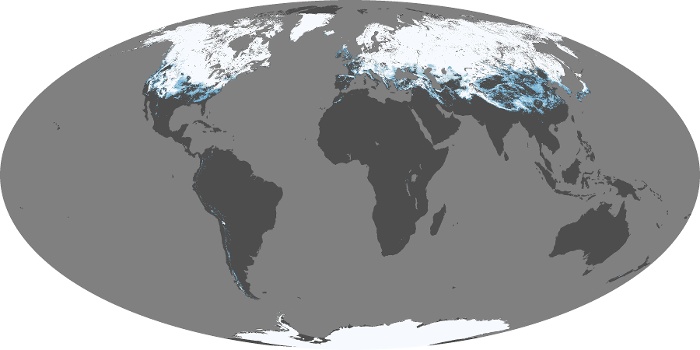


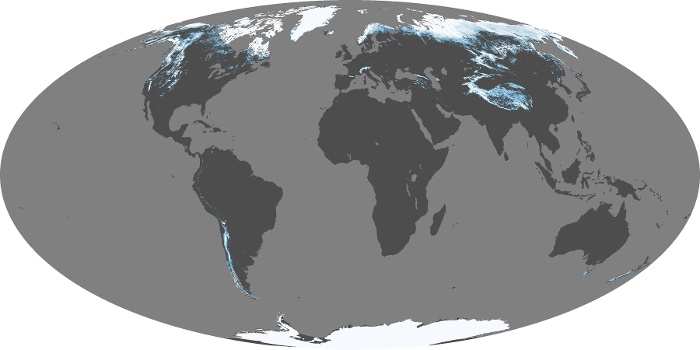
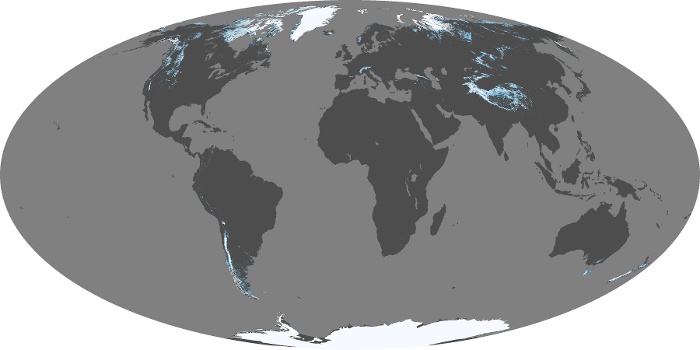
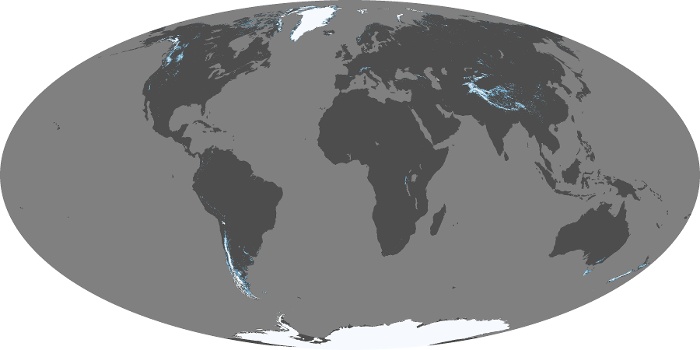
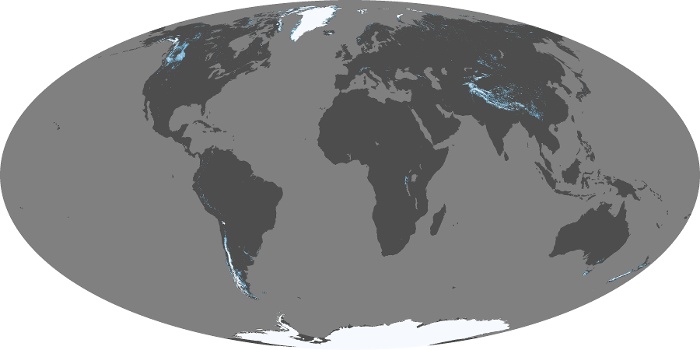

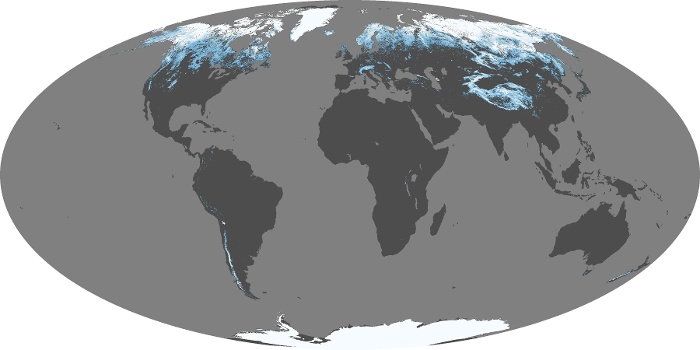
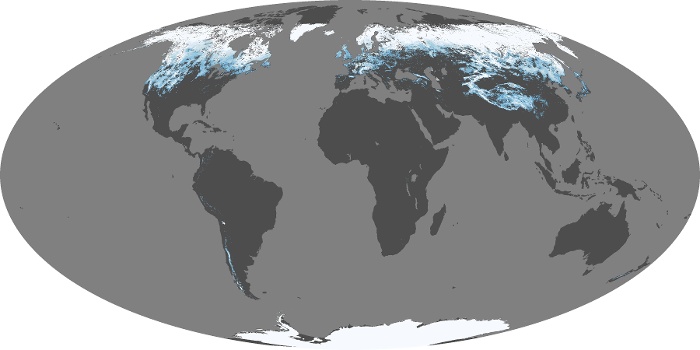
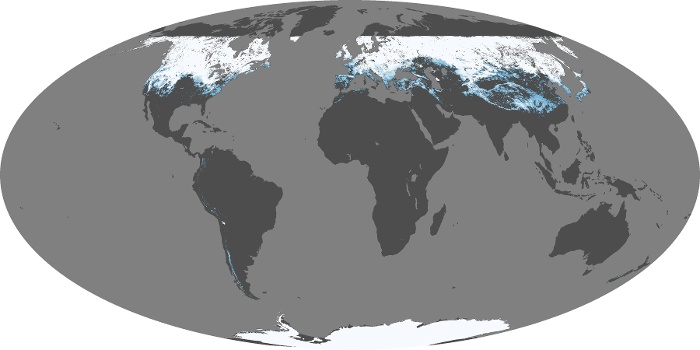
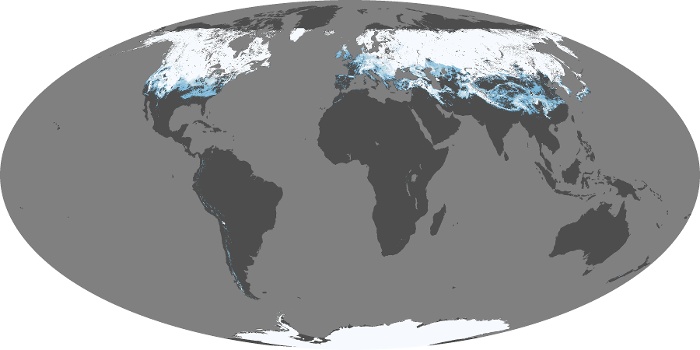
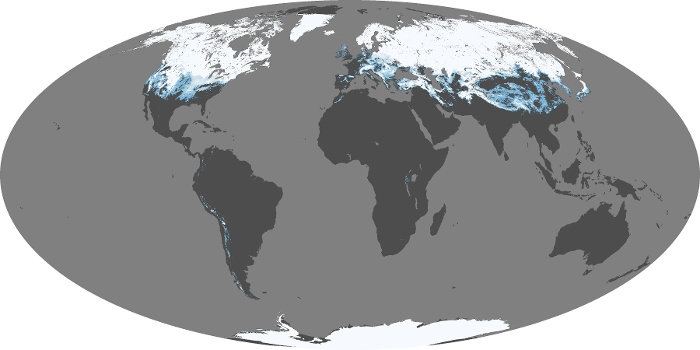

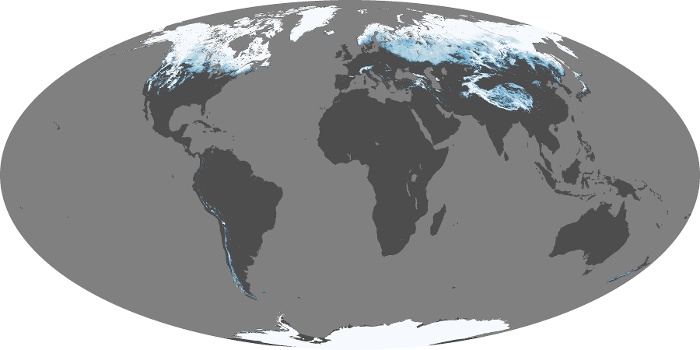
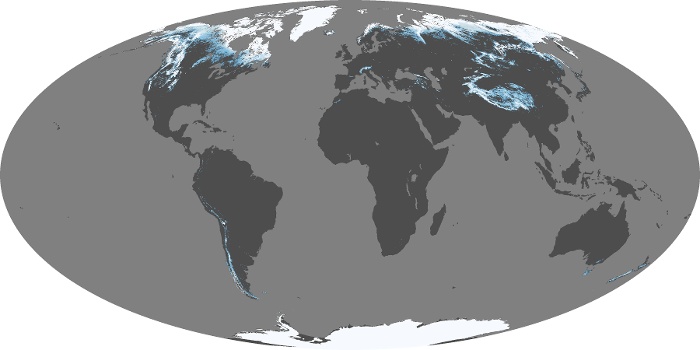
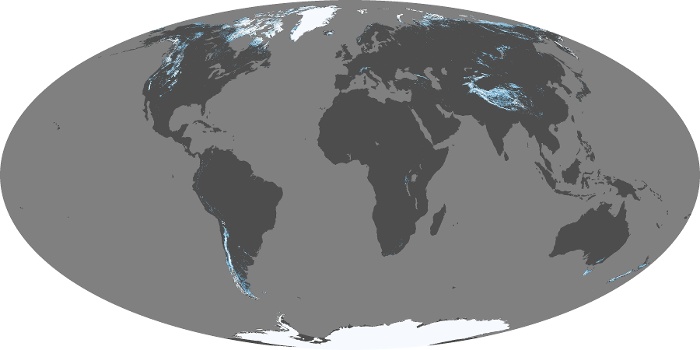
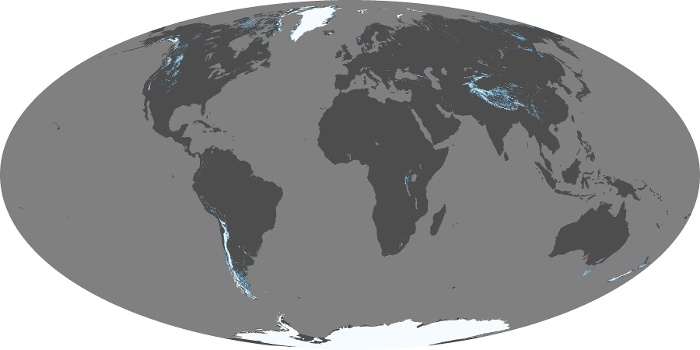
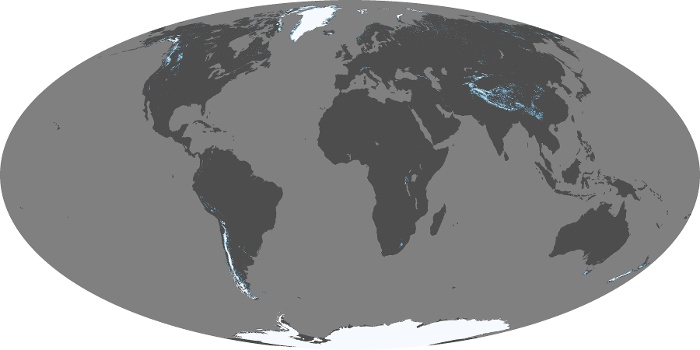

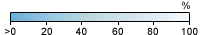


The snow cover map shows the fraction of an area covered by snow on a monthly basis. Measurements were made by the MODIS sensor on NASA’s Terra satellite. Gray indicates land areas with no snow, darkest blue represents minimal snow cover, and solid white indicates 100 percent snow cover. Because MODIS relies on visible light to assess snow cover, the sensor cannot collect data over the highest latitudes of the Northern Hemisphere during winter when no sunlight reaches the polar region.
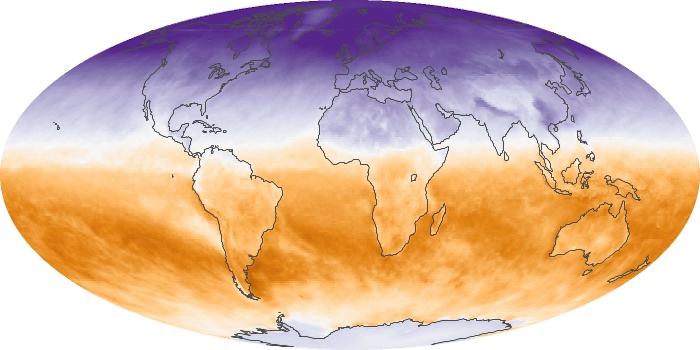
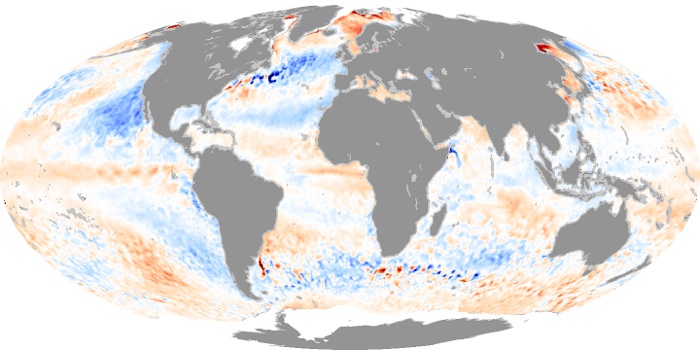
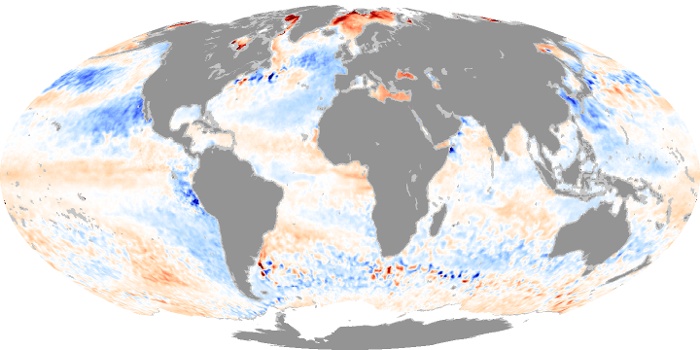
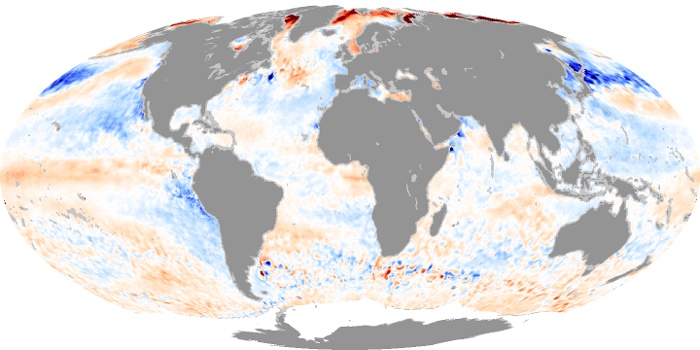
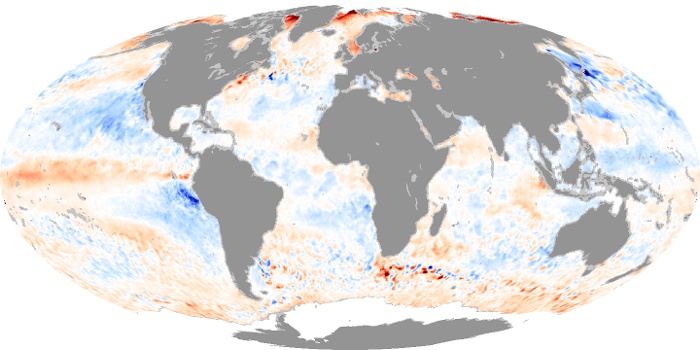
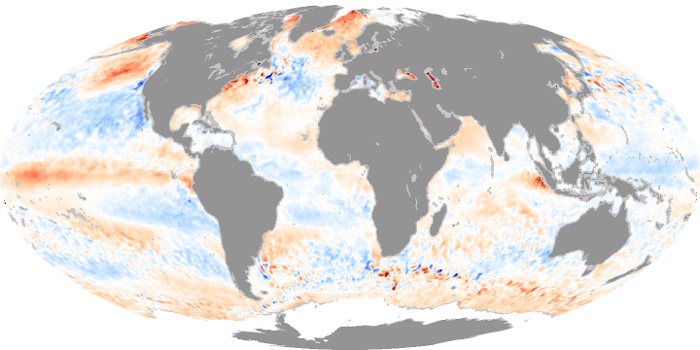
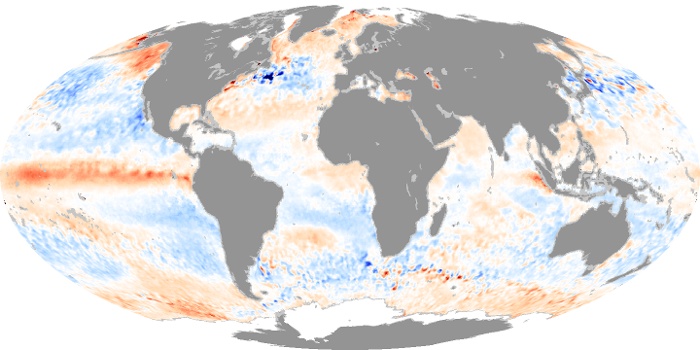
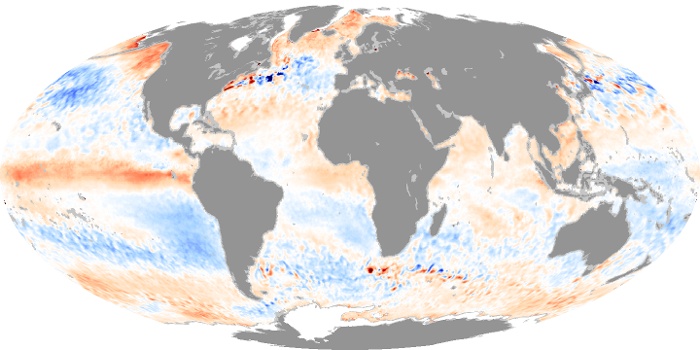
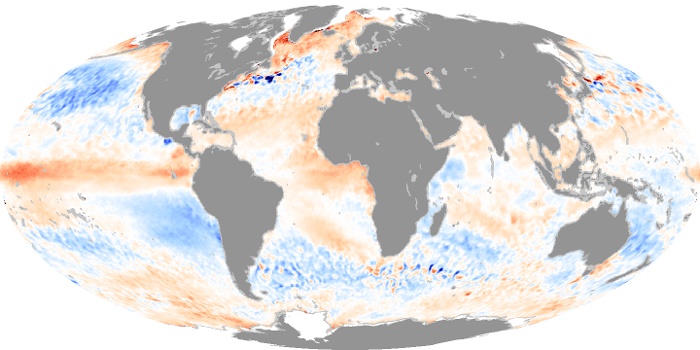
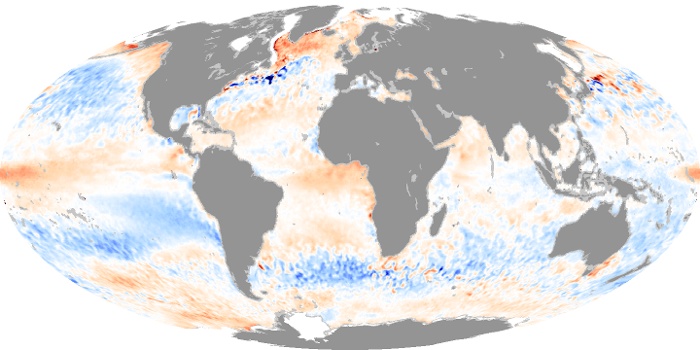
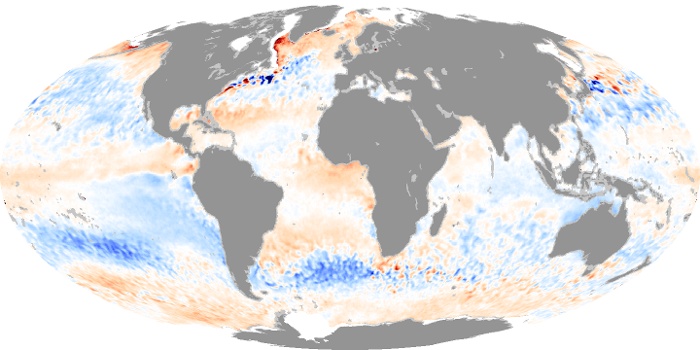
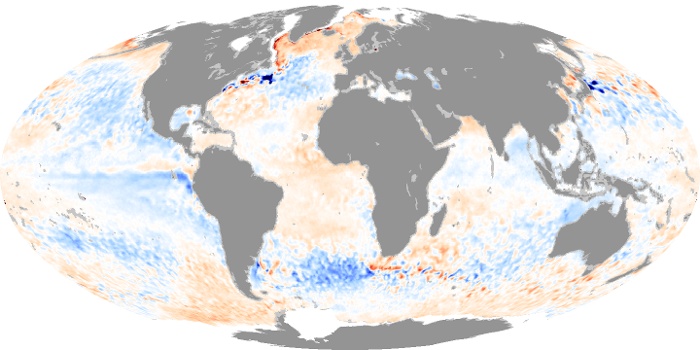
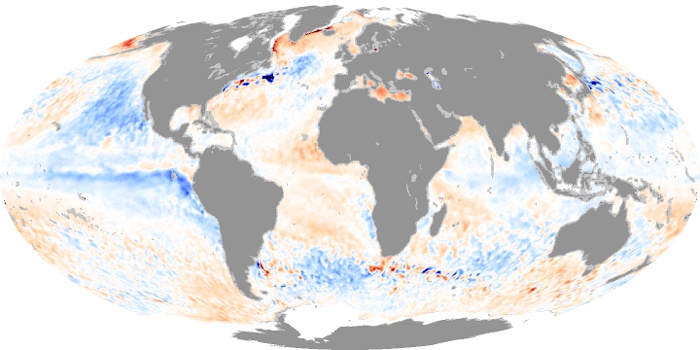
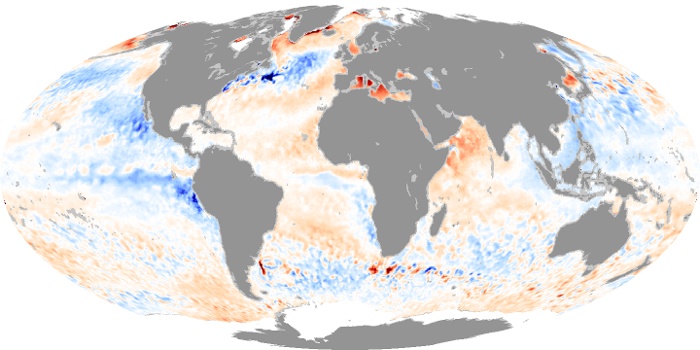
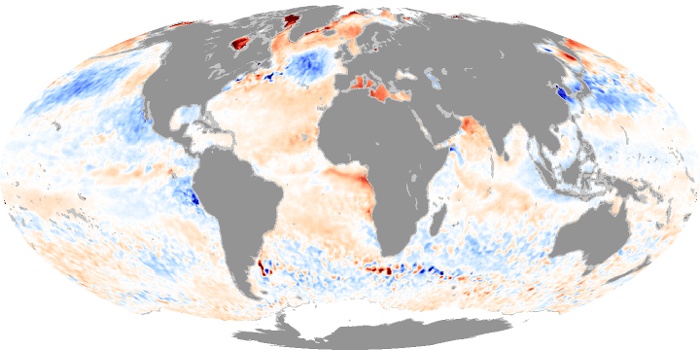
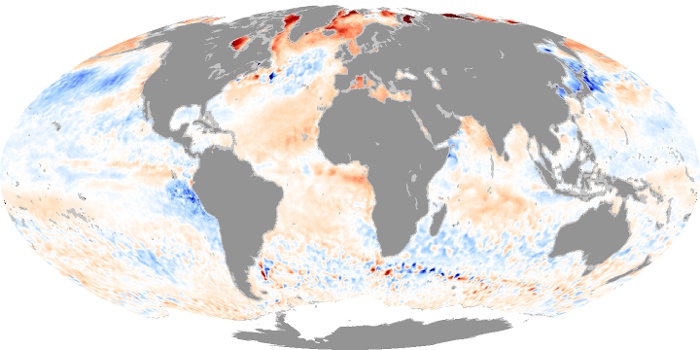
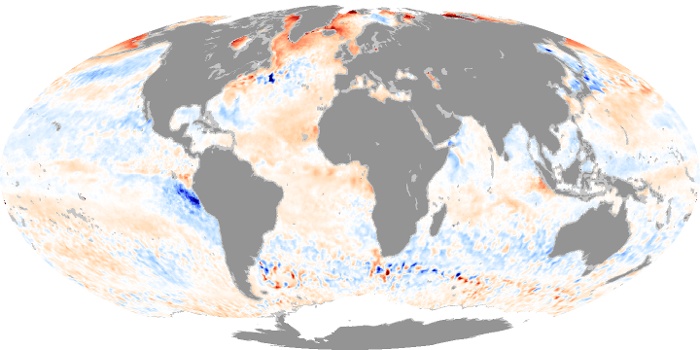
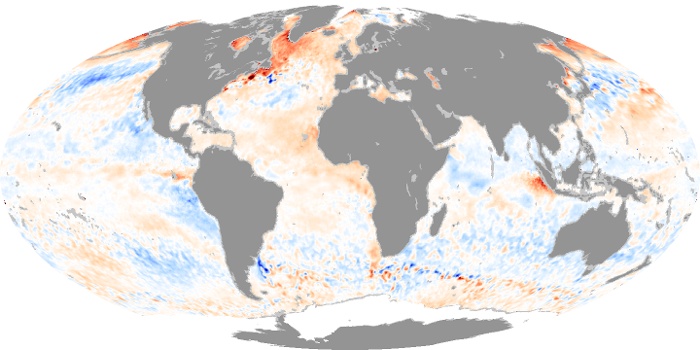
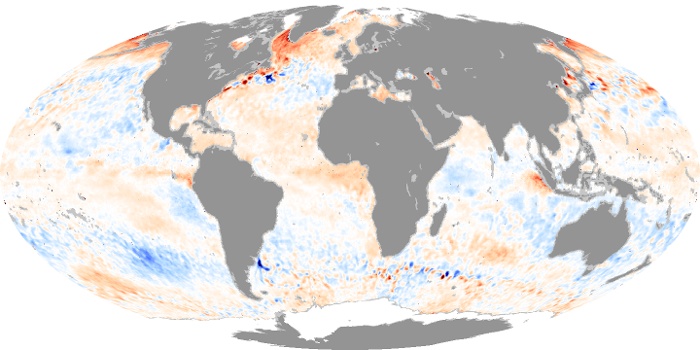
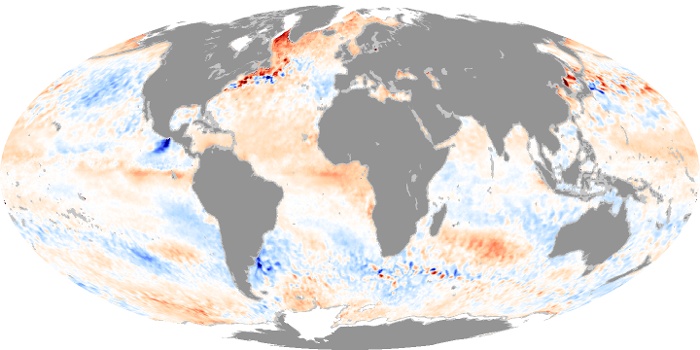
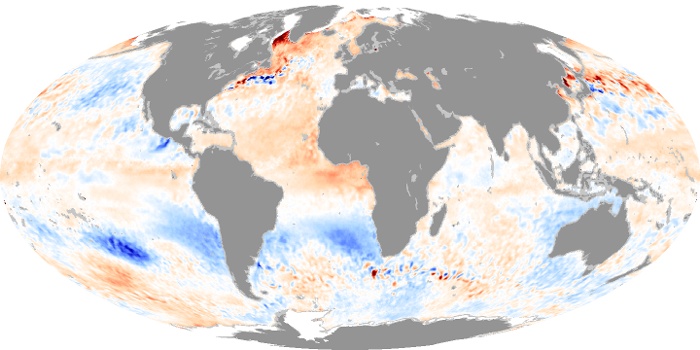
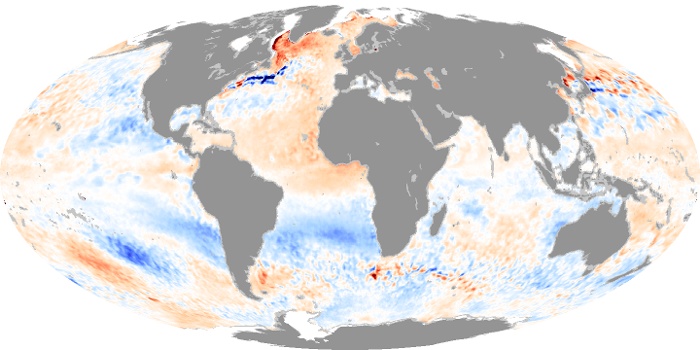
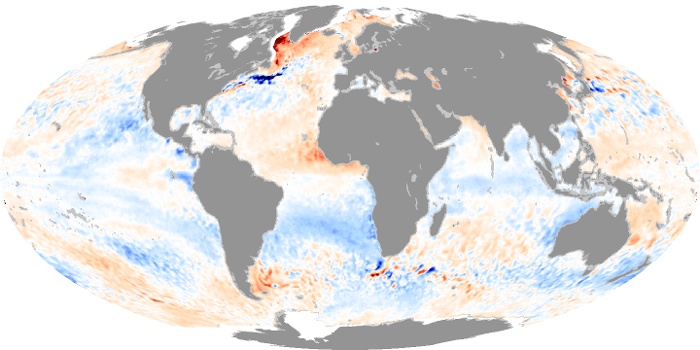
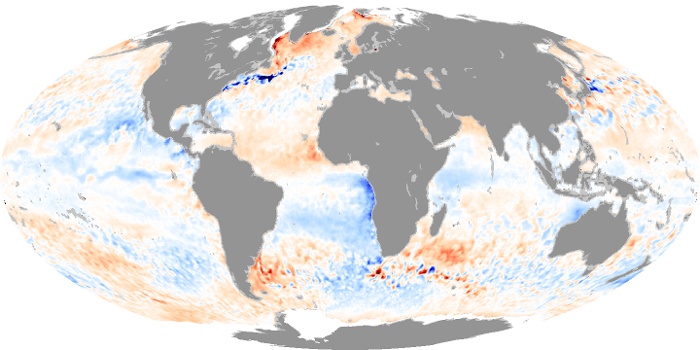
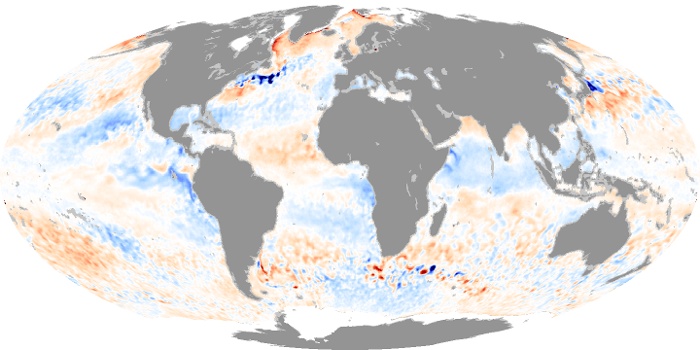
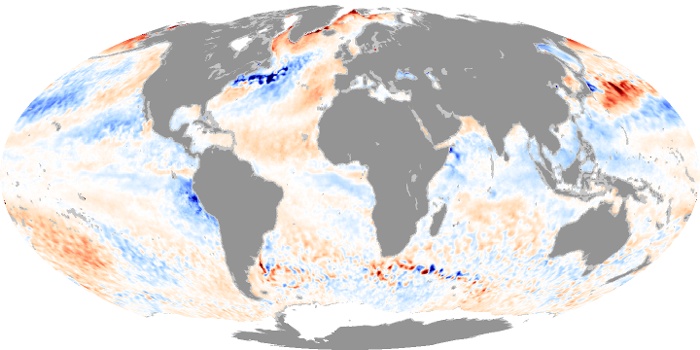
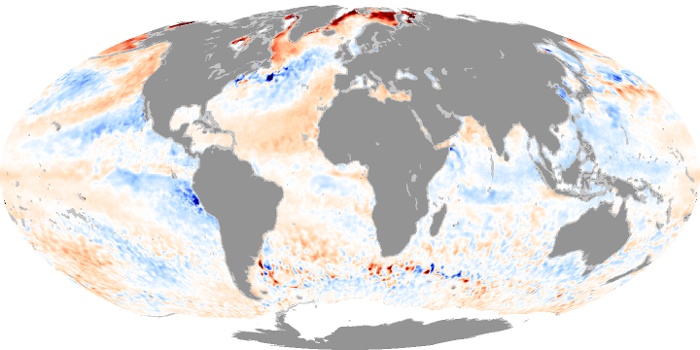
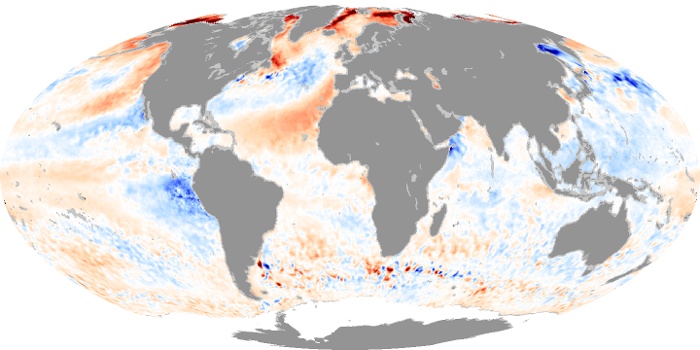
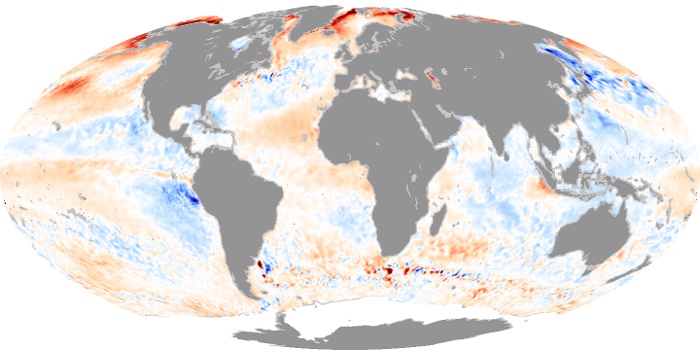
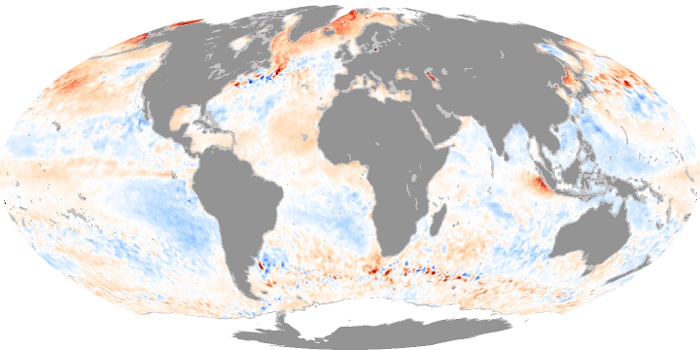
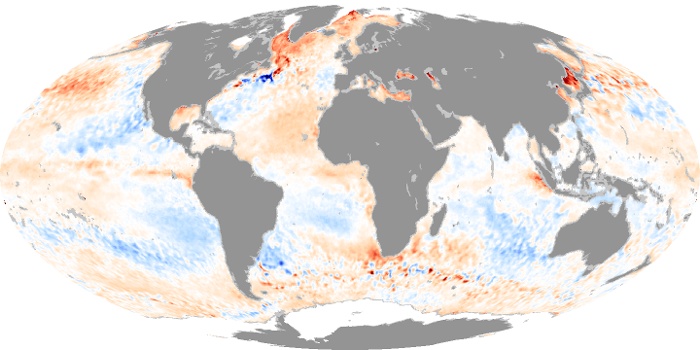
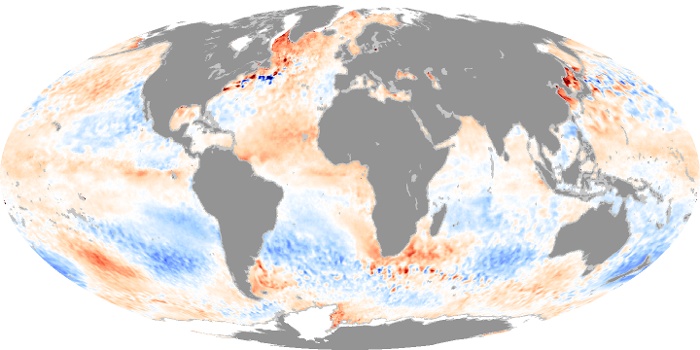
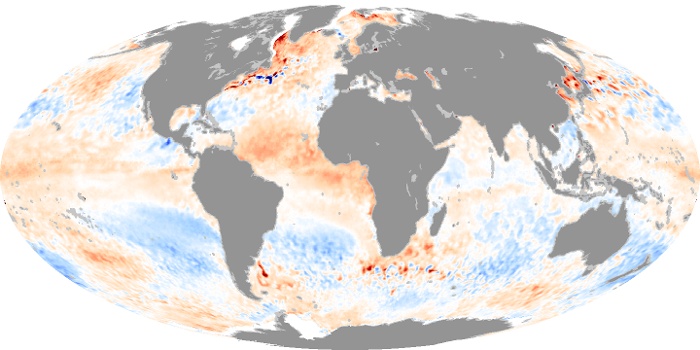
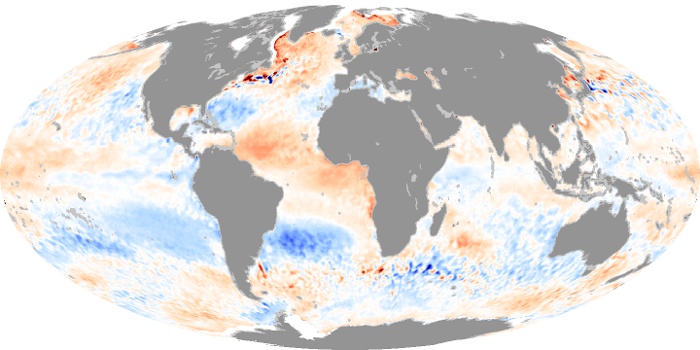
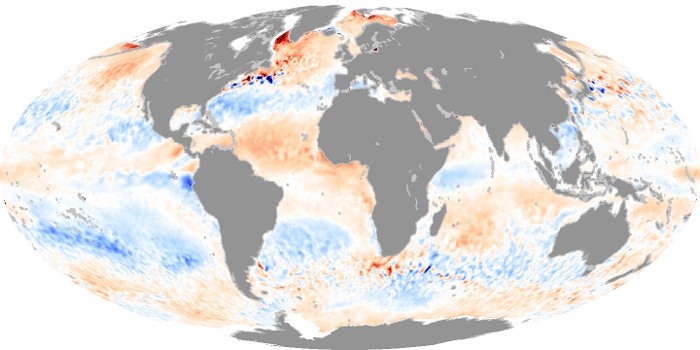
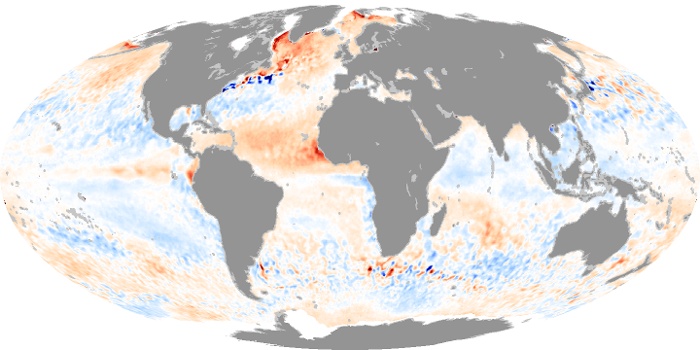
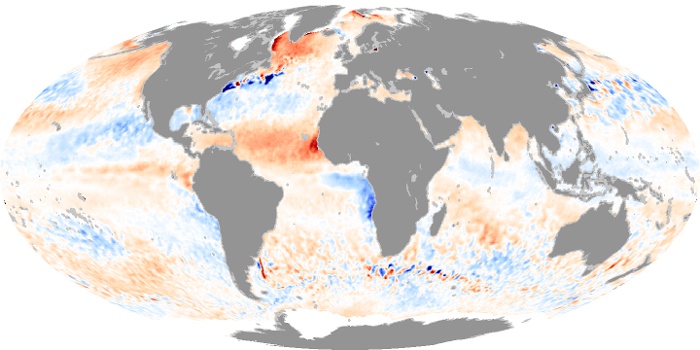
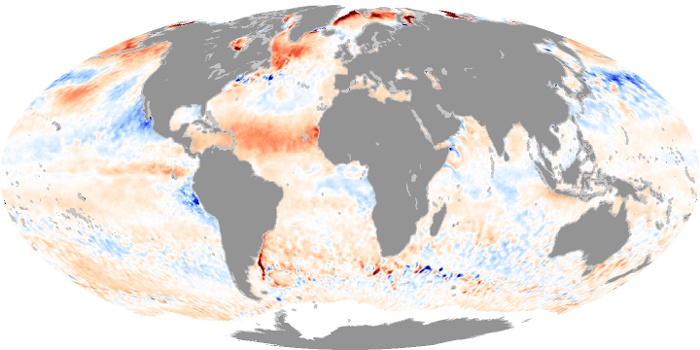
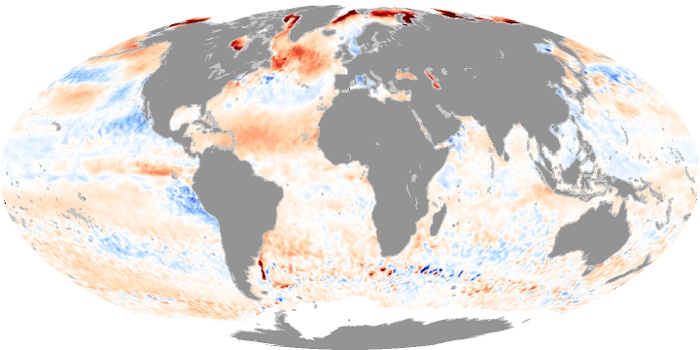
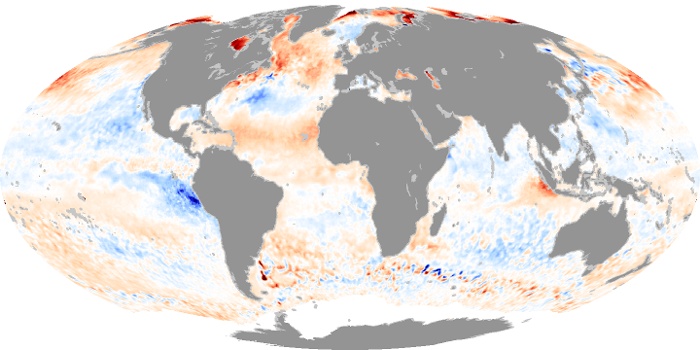
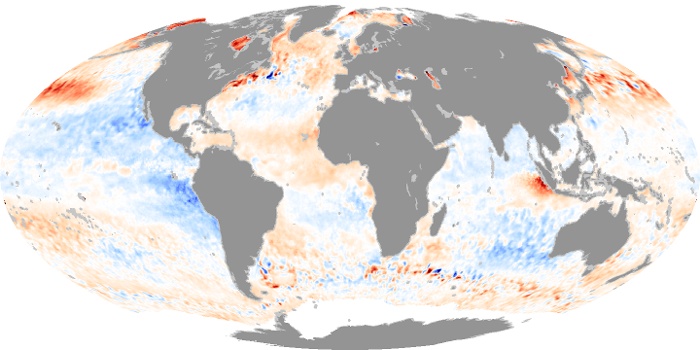
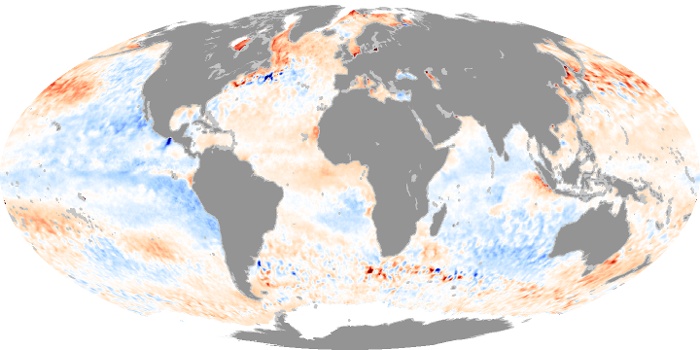
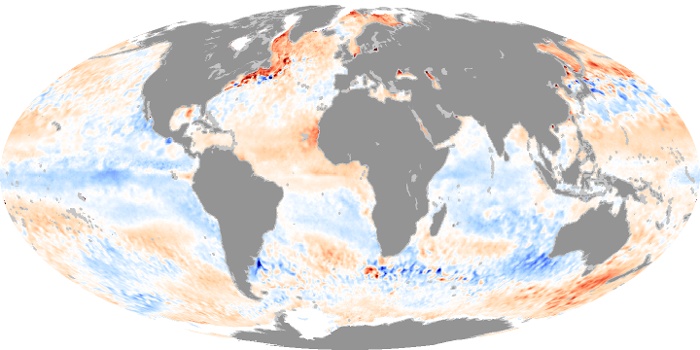
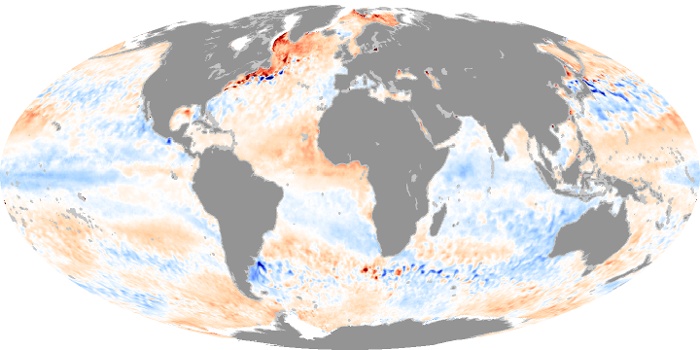
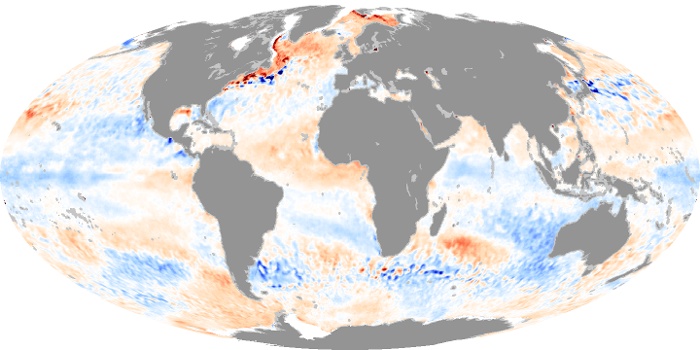
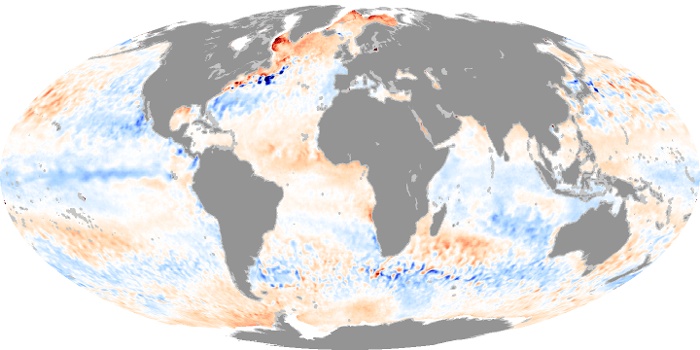
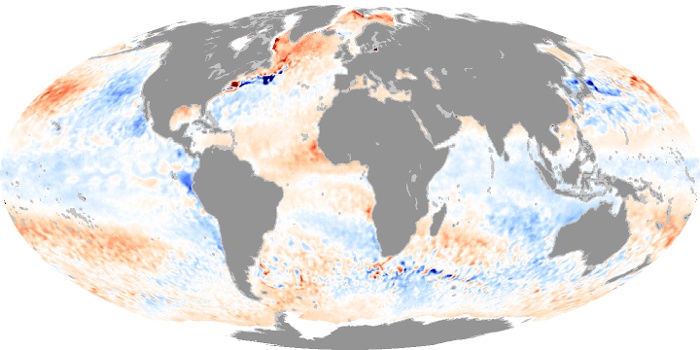
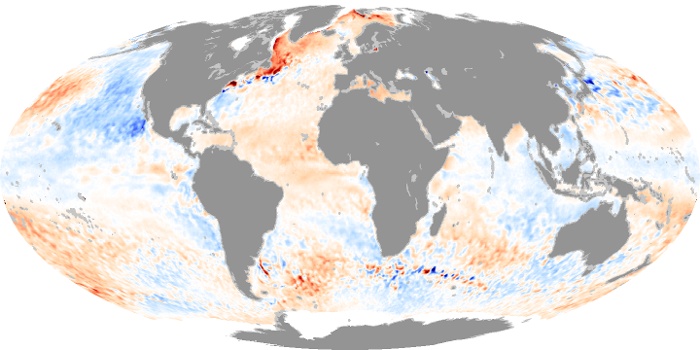
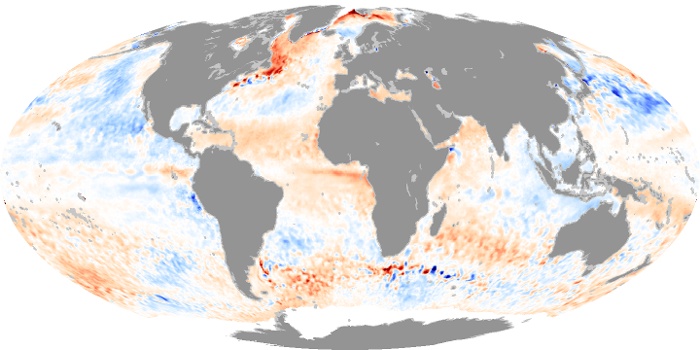
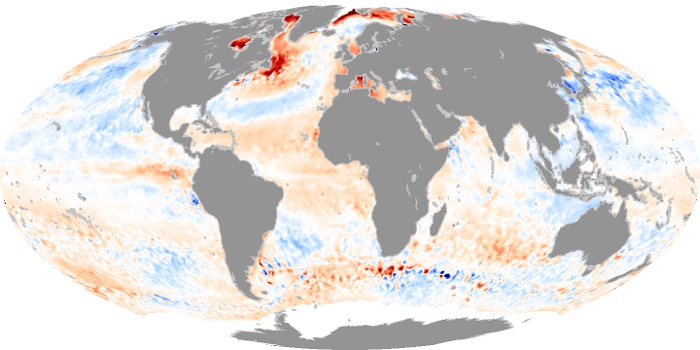
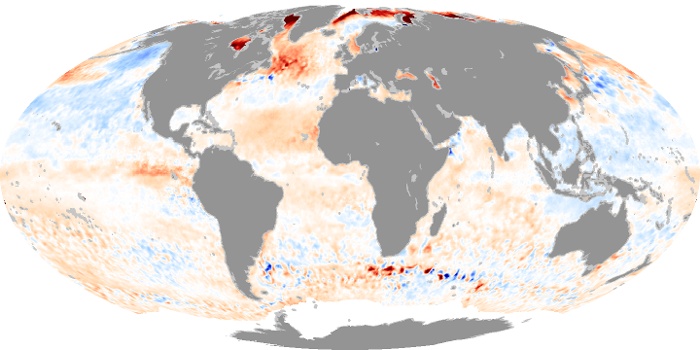
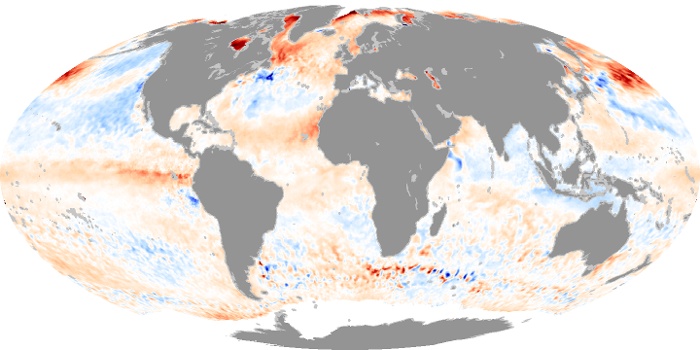
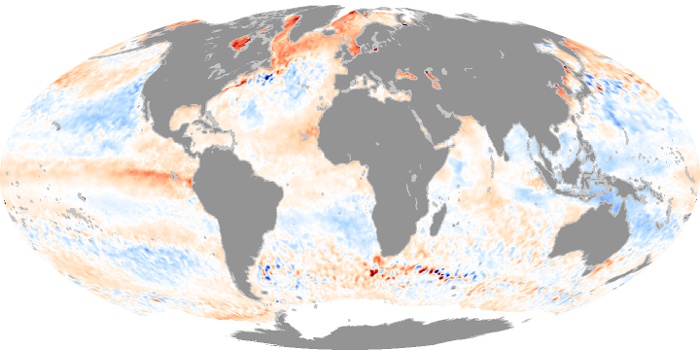
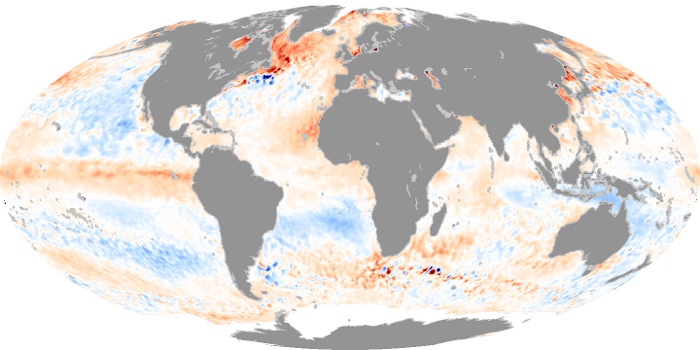
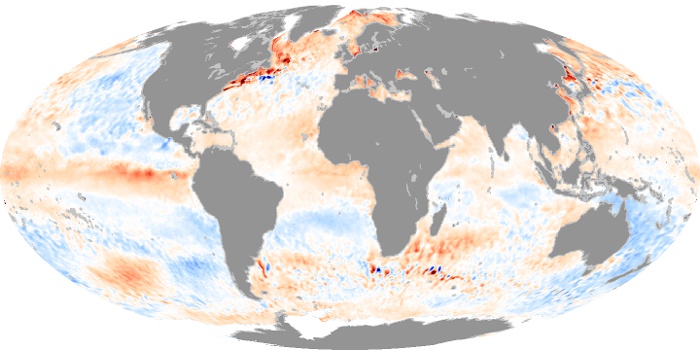
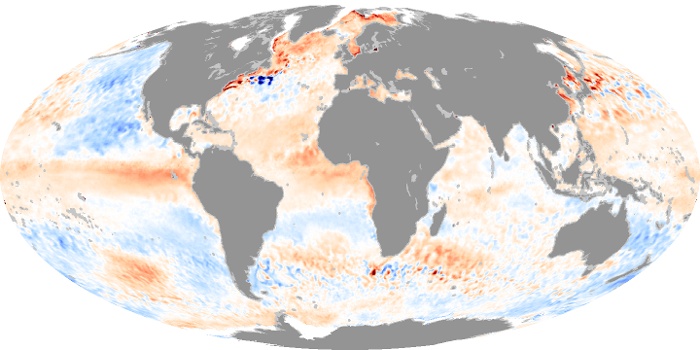
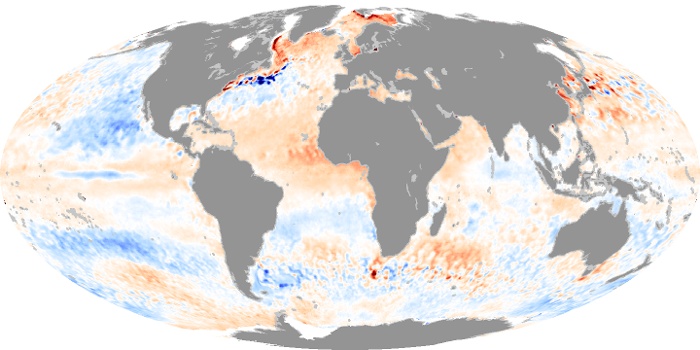
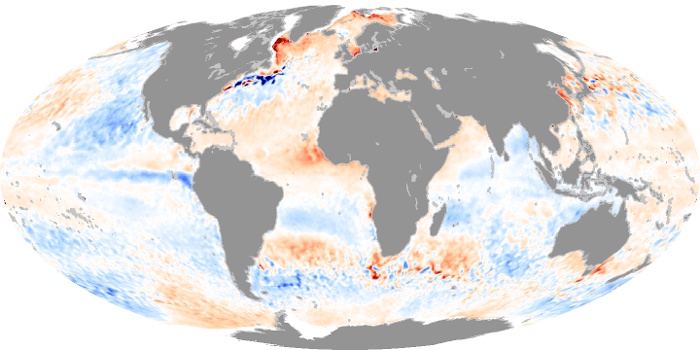
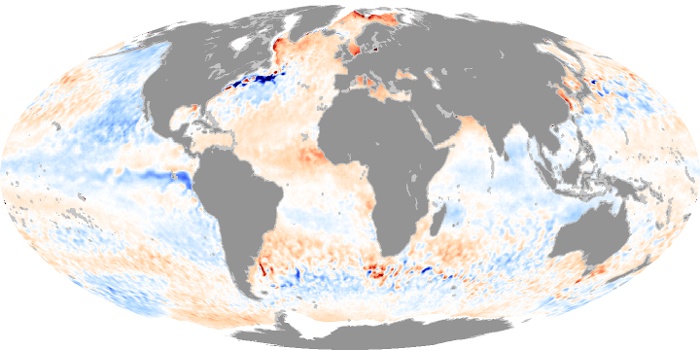
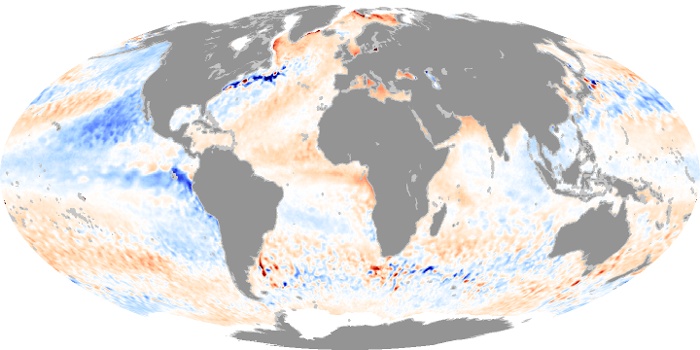
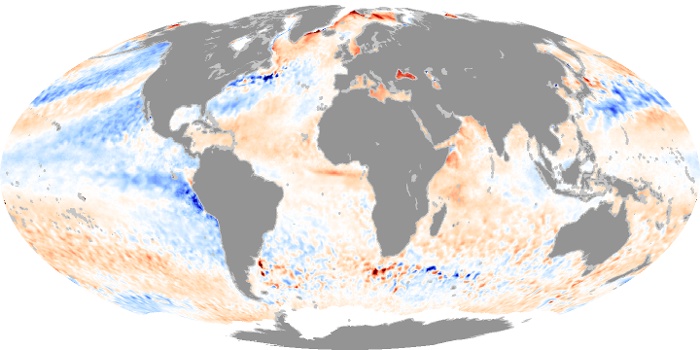
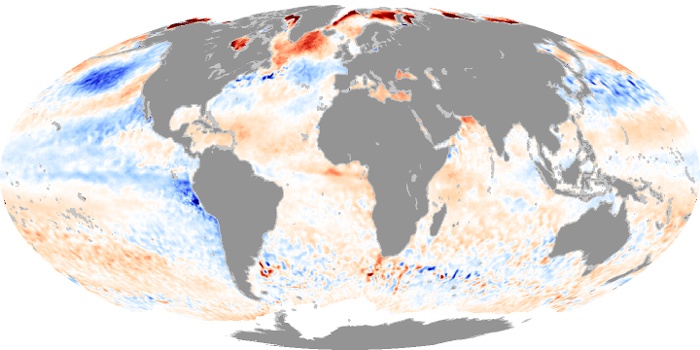
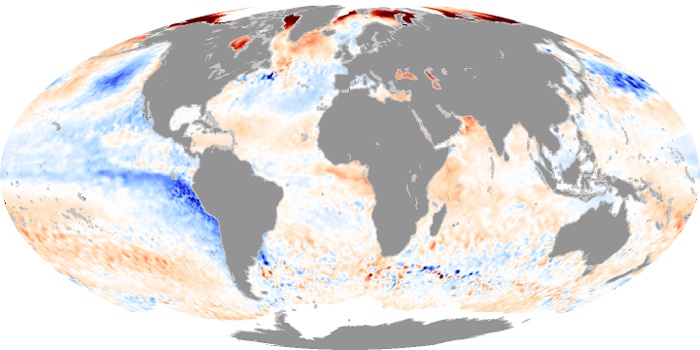
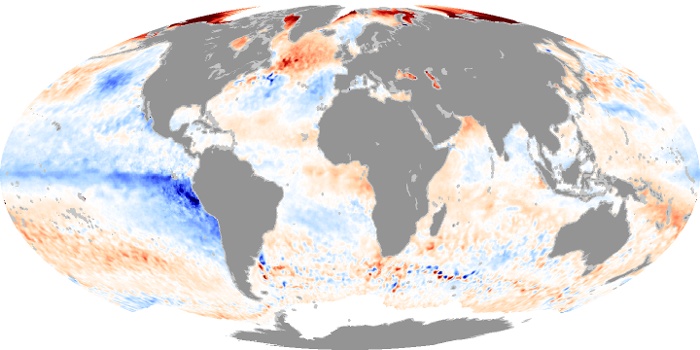
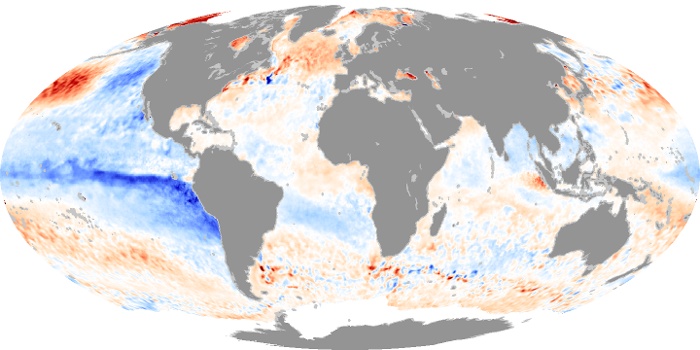
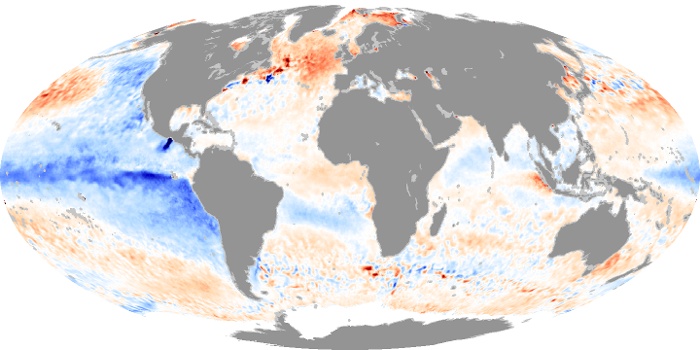
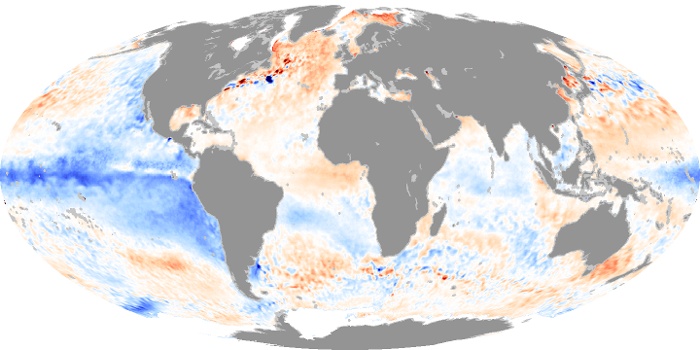
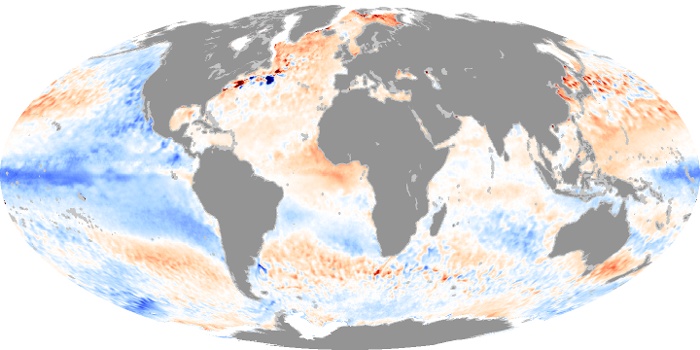
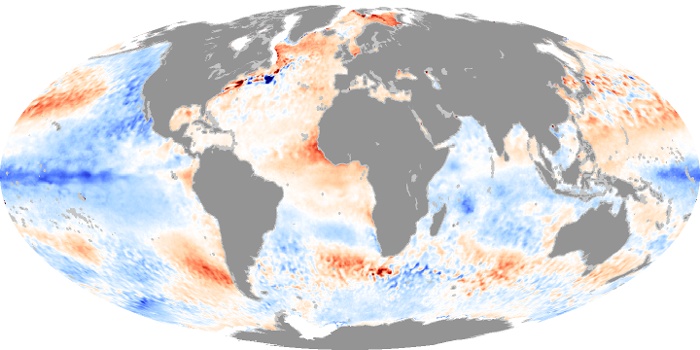
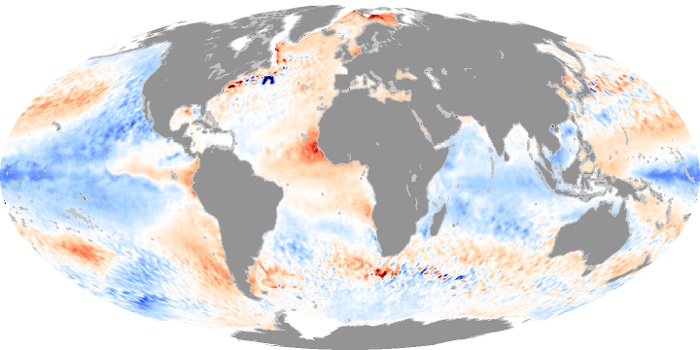
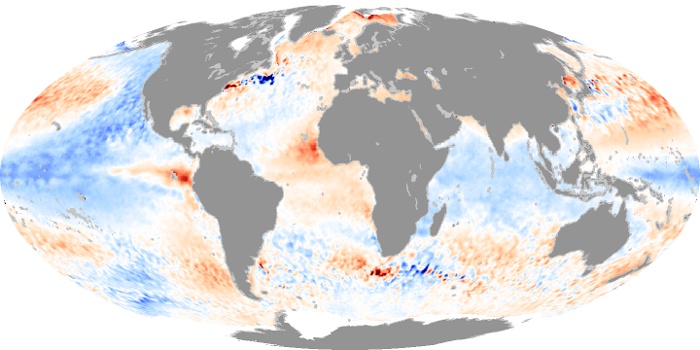
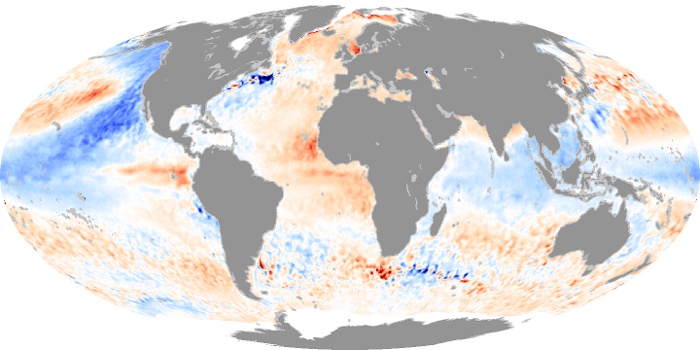
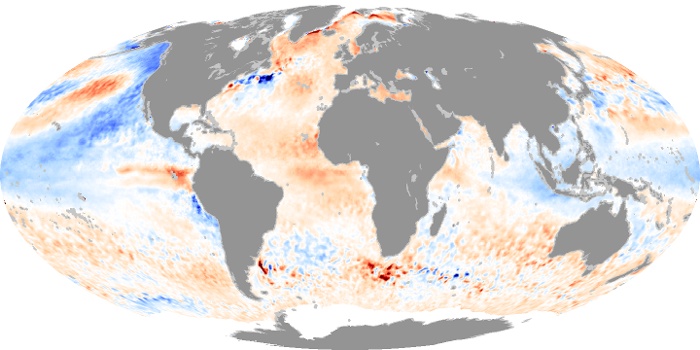
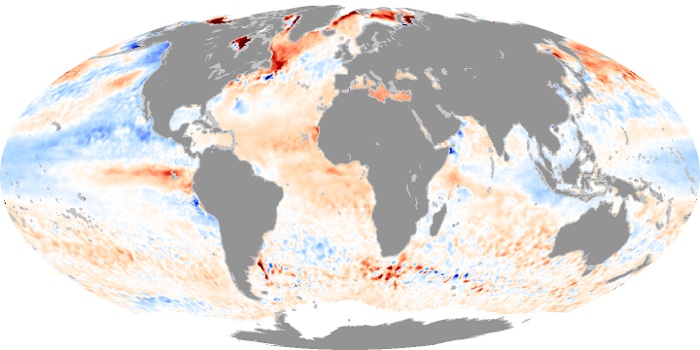
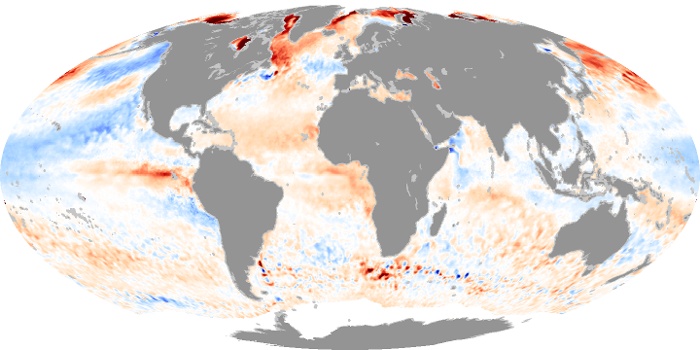
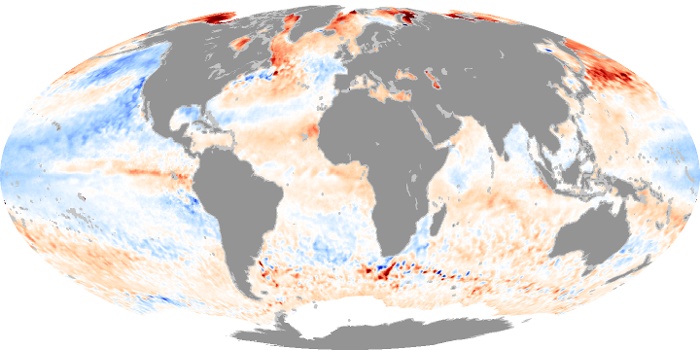
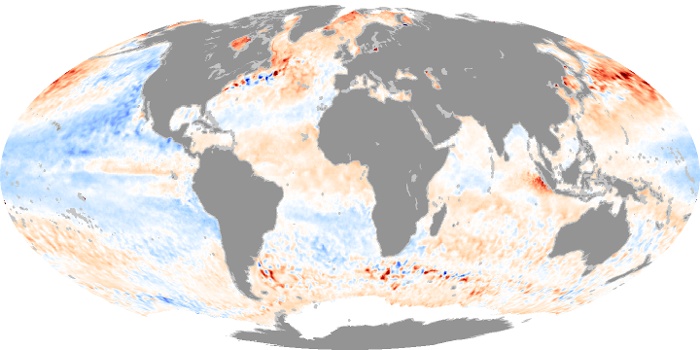
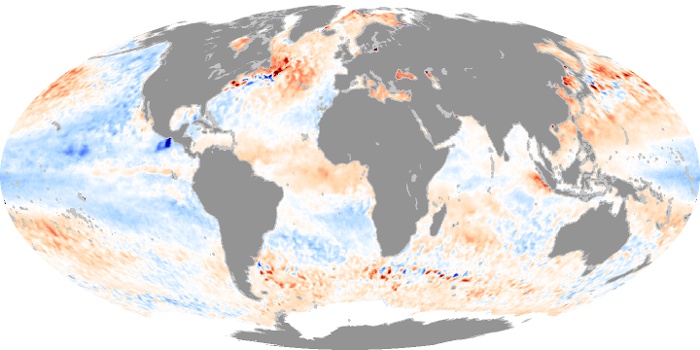
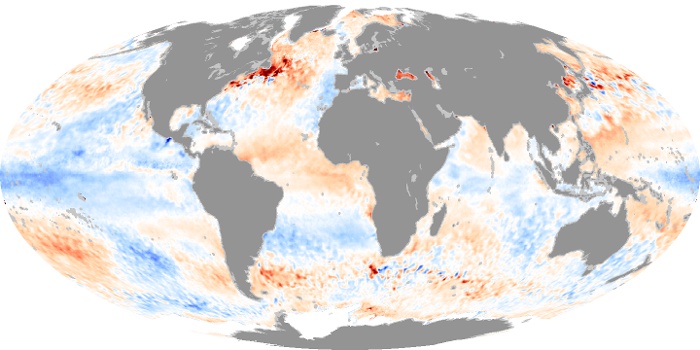
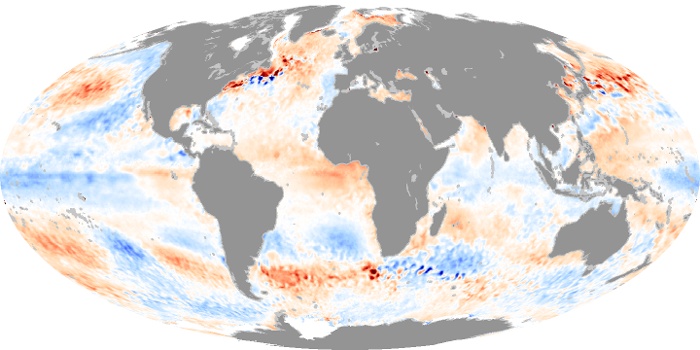
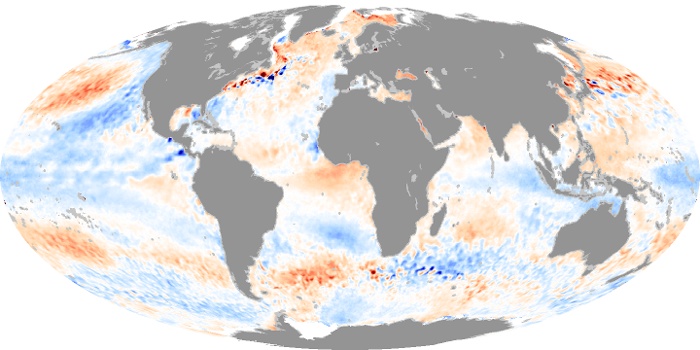
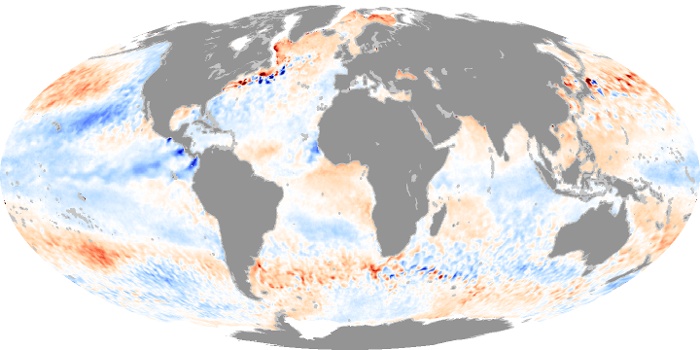
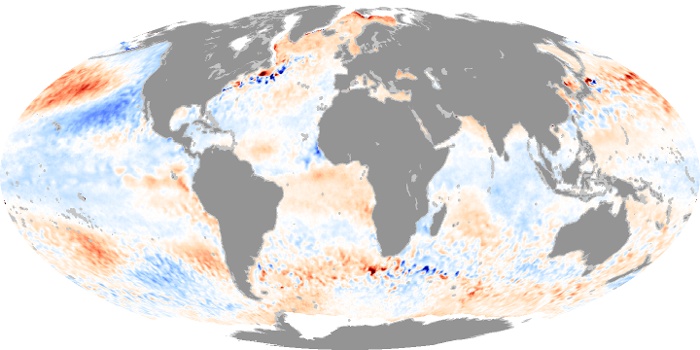
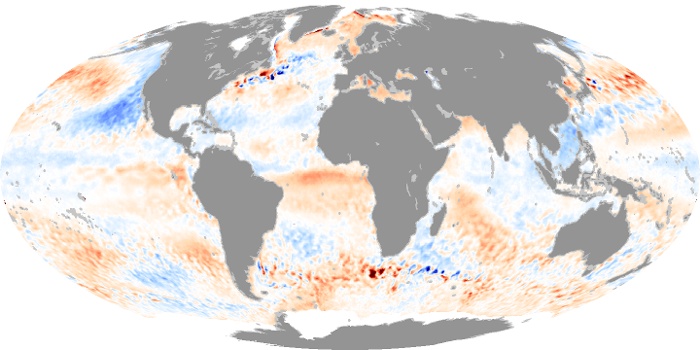
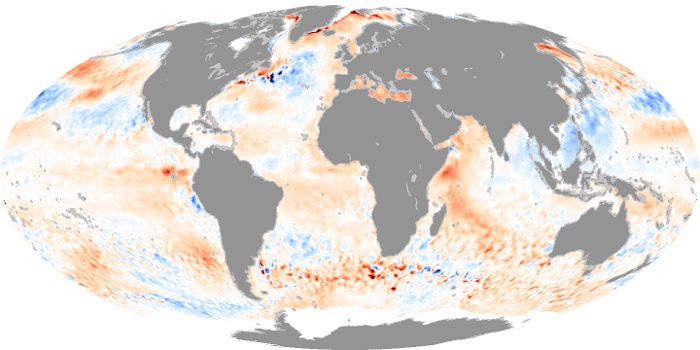
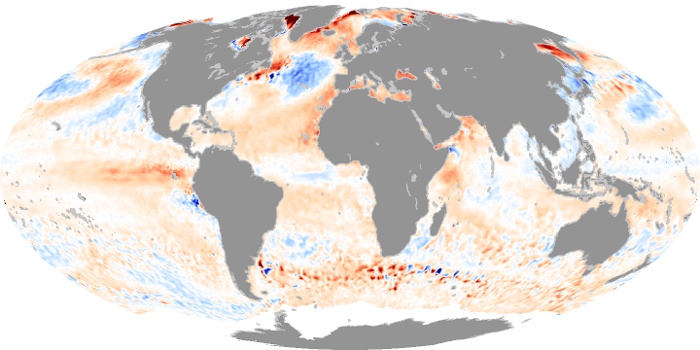
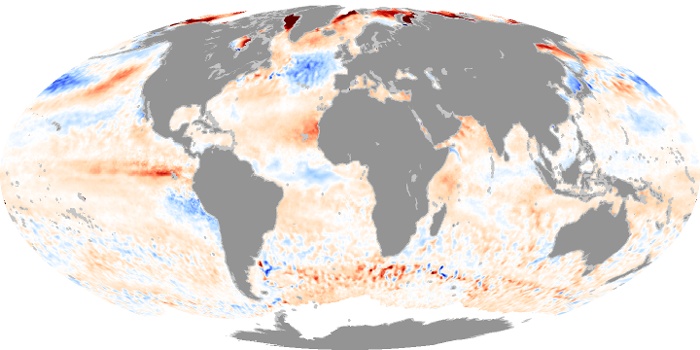
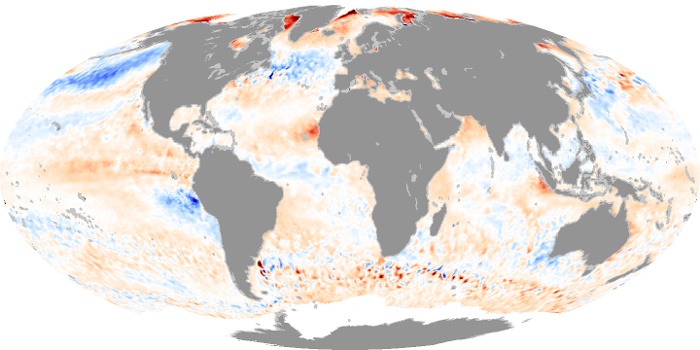
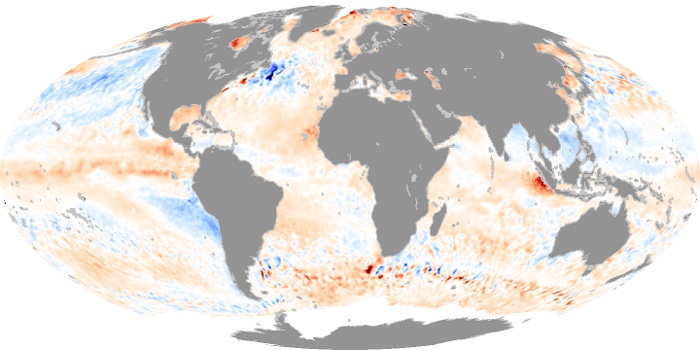
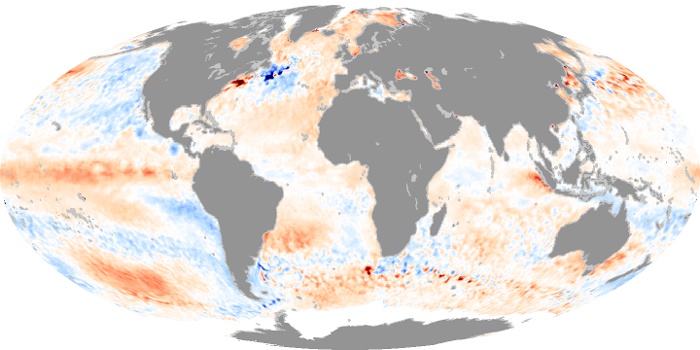
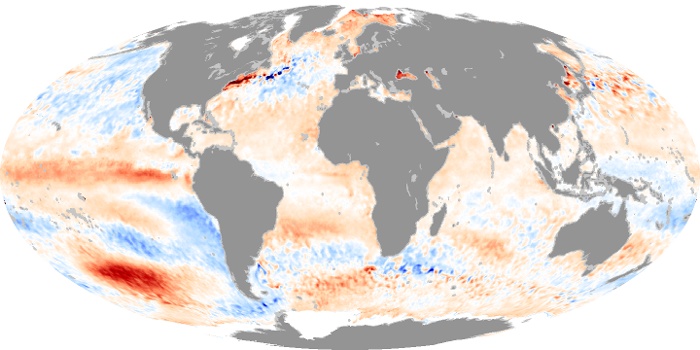
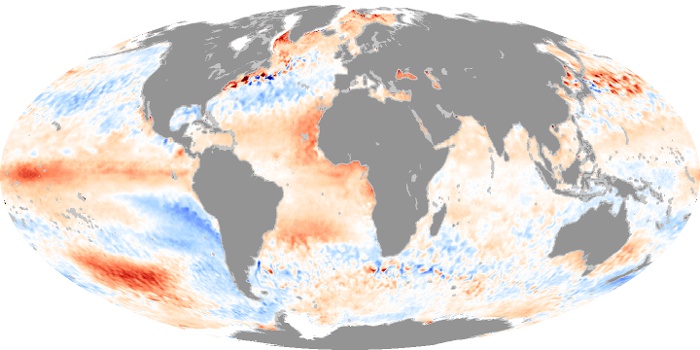
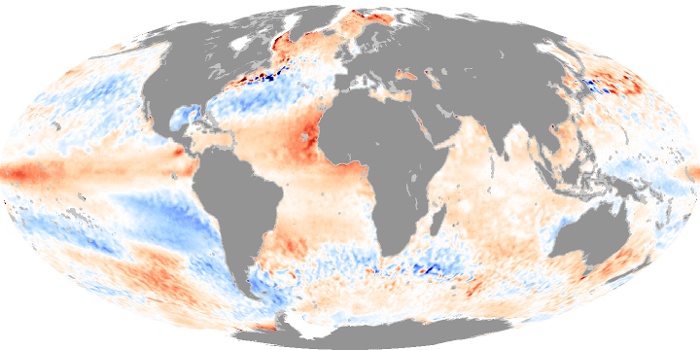
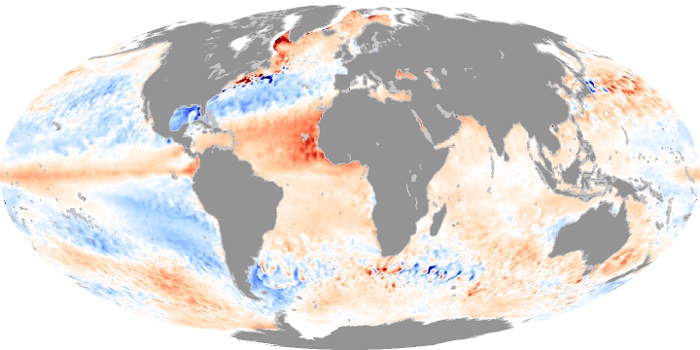
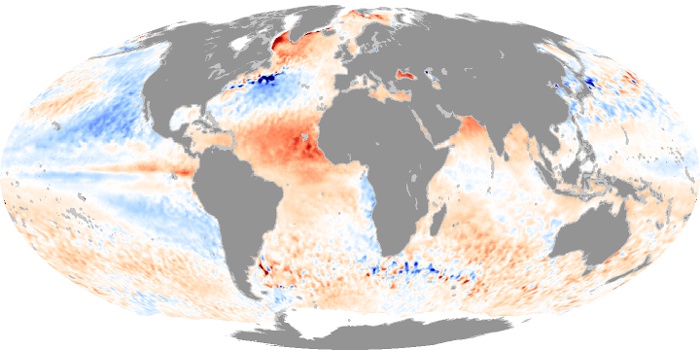
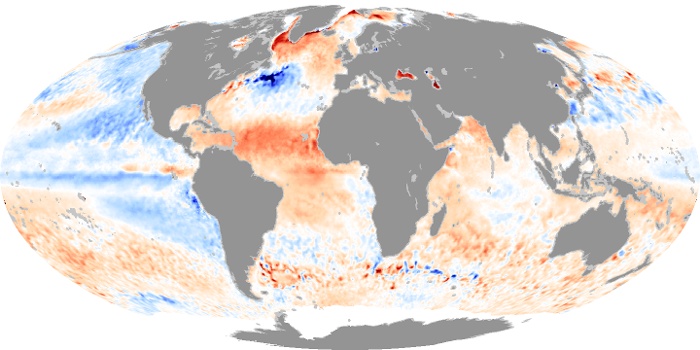
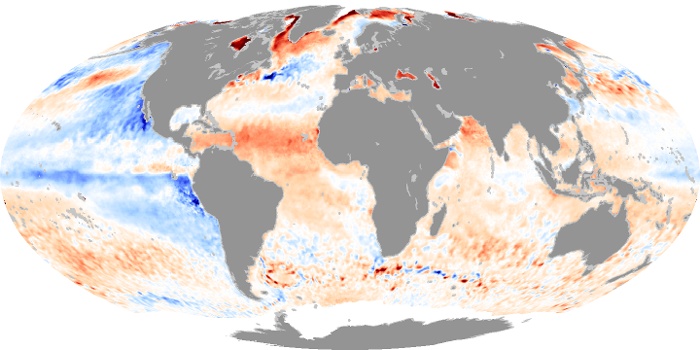
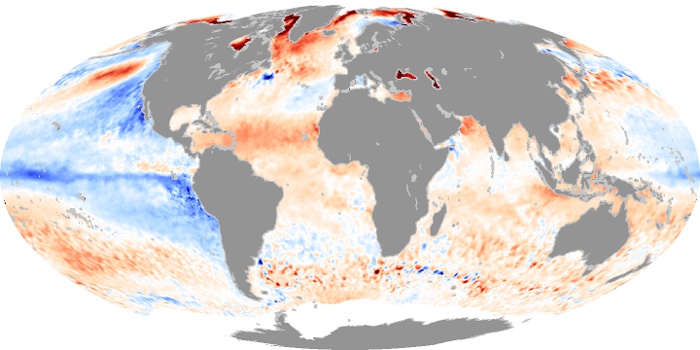
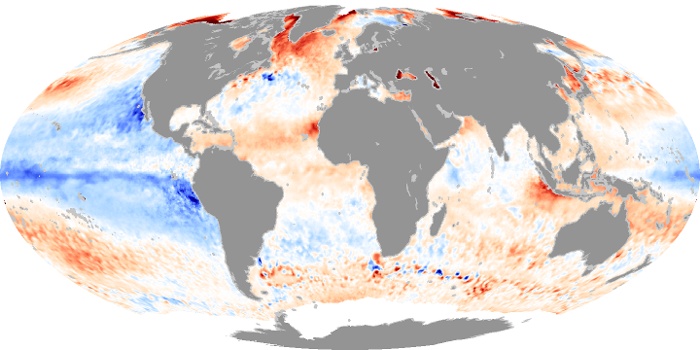
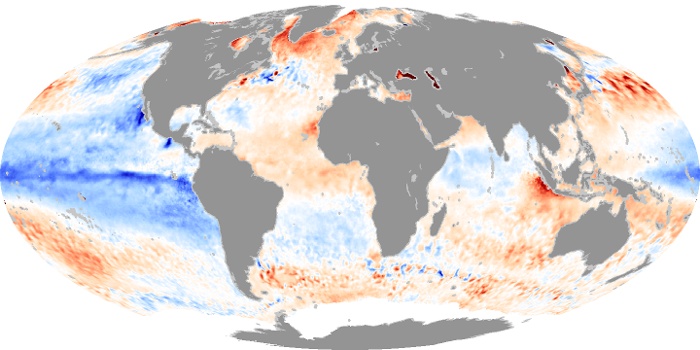
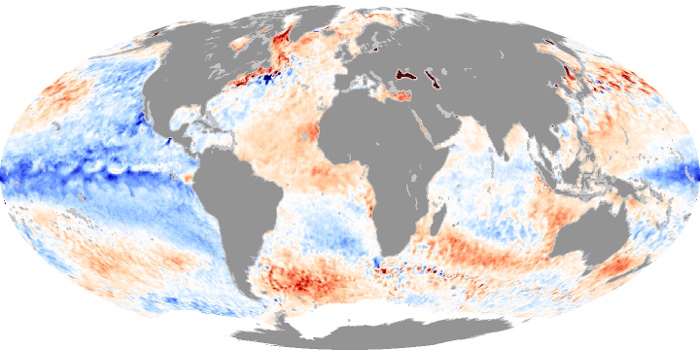
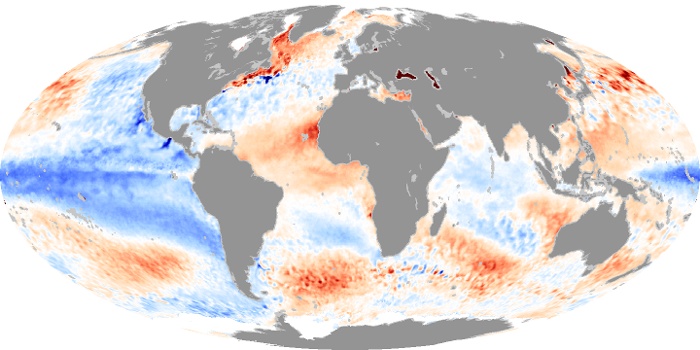
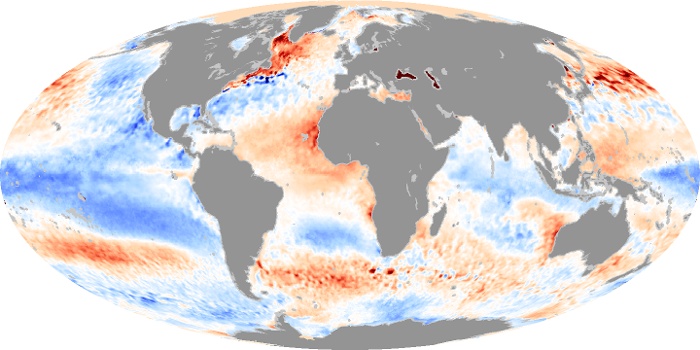
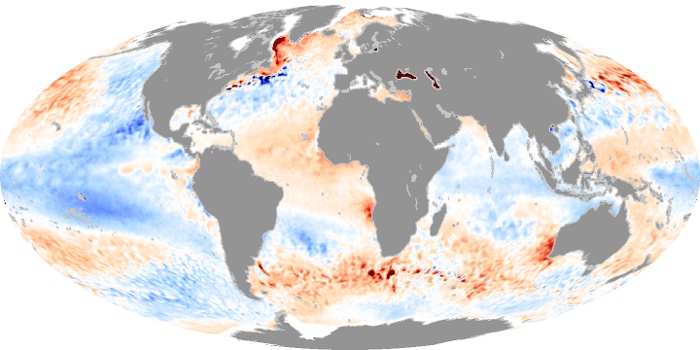
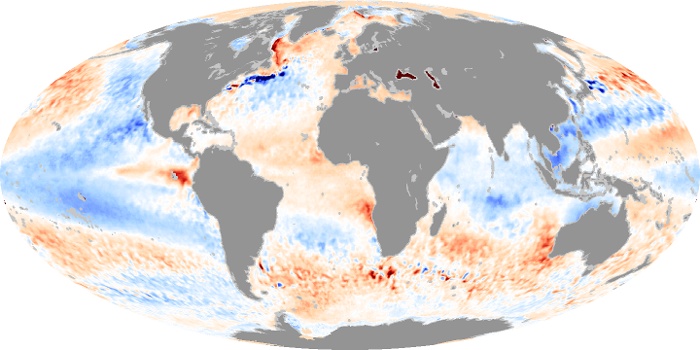
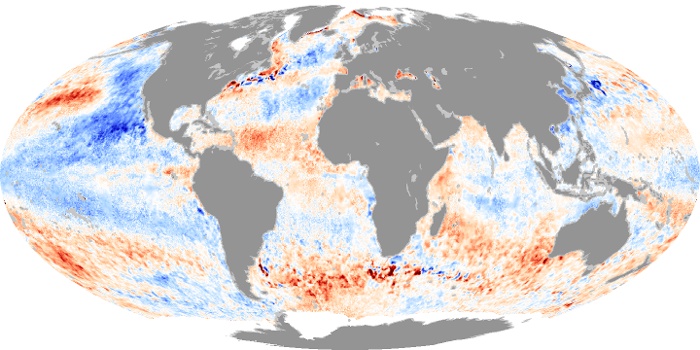
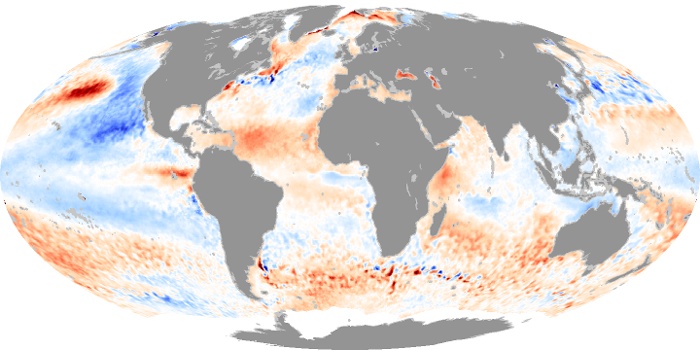
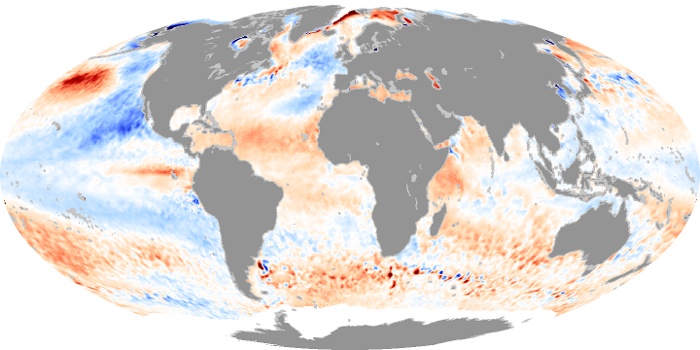
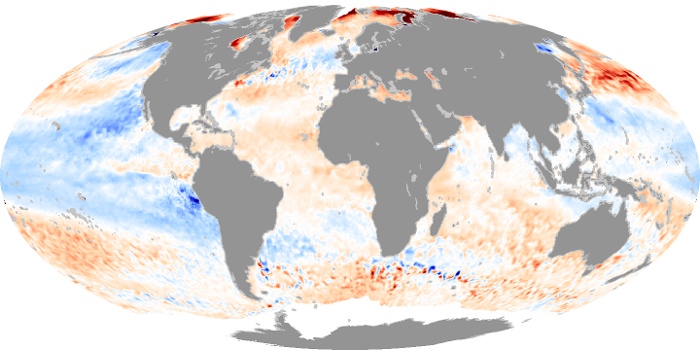
Sea surface temperature refers to the temperature of the top millimeter of the ocean. An anomaly is a departure from average conditions. These maps compare temperatures in a given month to the long-term average temperature of that month from 1985 through 1997. Blue shows temperatures that were cooler than average, white shows near-average temperatures, and red shows where temperatures were warmer than average. Regions for which no data were available are gray. The maps are made from data collected by the Advanced Microwave Scanning Radiometer-EOS (AMSR-E) compared to historical data collected by a series of National Oceanic and Atmospheric Administration (NOAA) satellites.
View, download, or analyze more of these data from NASA Earth Observations (NEO):
Snow Cover
Sea Surface Temperature Anomaly