Light from the Waves |
|||
For many years limnologists have been looking for an alternative to the Secchi disk. In the mid to late 1970s, Lillesand (then at Minnesota) along with colleagues in Wisconsin began to toy with the idea of using remote sensing satellites to observe lake quality from space. They reasoned that if water quality information could be extracted from images taken by orbiting satellites, the number of lakes monitored could be greatly expanded. For several years, the scientists experimented with data from early Landsat missions, but the data provided only very rough estimates of water quality. “We were able to get accurate measurements of water clarity only after Landsat Thematic Mapper (TM) data became available,” says Lillesand. Since 1972 the Landsat program has launched a series of Earth observation satellites into orbit, collecting image data of our planet’s surface. The sensors on the first three satellites in the series, launched in the 1970s, had a coarse spatial resolution (80 meters), and only four spectral bands. Later versions of Landsat have carried improved sensors—the Thematic Mapper instrument on Landsats 4 and 5, and the Enhanced Thematic Mapper Plus on the most recent of the series, Landsat 7, launched in 1999. The Thematic Mapper and the Enhanced Thematic Mapper instruments acquire images in seven different wavelengths of radiation reflected or emitted from the surface of the Earth. The wavelengths are in the visible, reflective infrared and thermal infrared parts of the spectrum. With a spatial resolution of 30 meters, the images are well suited for mapping and monitoring large features such as lakes. “It was the higher resolution and the addition of the blue band on the Thematic Mapper that gave us clearer results,” says Lillesand. The researchers found that when the amount of blue light reflecting off of the lake was high and the red light was low, the lake generally had high water quality. “It’s common sense. When you look at a clear lake from a distance it appears blue,” says Lillesand. Lakes loaded with algae and sediments, on the other hand, reflect less blue light and more red light. He further explains that the scientists first acquired Landsat Thematic Mapper data of the lakes with known Secchi depths. They then analyzed the satellite data to see if they could arrive at an image that displayed lake clarity as accurately as the Secchi disk measurements. In the end, Lillesand and his colleagues were able to retrieve water clarity maps and measurements from the satellite imagery that were as accurate as Secchi disk measurements. For roughly ten years, this knowledge was put to little use. Then, in the late 1990s, researchers at the
University of Minnesota launched a pilot project to measure the water quality of the lakes around the
Minneapolis/St. Paul metropolitan area. With a single Landsat TM image, they obtained coverage of all
the lakes in the seven-county region. They put the images of the lakes through an analysis similar to
that developed a decade earlier and classified lake water quality measurements for over 500 lakes. They
tested the Landsat water quality readings against Secchi measurements of sample lakes, and the two sets
of data matched up very closely. “With the Landsat images we ended up getting water quality measurements
of 10 times as many lakes as we would have with the Secchi disk data,” says Brezonik. The Minnesota team
then dusted off archived Landsat images dating back to the early 1970s and ran them through the same
procedure. They found that most of the lakes around the seven-county metro area have not changed in
quality over the past 25 years, with somewhat more (7 percent) increasing than decreasing (3 percent) in
quality. |
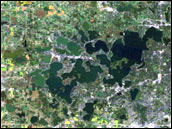
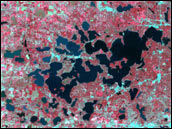 False Color (near infrared=red, red=green, green=blue)  water quality Satellite imagery enables the measurement of Water Quality over a much wider area than hand sampling using Secchi disks. These images (larger size) show Landsat image data and derived water quality measurements for Lake Minnetonka, Minnesota. The true-color image is similar to what is seen by the human eye, the false-color image incorporates data in near-infrared wavelengths, and the water quality image shows calculated Secchi disk transparency. Dark blue indicates high water quality, light green moderate water quality, and dark green poor water quality. (Images courtesy Upper Great Lakes Regional Earth Science Applications Center) |
||
The results proved so successful that a team of scientists led by Brezonik and Marvin Bauer, director of the University of Minnesota Remote Sensing and Geospatial Analysis Laboratory, expanded the survey to the entire state. The statewide project was funded in part by NASA’s Upper Midwest Regional Earth Science Applications Center (RESAC), which was established to monitor and analyze the natural resources in the Upper Great Lakes region. For the statewide water quality map, the researchers assembled the best of two year’s worth of cloud-free Landsat images taken of Minnesota. “We were able to get water clarity readings on 100 percent of the lakes larger than 20 acres using the satellite data,” Brezonik says. Of the 12,700 bodies of water classified as lakes in Minnesota, roughly 10,000 are larger than 20 acres. Once again, the readings matched up with the Secchi disk records. “When we put the map together, we did see a very strong north-south pattern in Minnesota,” says Brezonik. In the northeast Minnesota the lakes are very clear and the water quality is high. Moving south and southwest, the water clarity and quality diminishes. He believes there are two major reasons for this pattern. The first is that most of the farms and the people in Minnesota are in the southern half of the state. Nutrient-rich run-off from farms and urban developments has caused algae to grow. In the northeast, dense forests where fewer people live surround the lakes. He says the second reason is that the lakes in the south are generally shallower than those in the north. Deeper lakes generally absorb excess sediment and nutrients better. Though the team has not yet finished analyzing archived data from the past, Brezonik believes that the lakes have probably maintained the same level of quality over the past 15 years. |
The map to the left shows water quality in the counties surrounding Minneapolis and St. Paul, Minnesota. Lake Minnetonka, shown in the Landsat images above, is towards the left edge of the map. Satellite imagery is the only practical way to measure water quality on such a large scale. Dark blue, light blue, and green represent good water quality, while orange, red and purple indicate progressively worse wtaer quality. (Map courtesy Upper Great Lakes Regional Earth Science Applications Center) |