|
How Much Ultraviolet (UV-B) Radiation Are We Getting?
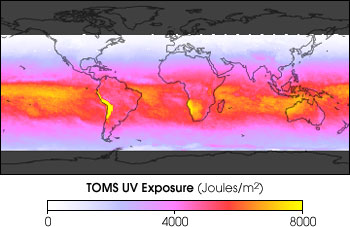
The second way to determine UV-B irradiance at the surface is by making estimates based on satellite measurements of ozone, cloud cover, and the other parameters described in What Reaches Earth’s Surface. Such estimates must take into account changes in the amount of radiation coming from the sun to the top of the atmosphere. To understand how researchers arrive at estimates of UV-B radiation reaching the Earth’s surface, one must first visualize a column of air that extends from the ground to the spacecraft above the atmosphere. Instruments on satellites orbiting the Earth (such as TOMS and OMI/Aura) measure the amounts of ozone, cloud cover, and aerosols in that column. Researchers can accurately calculate how much UV-B radiation there should be at the ground based on those measurements and on other conditions described earlier in this article (elevation, angle of sunlight, etc.). These values for each satellite field of view are incorporated into a global visualization of the data. Satellite measurements are critical to our understanding of global change such as increases in UV radiation. Their importance derives from their superior calibration over long periods, their ability to observe remote or ocean-covered regions, and their capability of providing consistent global coverage. We also need well-maintained, strategically located ground-based instruments to continue to verify the accuracy of satellite-derived estimates of surface UV exposure over the globe. Determining very long-term global trends still remains a problem because we have little historical data available before 1978, when NASA’s TOMS was first launched. Our need for historical data to detect and understand change underscores the critical importance of monitoring the Earth’ws processes for a long period of time, an objective to which NASA has committed in its Earth Observing System (EOS) program. In September and October over Antarctica, loss of ozone and consequent increased levels of UV-B radiation at the surface are now commonly twice as high as during other times of the year. High UV-B exposures occur in nearby regions at both poles, including some regions where people live, such as Scandinavia, most of Europe, Canada, New Zealand, Australia, South Africa, and the southern region of South America. Exposures get especially high in regions of elevated altitude, such as in the Andes Mountains, and in places that are relatively free of clouds at certain times of the year, such as South Africa and Australia during their summer (December to February). In July, very high exposures appear over the Sahara, Saudi Arabia, southwestern United States, and the Himalayan Mountain regions in northern India and southern China. The equatorial regions have their maximum exposure in the spring and autumn, with higher values during the autumn due to decreased cloud cover.
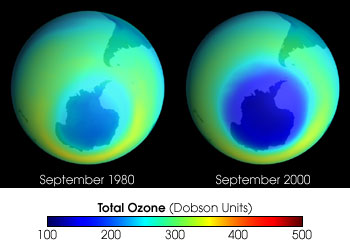
The decrease of ozone amounts in the upper atmosphere above Antarctica and nearby regions between 1980 and 2000 has caused an increase in the amount of ultraviolet radiation striking the Earth and catalyzed extensive efforts by the scientific community to understand ozone chemistry. (Image courtesy NASA GSFC Scientific Visualization Studio, based on data from TOMS) We have no reliable long-term record of actual UV-B exposure from ground-based measurements, but we do have accurate short-term estimates of decreasing ozone, which we know leads to an increase in UV-B exposure at the surface. In Scientific Assessment of Ozone Depletion: 1998, the World Meteorological Organization states that during 1998 at mid-latitudes in the north, between 35 and 60 degrees N, average ozone abundances were about 4 percent (per satellite measurements) or 5 percent (per ground-based measurements) below values measured in 1979, with most of the change occurring at the high end of that latitude zone. That means that recent UV-B radiation doses are correspondingly higher at those latitudes than historical levels (by amounts that depend on specific wavelengths). In the tropics and mid-latitudes, between 35 degrees S and 35 degrees N, both satellite data and ground-based data indicate that total ozone does not appear to have changed significantly since 1979. next: Predictions and
Monitoring |
Ultraviolet Radiation
U.S. Department of Agriculture UV-B Monitoring Program National Science Foundation, Office of Polar Programs Ultraviolet Monitoring Network U.S. Environmental Protection Agency (EPA) (A new browser window will open for each.)m/span> |