Modeling the Earth’s Vegetation |
|||
With partially validated LAI values in hand,
the researchers then wanted to
know if their values would work in a climate model. More specifically, the
scientists wanted to incorporate these data into a computer model of the climate
to observe how changes in plant growth from year to year influence near-surface
temperatures. To get the clearest results, the scientists created LAI global
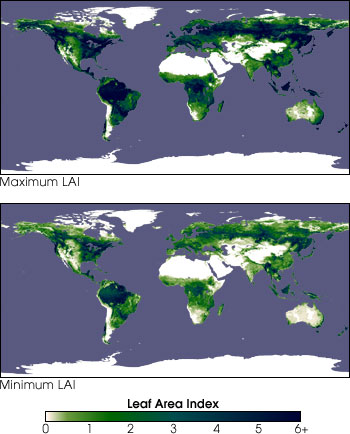
data sets showing minimum and maximum values over a 12-month period. To form
their minimum LAI data set, they examined their ten years of data and found all
the lowest LAI values in every region of the world for each month in the
calendar year. They then put these values together into one twelve-month data
set. By doing so, they essentially lumped all the droughts and abnormally dry
spells around the world over a ten-year period into one year-long set of maps.
They created the maximum LAI data set in much the same way, except all the
abnormally wet spells were lumped into one data set (Buermann et al. 2001b). |
|||
The researchers ran each data set through a computer simulation of the climate that could compute the effects of plant growth on surface temperatures, cloud cover, and rainfall. The model runs produced results that were much more in line with field observations than those obtained from non-satellite-derived LAI values. “We discovered that the [increase in vegetation] between the wet and dry simulation caused over a 1°C difference in the near-surface temperatures in many areas,” says Buermann. Generally, more transpiration occurred in the wet scenario. The transpiration cooled the surface both directly by the release of water to the atmosphere and indirectly by giving rise to additional cloud cover, which effectively blocks incoming solar radiation (Buermann et al. 2001b). Buermann’s team is now using their process to investigate whether global warming over the past two decades has affected plant growth in the Northern Hemisphere. A study released last year by scientists at Boston University and NASA’s Goddard Space Flight Center suggests that yearly plant growth has increased in northern latitudes over the last twenty years due to an elongated growing season, possibly brought on by global warming (Zhou et al. 2001). Since the team used NDVI values to measure plant growth, there is still much speculation over whether the increase is due to a longer growing season, the presence of more carbon dioxide in the air, or simply due to more rainfall. Buermann and his colleagues plan on retrieving LAI measurements of the region using the same satellite data. They then hope to determine what is causing the increase in plant growth. “With LAI, we’d be able to measure precisely when the leaves start to grow, the density of the leaves during the growing season, and when they fall off,” says Buermann. “We can even tell how much carbon the plants draw down each year.” In the future, the team will continue to take measurements of the LAI values of the Earth’s vegetation using the MODIS instrument aboard NASA’s Terra and Aqua satellites. The MODIS instrument is a lot like the AVHRR in that it follows a near-polar orbit and gathers global-scale data. MODIS’ measurements, however, are taken at a more moderate resolution (500 meters per pixel) over the entire Earth’s surface almost every day. The MODIS instrument also has many more light sensors than AVHRR. MODIS will allow the Boston team to produce more accurate LAI readings of the entire Earth every eight days. With such data, they will continually be able to monitor the Earth’s vegetation and work towards a full understanding of the role vegetation plays in climate change. References
2. Buermann, W., Y. Wang, J. Doug, L. Zhou, X. Zeng, R. E. Dickinson, C. S. Potter, and R. B. Myneni, 2001a: Analysis of multi-year global vegetation leaf area index data set, J. of Geophys. Res., (submitted). 3. Buermann, W., J. Dong, X. Zeng, R. B. Myneni, and R. E. Dickinson, 2001b: Evaluation of the utility of satellite based vegetation leaf area index data for climate simulations, J. of Climate, 14, 3536-3550. 4. Zhou, L., C. J. Tucker, R. K. Kaufman, D. Slayback, N. V. Shabanov, and R. B. Myneni, 2001: J. of Geophys. Res., 106, 20,069-20,083. |
In addition to evaluating Leaf Area Index (LAI) on a month-by-month basis, the Boston University researchers also investigated the total variability of LAI from 1981 to 1991. The scientists combined the maximum and minimum LAI values into a pair of datasets (shown at left). These data were then used in climate models. The models showed a decrease in surface temperature and increase in rainfall (primarily due to increases in transpiration) for regions with maximum LAI, a result which agrees with real-world observations. (Data provided by Boston University Climate and Vegetation Research Group. Images by Robert Simmon) To learn more about modeling the interactions between climate and biosphere, read Modeling Earth’s Land Biosphere. |