Solving the thickness problem turns out to be important for both land and sea ice. Unlike land-based ice, melting sea ice won’t contribute to sea level rise because the ice mass is already in the water. But understanding changes in sea ice is an important piece of the climate change equation. “Sea ice is one of the major knobs on global climate and weather, and we don’t know how turning that knob is going to affect things,” says Wagner.
Sea ice reflects light from the Sun. As it disappears, darker, open water will absorb more heat in the summer and sea ice will return more slowly in the winter. The additional heat in all seasons will moderate Arctic temperatures, and that will melt permafrost and change the Arctic landscape.
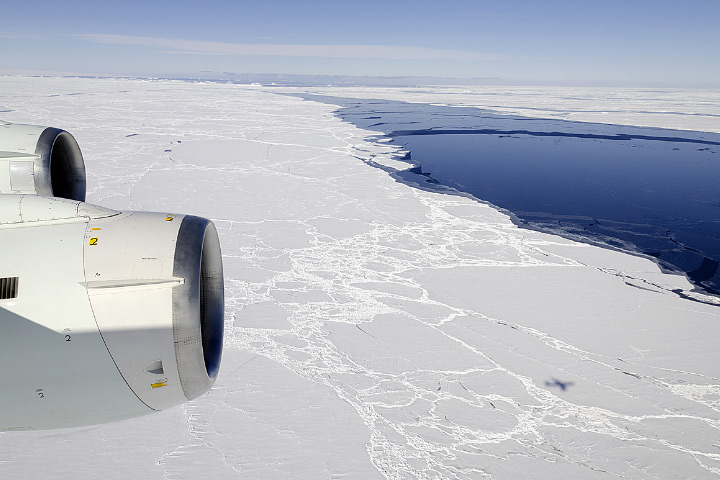
Leads of open water in the polar oceans are much darker than the surrounding sea ice, and absorb sunlight that would otherwise be reflected away. As global warming causes sea ice to decline, a vicious cycle may lead to more rapid melting. (Photograph courtesy Michael Studinger, NASA GSFC.)
“The Arctic is now warming faster than the rest of the planet, probably because of the loss of reflective sea ice,” says Ronald Kwok, a member of the IceBridge science team from NASA’s Jet Propulsion Laboratory.
The changes will extend beyond the Arctic. “As you take the ice away, you will change North American weather patterns, but no one knows how,” says Wagner. “It’s possible that you could radically alter precipitation maps of the United States.”
Melting sea ice could change global ocean circulation. In the far North Atlantic Ocean, surface waters cool and sink, forming deep water. This sinking helps drive the “global conveyor belt,” the ocean currents that move warm water from the tropics toward the poles. Conveyor-belt currents, like the Gulf Stream, influence weather patterns around the world.
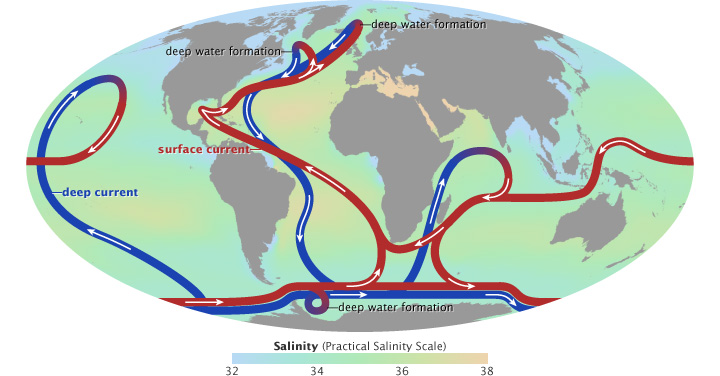
Warm surface currents (red) cool and sink in the Arctic, forming deep water. Fresh water from melting sea ice could weaken this global circulation. (Map by Robert Simmon, adapted from the IPCC 2001 and Rahmstorf 2002.)
Melting sea ice could weaken the conveyor belt. “Sea ice is relatively fresh water,” says Kwok. As it flows out of the Arctic and melts, it adds a layer of fresh water to the surface of the North Atlantic. The fresh water is less dense than salty water and may not be dense enough to sink, weakening the conveyor belt.
It’s not clear exactly how the loss of Arctic sea ice is affecting the planet today and what the future holds. Computer models can help scientists explore the connections between sea ice, ocean circulation, heat, and weather patterns. “The data from ICESat and IceBridge are critically important for improving those models,” says Wagner.
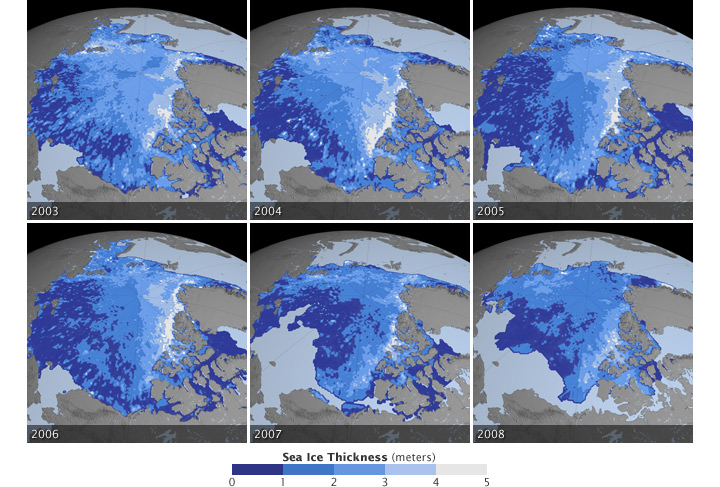
Models require measurements of both sea ice extent and thickness. Extent is a relatively simple measurement made from satellite instruments that use microwaves to see the ice through clouds. Thickness is calculated by measuring the amount of ice floating above the water surface, says Kwok. When sea ice floats, only a tenth of it stands above the water. “We know the density of ice, so we can calculate the thickness. If we measure 20-30 centimeters above the water, we know that the ice is two to three meters thick.”
Scientists have been able to estimate sea ice thickness with ICESat and IceBridge by measuring the height of ice above the water and comparing it to the height of the water itself. The problem is snow: just a few centimeters on top of the ice can throw off the ice thickness estimate. But short of drilling holes and making occasional sonar measurements from a submarine or moored sonar instrument, scientists haven’t had many opportunities to figure out snow and sea ice thickness. Now IceBridge carries the instruments to separate the snow layer from the ice beneath.
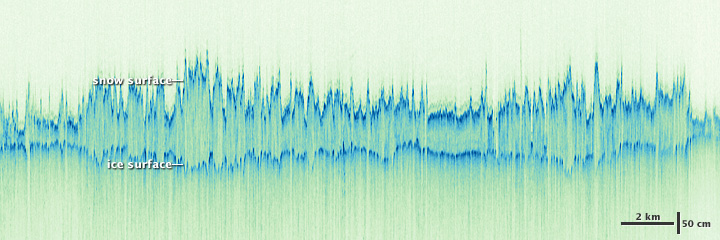
Radar instruments that distinguish snow from ice enable scientists to refine measurements of sea ice thickness. (Image by Jesse Allen and Robert Simmon, using data from the Center for Remote Sensing of Ice Sheets.)
Early results from the snow radar show that, on average, 30 centimeters of snow sit on top of seasonal ice (ice that melts and re-forms every year) at the end of the season. More snow sits on older, multi-year ice. By understanding how much snow is on top of the ice, scientists now have a more accurate estimate of how thick the ice actually is and how much it is thinning.
“Snow also indicates how much moisture is being delivered from lower latitudes to the Poles,” says Kwok, “which is an independent indicator of climate change.”
