| Floyd's Lasting Legacy | |||
|
Unfortunately, due to heavy cloud cover over eastern North Carolina for an extended period of time in September 1999, high-resolution satellites like Landsat 7 weren't able to obtain clear views of the surface until well after Hurricane Floyd had passed. "This was an interesting storm sequence," says Mertes. "You had three major storms go through the system in a relatively short time-first Dennis, then Floyd, then another tropical storm only days later. After Floyd, the system had already generated a lot of sediment discharge. It was interesting to observe which parts of the landscape continued to generate sediment with added flooding from the tropical storm and which parts didn't. "Alternatively," she continues, "it was interesting to identify point sources of clear water. Where was the water running off the landscape cleanly? Sediment concentration maps can tell you that." To determine how sediment was transported in surface waters, Mertes again examined how much light was reflected or absorbed by the water. She explains that the relationship between sediment concentration and backscattered light is not linear. As photons of light are reflected by sediment particles-often bouncing off many suspended particles like a pinball before being sent back up through the atmosphere-the length of the path that the photons travel increases, thus giving the water particles more opportunity to absorb more of the light. So, as scattering increases, the intensity of the light reflected back up through the atmosphere increases non-linearly because of competition for the light by absorption (Mertes et al. 1993). Mertes observes that this effect varies at different wavelengths. She finds that the wavelengths between 400 nm and 1000 nm are the most effective for estimating sediment concentrations. Mertes has combined NASA data and her own laboratory data of reflectance measurements over water samples containing a variety of concentrations of different types of sediments to create a "catalog" of spectral signatures corresponding to sediment concentration. By cross comparing the spectral curves of the remote sensing data from the North Carolina floodwaters to the spectral curves of the laboratory samples, she can estimate the values of sediment concentrations in the rivers accurately to within plus or minus 20 milligrams per liter (Mertes et al. 1993). By the time Landsat 7 was able to acquire a clear view of North Carolina (September 30), Floyd had passed and most of the floodwaters were coming from the tropical storm. Mertes found that, by this time, the waters in the flooded areas of the Neuse, Tar, and Roanoke Rivers were fairly clear. Most areas contained less than 100 mg of sediment per liter of water. Zooming in on a roughly 10-square-kilometer region around Kinston, NC, she produced "false color" maps of the areas of open flooded areas and flooded areas covered with vegetation along the Neuse River. She also created maps to show relatively high and low sediment concentrations. On the map, zero indicates no sediment in the water, 100 milligrams per liter is an intermediate value, and 300 milligrams per liter is considered a high concentration. As observed in the September 30, 1999, Landsat 7 image, surface sediment concentrations typically were in the range between 0 and 100 milligrams per liter in the Roanoke, Tar, and Neuse River channels and flooded areas. Although not directly comparable, depth-integrated concentrations of sediment reported by NAWQUA (United States Geological Survey) for the years 1993-1995 at the Kinston gauge on the Neuse River indicate a range of concentrations in the water column from less than 10 to a maximum of 79 milligrams per liter. Surface sediment concentrations are typically at least 2 to 3 times lower than average concentrations. 
|
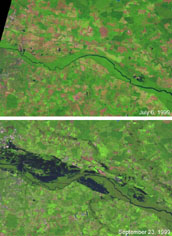 This pair of Landsat 7 images shows the before and after effects of Hurricane Floyd on the area where the Tar and Pamlico Rivers meet in Washington, NC. The top image was taken July 6, 1999, (before the hurricane) and the bottom was taken September 23, 1999.click to enlarge |
||
Therefore, says Mertes, although the concentrations in most of the rivers in this image were carrying relatively high sediment loads, the concentrations were not unusual. Given that the flooding experienced on September 30 followed three major storms in rapid sequence, she suspects sediment loads were lower on that date because much of the sediment available for erosion in the watersheds had already been transferred out of the system during the earlier storms. "A lot of these floodwaters are probably left over from saturated flood regions created by Floyd that got filled up again," notes Mertes. "We're really looking at the legacy of Floyd. We see patches of clear water on flood plains and then some river water flowing into the flood plains. "This case study is good for showing how antecedent flood waters affect inundation patterns," she continues, "and how flooding occurs over time. It demonstrates that floods often happen in ways we haven't thought of." Although she can tell you how much sediment is suspended near the surface of floodwaters, she cannot say what the sediment is made of. Sediment "species analysis" is another technique she says other scientists can employ to identify types of sediment, but requires finer spectral resolution than is available with ETM+ data. She says MODIS data may provide sufficient spectral resolution to distinguish sediment type, and future study will test this hypothesis. "At present, I don't do sediment species analysis," Mertes states, "but I would love for someone to take my images and look upstream to determine point sources enabling them to identify sediment types. That's one way these maps can be used." References
Gomez, B., Leal A.K. Mertes, J.D. Phillips, F.J. Magilligan, and L.A. James, 1995: "Sediment Characteristics of an Extreme Flood - 1993 Upper Mississippi River Valley." Geology, Vol. 23, No. 11, pp 963-966. Mertes, Leal A.K., 1997: "Documentation and significance of the perirheic zone on inundated floodplains." Water Resources Research, Vol. 33, pp. 1749-1762. Mertes, Leal A.K, Milton O. Smith, and John B. Adams, 1993: "Estimating Suspended Sediment Concentrations in Surface Waters of the Amazon River Wetlands from Landsat Images." Remote Sens. Environ, Vol. 43, pp. 281-301. Witte, W. G., C.H., W., Usry, J. W., Morris, W. D., and Gurganus, E. A., 1981, Laboratory measurements of physical, chemical and optical characteristics of Lake Chicot sediment waters.: NASA Technical Report, no. 1941, Hampton, Virginia, Langley Research Center. |
These detailed maps of the Neuse River flooding in the Kinston, NC, area were produced using Landsat 7 data acquired on Sept. 30, 1999. In the top "false-color" image, red pixels indicate where there is turbid water, green shows vegetated or forested areas, yellow indicates pasture, blue shows clear water, and blue-green shows flooded forest lands. In the middle image, the colors show more clearly the locations of open water (red pixels) and flooded vegetation (green). All other pixels are masked (black) for clarity. Comparing the middle image with the top image shows more clearly the areas of flooded vegetation that were difficult to discern in the top image and were therefore not classified as "flooded vegetation" due to limitations in the flood detection technique used. The bottom image shows variations in the concentrations of suspended sediment near the surface of the Neuse River and the surrounding areas in flood. Red and yellow pixels show high sediment concentrations, greens are intermediate values, and blues indicate where the water contains low levels of sediment. Note that areas shown in this image are only open water areas; all other pixels are masked black for clarity. (Images courtesy Leal Mertes) 
|
||
