The Winter Bomb |
|||
Over the weekend of Jan. 22-23, meteorologists were tracking a complicated upper atmospheric pattern made up of two separate but converging "frontal systems." Fronts are the leading edge of large air masses moving within the troposphere. Along and behind a front, the rate of change in meteorological variables—such as temperature, wind speed and direction, air pressure, and dew point (humidity)—is usually greater than ahead of the frontal zone. |
|||
 | |||
Uccellini explains that there was a strong high-pressure system over the northern and eastern portions of the United States. Here, "high pressure" refers to a greater number of molecules of gases in the atmosphere. The more molecules—mainly nitrogen and oxygen—you pack into a given column of air, the higher the pressure. Think of blowing up a balloon; the more air molecules you breathe into it, the greater the pressure pushing outward and the more the balloon expands. So the high-pressure was pushing southward from Canada, bringing frigid Arctic air, at the surface down the eastern side of the Appalachian Mountains, while a low-pressure "trough" was pushing eastward from the west. Here, "trough" refers to the region of minimum pressure, or fewest molecules. The opposite of a high-pressure zone, a trough behaves like a vacuum cleaner—sucking up molecules to fill the vacancy of so few molecules. Thus, troughs tend to create an upward motion of air masses. According to Uccellini, these high- and low-pressure systems converged over Georgia and South Carolina in such a way that a storm began to develop. The trough was sucking up moisture and lifting it high into the troposphere. The cold Canadian air brought by the high-pressure front was in place at the surface supplying ample cold air for snow. On Monday, towards the east along the coastline it began to rain, but further inland it began to snow. As the low pressure system continued to develop, it began moving in a large-scale circular motion, similar in size and energy to that typically observed in tropical storms that form hurricanes. Wind speeds increased on Monday until they peaked with gusts of around 50 miles per hour along the North Carolina coastline. These air masses drew up vast amounts of moisture from the ocean and transported it inland into the much colder air where it froze and fell as fat flakes, dropping almost a foot of snow on Charlotte, North Carolina over a 12-hour period. (Ice crystals at or near the 32°F, or 0°C, freezing point are very "sticky" to the touch and tend to aggregate into much larger snowflakes; whereas in much colder conditions, snow flakes tend to be smaller because colder air holds less moisture.) |
This weather map (legend), from 6:00 PM EST January 23, shows the two fronts that would later converge to form the surprise snowstorm. A low pressure system (the "L" at lower left) was bringing warm, wet air to the east. Meanwhile, a high pressure system (the "H" at top) was moving south from Canada, lowering temperatures along the East Coast. (Map courtesy National Weather Service) | ||
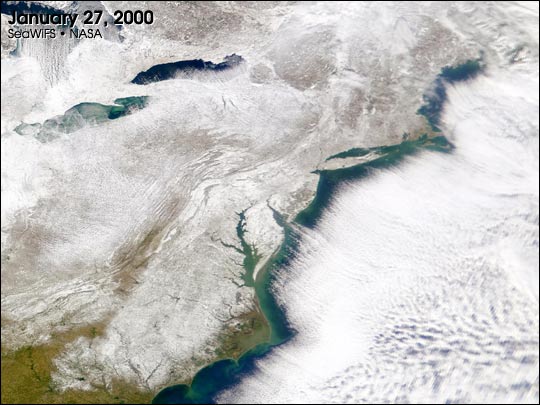 | |||
Moving slowly, the storm trundled northward and laid a thick white carpet on almost the entire eastern seaboard, two feet deep in places such as the suburbs of Raleigh, NC, and Annapolis, MD. Forecasters call such a meteorological event a "winter bomb." What did they learn from this one?
|
Snowfall totals varied from 20" in Raleigh. NC (an all-time record), 14" in Washington, DC, to 5" in both New York and Boston. Areas along the coast got sleet and freezing rain along with the snow. (Image courtesy SeaWiFS Project, NASA GSFC) | ||
