As Hurricane Ian headed toward a third landfall, this time in South Carolina, NASA scientists were scrutinizing recent imagery of the storm and analyzing the forces that made it so catastrophic.
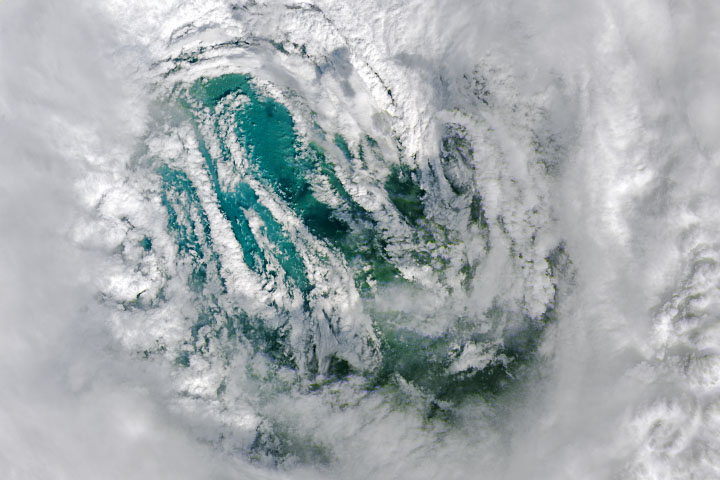
On September 28, the Landsat 8 satellite passed directly over Ian’s eye as the storm approached southwest Florida. The natural-color image above was acquired by the Operational Land Imager (OLI) at 11:57 a.m. local time (15:57 Universal Time), three hours before the storm made landfall in Caya Costa.
The eye of a hurricane is a circular zone of fair weather at the storm’s center. It is surrounded by a towering ring of extremely powerful thunderstorms called an eyewall, the part of the hurricane with the strongest winds. The swirling clouds along the edges of the eyewall are mesovortices—small-scale rotational features found in hurricanes with unusually strong winds.
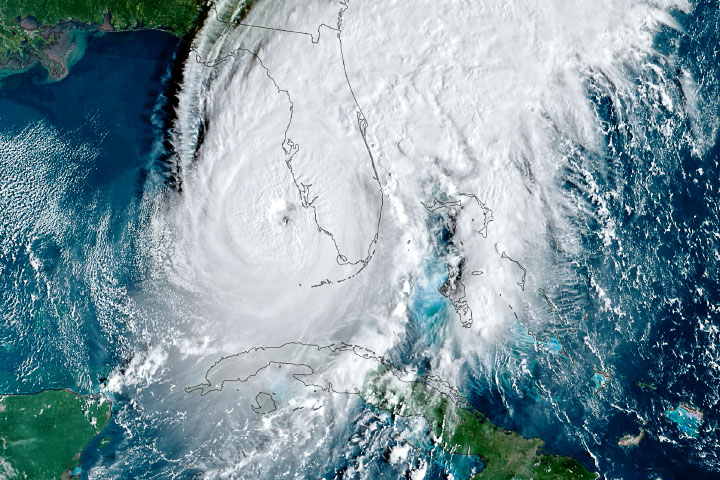
When Ian’s eyewall crashed into Florida, its maximum sustained winds were 150 miles (240 kilometers) per hour, according to the National Hurricane Center. That is the equivalent of a category 4 storm on the Saffir-Simpson wind scale and fast enough to tear the roofs off homes and snap power lines.
“Those breathtaking low-level cloud swirls in Ian’s eye might provide clues into some important processes that affect a hurricane’s intensity,” said Justin Whitaker, a researcher with NASA’s Short-term Prediction Research and Transition Center (SPoRT). The SPoRT team, based at Marshall Space Flight Center, focuses on improving weather forecasts using NASA data. “At SPoRT, we’re studying how these inner-core asymmetries can affect a hurricane’s structure, its potential to intensify, and whether lightning will occur within the storm’s eyewall.”
The animation above shows the evolution of Ian’s wind field between September 25–29, 2022. The strongest winds appear bright yellow; more moderate winds are shades of orange and bright purple. Atmospheric data have been run through NASA’s Goddard Earth Observing System Model (GEOS), a data assimilation model that scientists use to analyze global weather phenomena. The GEOS model ingests wind data from more than 30 sources, including ships, buoys, radiosondes, dropsondes, aircraft, and satellites. The model output is spaced out on a 0.25 to 0.3 degree grid, so it does not necessarily capture peak gusts as measured by individual instruments on the surface.
As Ian barreled past Cuba and passed into the Gulf of Mexico on September 27, the eye was roughly 12 miles (20 kilometers) wide. As the storm churned to the northeast, satellites observed a second, larger eye forming around and eventually enveloping the original eye, a process known as an eyewall replacement cycle. Eyewall replacement cycles are common in strong hurricanes, typically causing the wind field to spread out over a larger area.
“An eyewall replacement cycle occurs when a hurricane develops concentric eyewalls and the inner eyewall collapses,” explained Charles Helms, an atmospheric scientist at NASA’s Goddard Space Flight Center. “As a result, a hurricane’s eye grows much larger, and these cycles are often associated with a temporary pause in intensification. There is still much we do not understand about these cycles, and it remains an active topic of research in the tropical community.”
In Ian’s case, the eyewall replacement cycle caused the eye to expand to a width of 34 miles (55 kilometers), causing the eyewall to expand as well. As some hurricane experts have noted, this meant that the entire extent of Charley’s hurricane-force winds would have fit inside Ian’s eye. (Hurricane Charley was a compact category 4 storm that hit the same part of Florida in 2004.)
“While Hurricane Charley had a similar intensity to Hurricane Ian and caused considerable damage to the immediate region as well as across central Florida, Charley was relatively small and fast moving,” said Helms. “Hurricane Ian was considerably larger than Hurricane Charley and moved much slower. This means that structures were subjected to high winds and storm surge for considerably longer during Ian than during Charley.”
By the time OLI acquired the image, Ian’s eye had shrunk to 26 miles (42 kilometers) as the storm went through another period of strengthening, ending up just shy of category 5 strength before making landfall. The intensity of the winds and large size of the wind field helped the storm push what proved to be a catastrophic storm surge into coastal communities, including Cape Coral and Fort Myers. Winds and floods have destroyed or damaged large numbers of homes and knocked out power to millions, according to news reports.
NASA Earth Observatory image and video by Joshua Stevens, using Landsat data from the U.S. Geological Survey, GEOS-5 data from the Global Modeling and Assimilation Office at NASA GSFC, and roads from OpenStreetMap. Story by Adam Voiland.


