Editor’s Note: This story is the first part in a series. Please read part 2, part 3, and part 4 for a more complete picture of Amazon deforestation.
The Amazon basin is exceptional. It spans at least 6 million square kilometers (2.3 million square miles), nearly twice the size of India. It is home to Earth’s largest rainforest, as well as the largest river for the volume of the flow and the size of the drainage basin.
The rainforest, which covers about 80 percent of the basin, is home to one-fifth of the world’s land species, including many found nowhere else in the world. It is also home to more than 30 million people, including hundreds of indigenous groups and several dozen uncontacted or isolated tribes.
The Amazon rainforest is also an enormous carbon sink—an area that draws down carbon from the atmosphere. It also pumps huge quantities of water into the air through a process called transpiration. Enough moisture rises out of the Amazon to supply vast “flying rivers” and about half of the rain that falls back down on the region, explained Thomas Lovejoy, a professor at George Mason University and a senior fellow at the UN Foundation for Science, Economics, and the Environment.
In spite of its vast size and clear significance to the planet, there is much about the Amazon that remains enigmatic because it is such a complex and challenging place to study. It is just as hard to manage. Surrounded by mountainous plateaus on most sides, much of the basin is remote and difficult to access. It covers about one-third of South America; it spans eight countries and many more state and tribal borders; and it features a mosaic of intersecting and overlapping ecosystems.
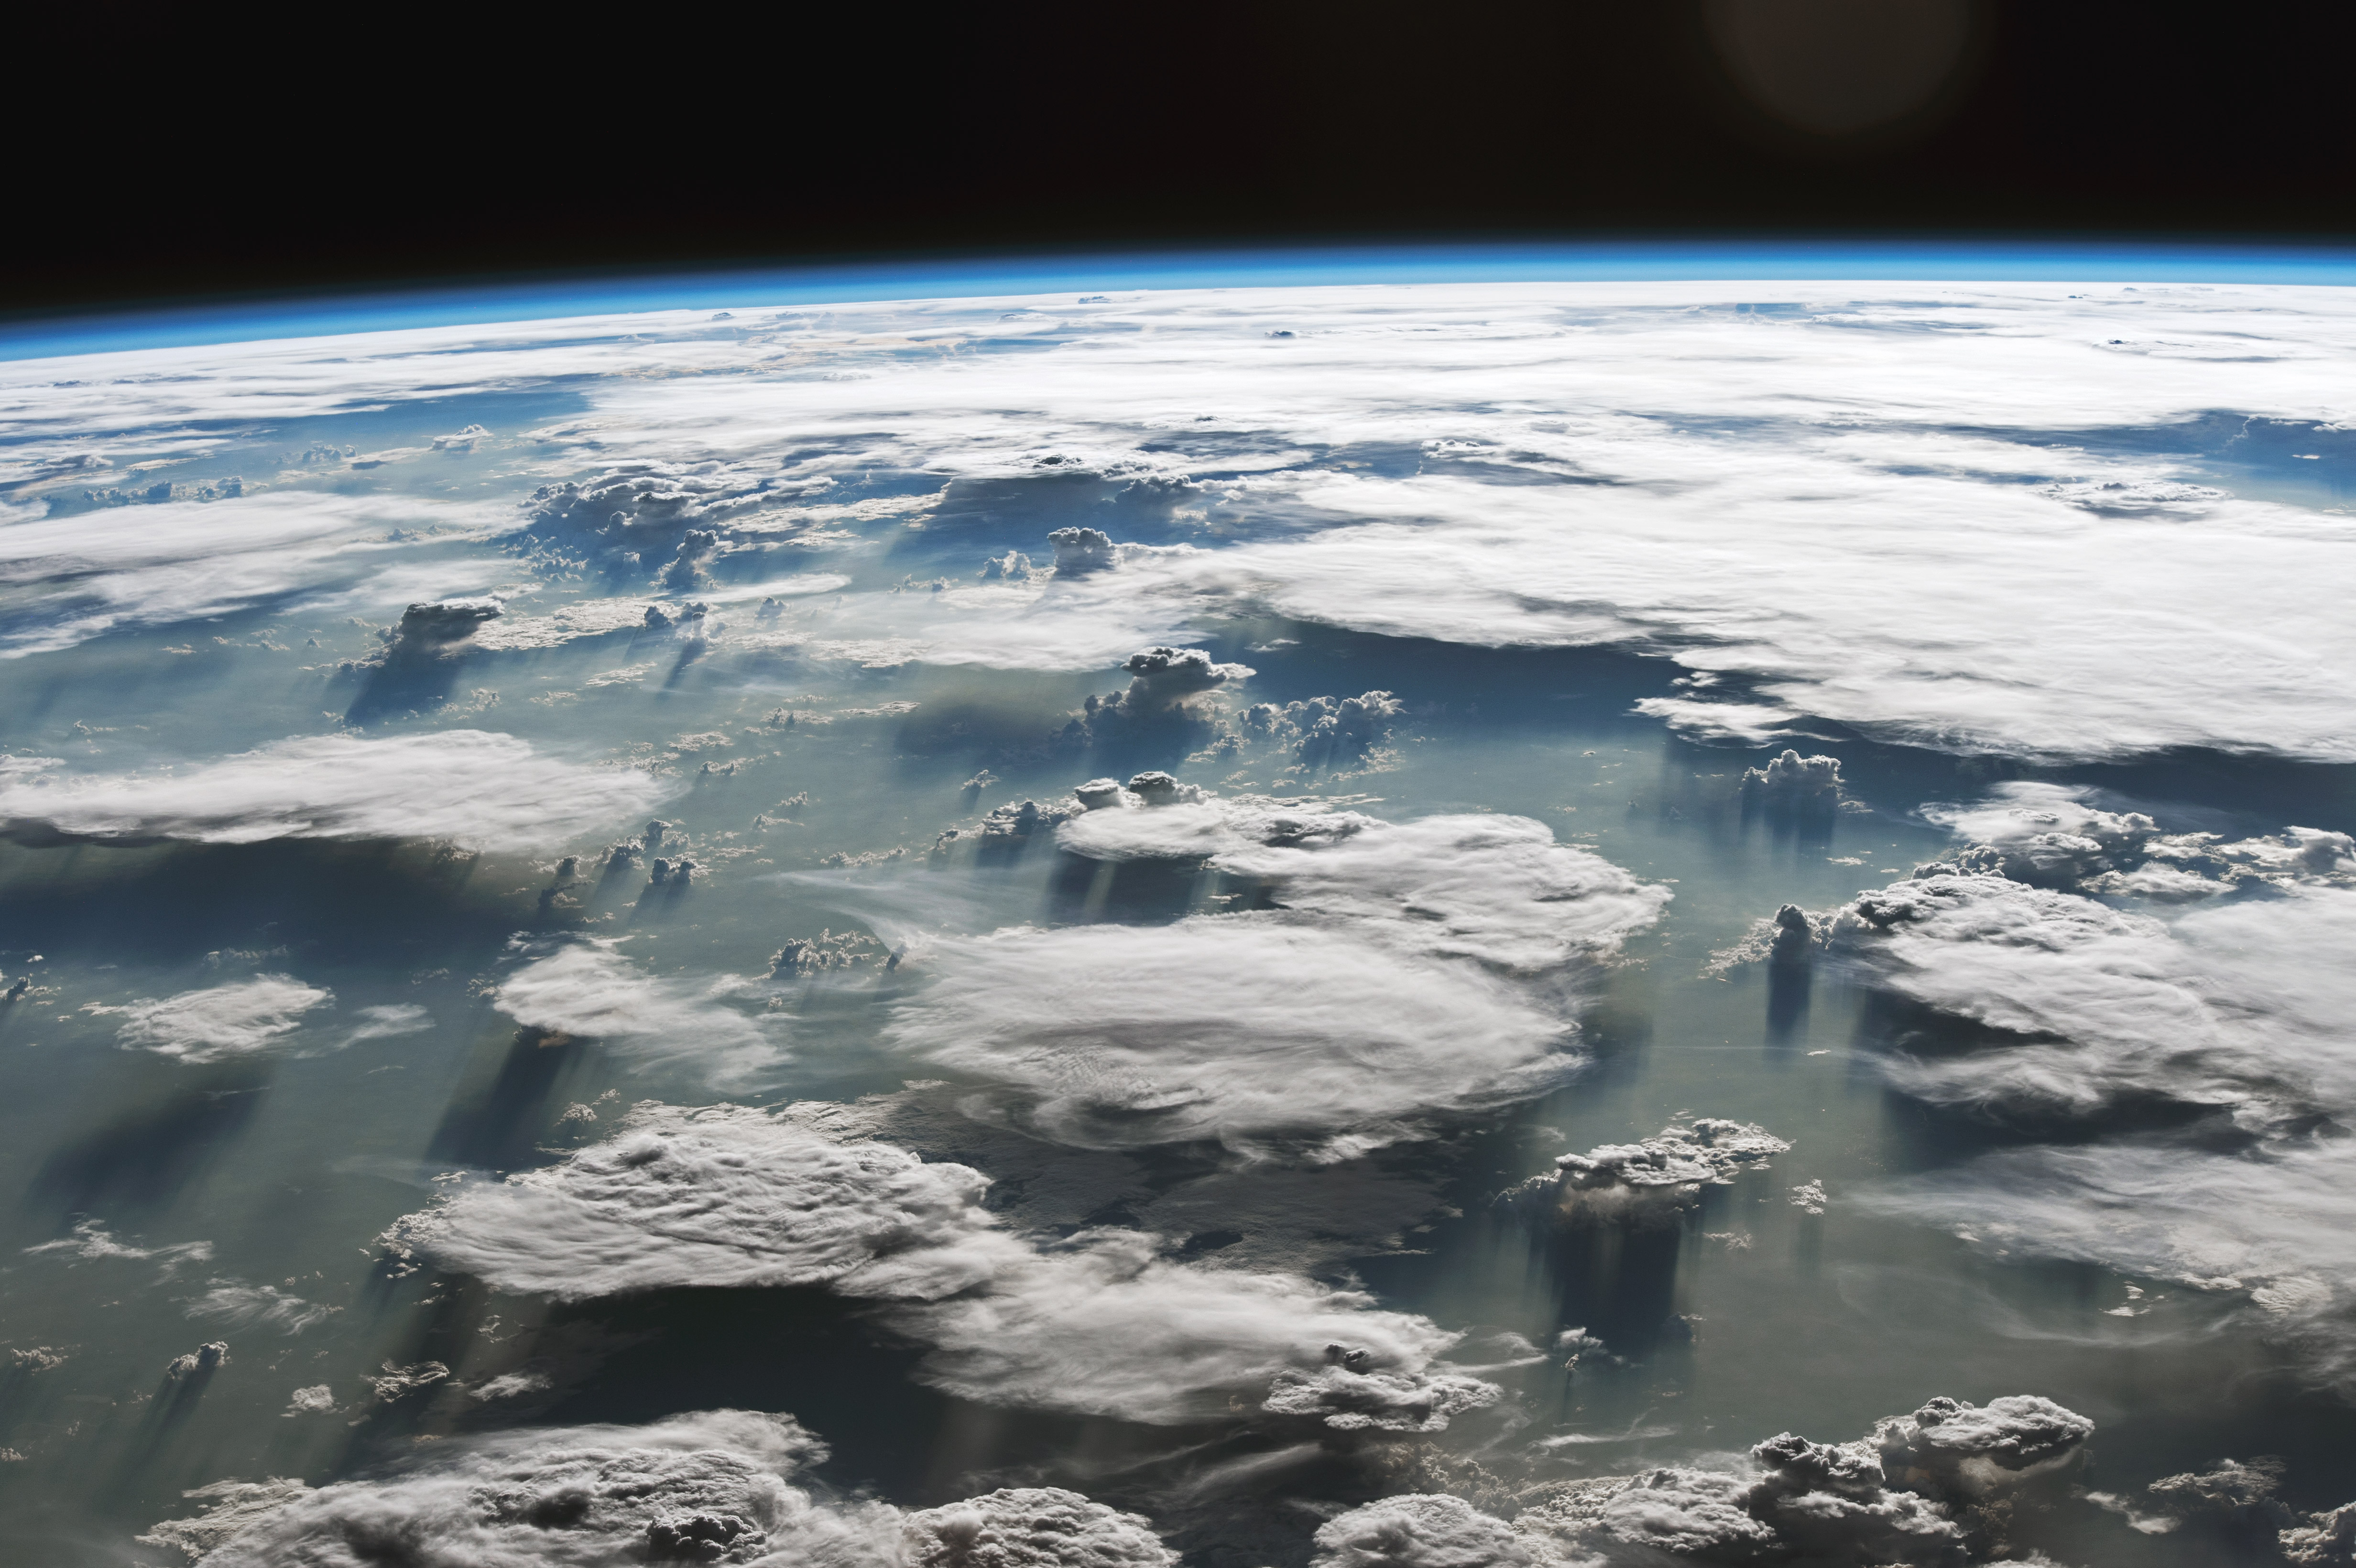
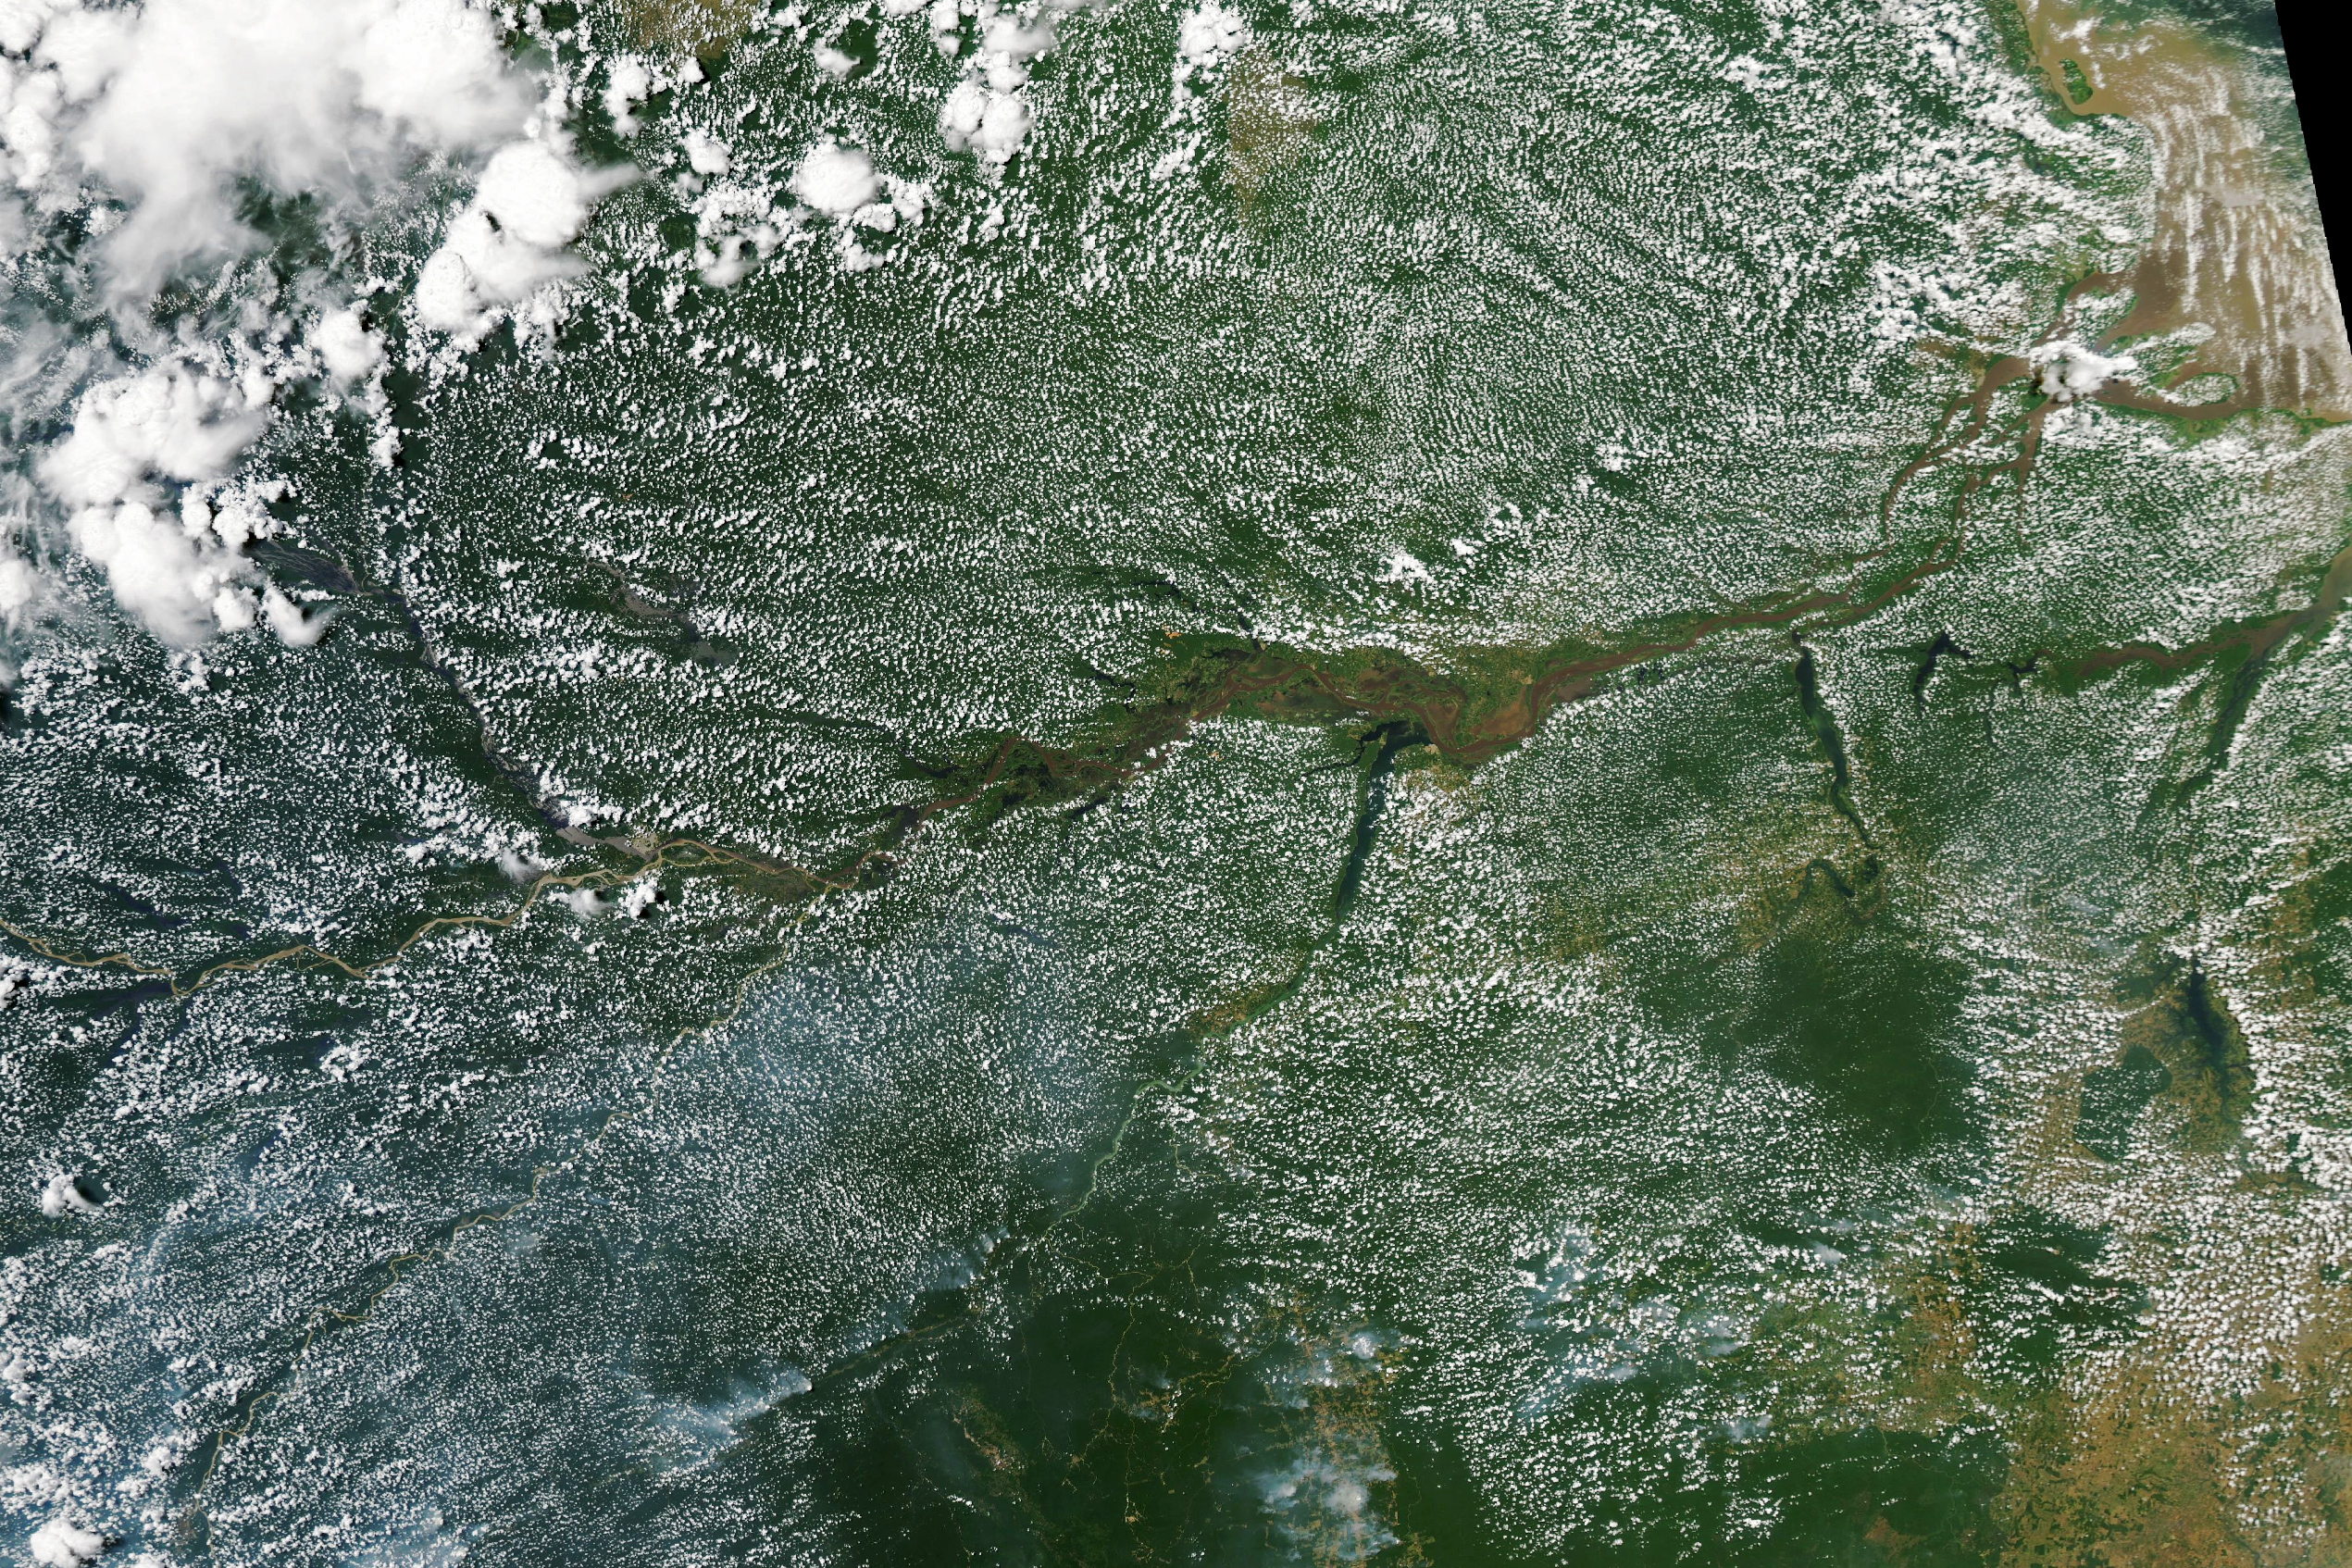
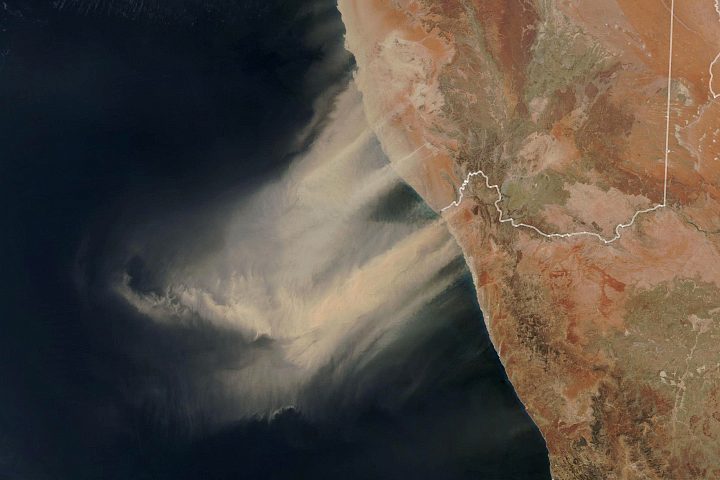
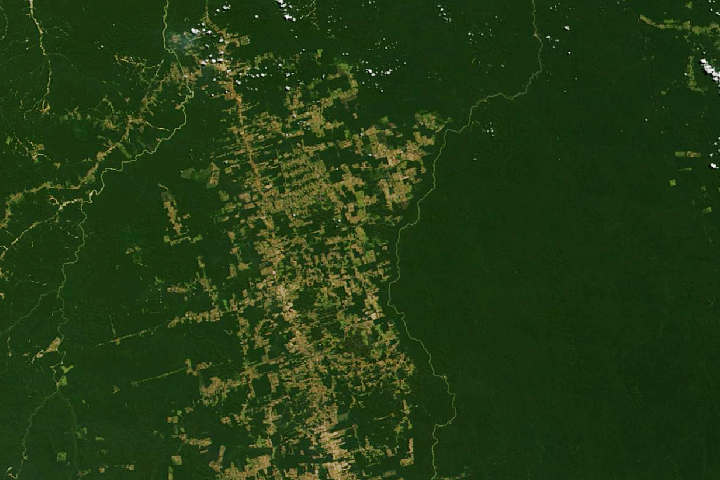
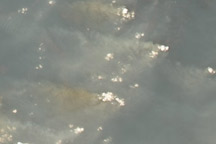
The skies above the Amazon are almost always churning with clouds and storms, making the basin one of the most difficult places for scientists to map and monitor. The astronaut photograph above—taken while the International Space Station was over the Brazilian state of Tocantins—captures a common scene from the wet season. Vast pillars of moisture rise via convection and then spread outward into anvil clouds as they collide with the stratosphere. Even in the dry season, legions of cumulus “popcorn clouds” appear over forested areas, obscuring satellite views of the land surface, as in the Moderate Resolution Imaging Spectroradiometer (MODIS) image below.
In the early years of the Landsat program (1970s), whole years would pass when the satellite could not collect any clear images of some parts of the basin. The curse of cloud cover long made it complicated for cartographers to define the edges of biomes and to categorize land cover or land use—tropical rainforests vs. savanna; primary vs. secondary rainforests, pasture vs. cropland, etc. It was even harder to track how these features changed over time and across the basin.
But as satellite observations have accumulated over the decades, as computing and cartography techniques have advanced, and as new satellites have been flown, remote sensing scientists have found increasingly sophisticated ways to piece together maps and narratives that better explain the Amazon region.
“What we see in the Amazon over the past four decades is extraordinary change,” said Matthew Hansen, a University of Maryland remote sensing scientist who specializes in mapping land cover and land use change. “We see major losses in both humid and dry forests; incredible expansions of pasture and agriculture; and clears shifts in land use driven by economic forces and the way land is managed. There is really nowhere else in the world that compares to the Amazon for the scale and scope of change.”
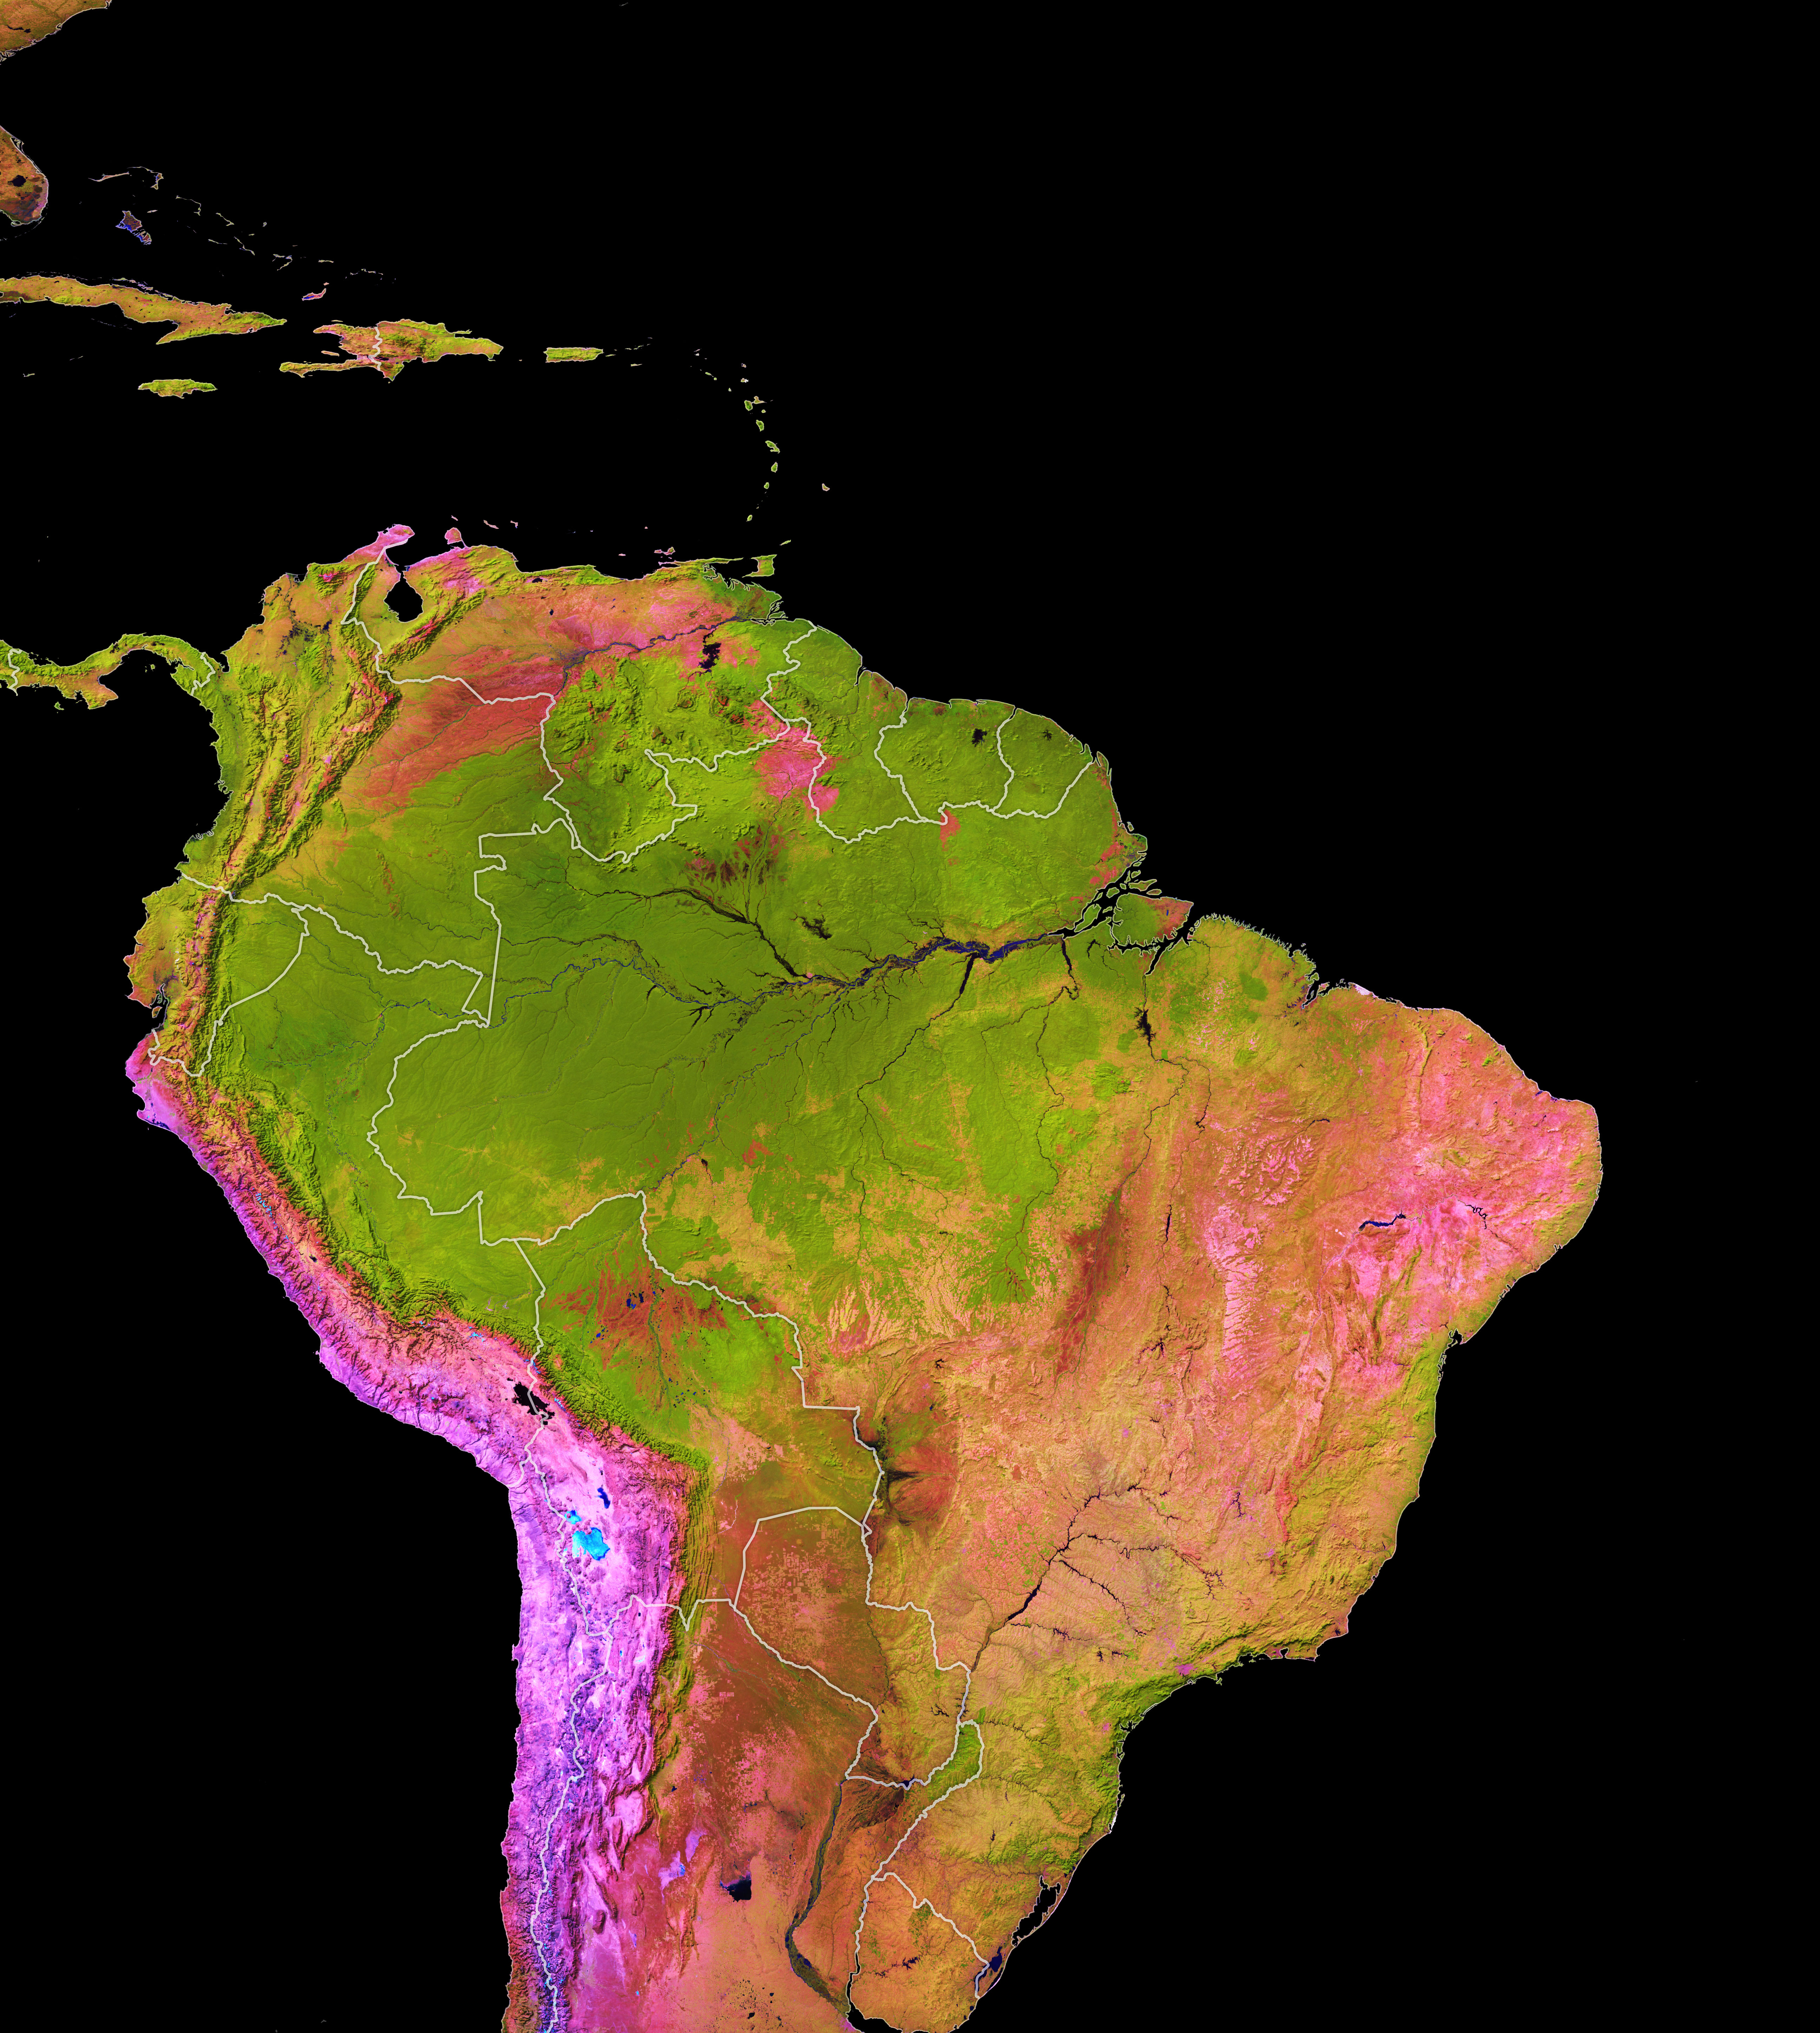
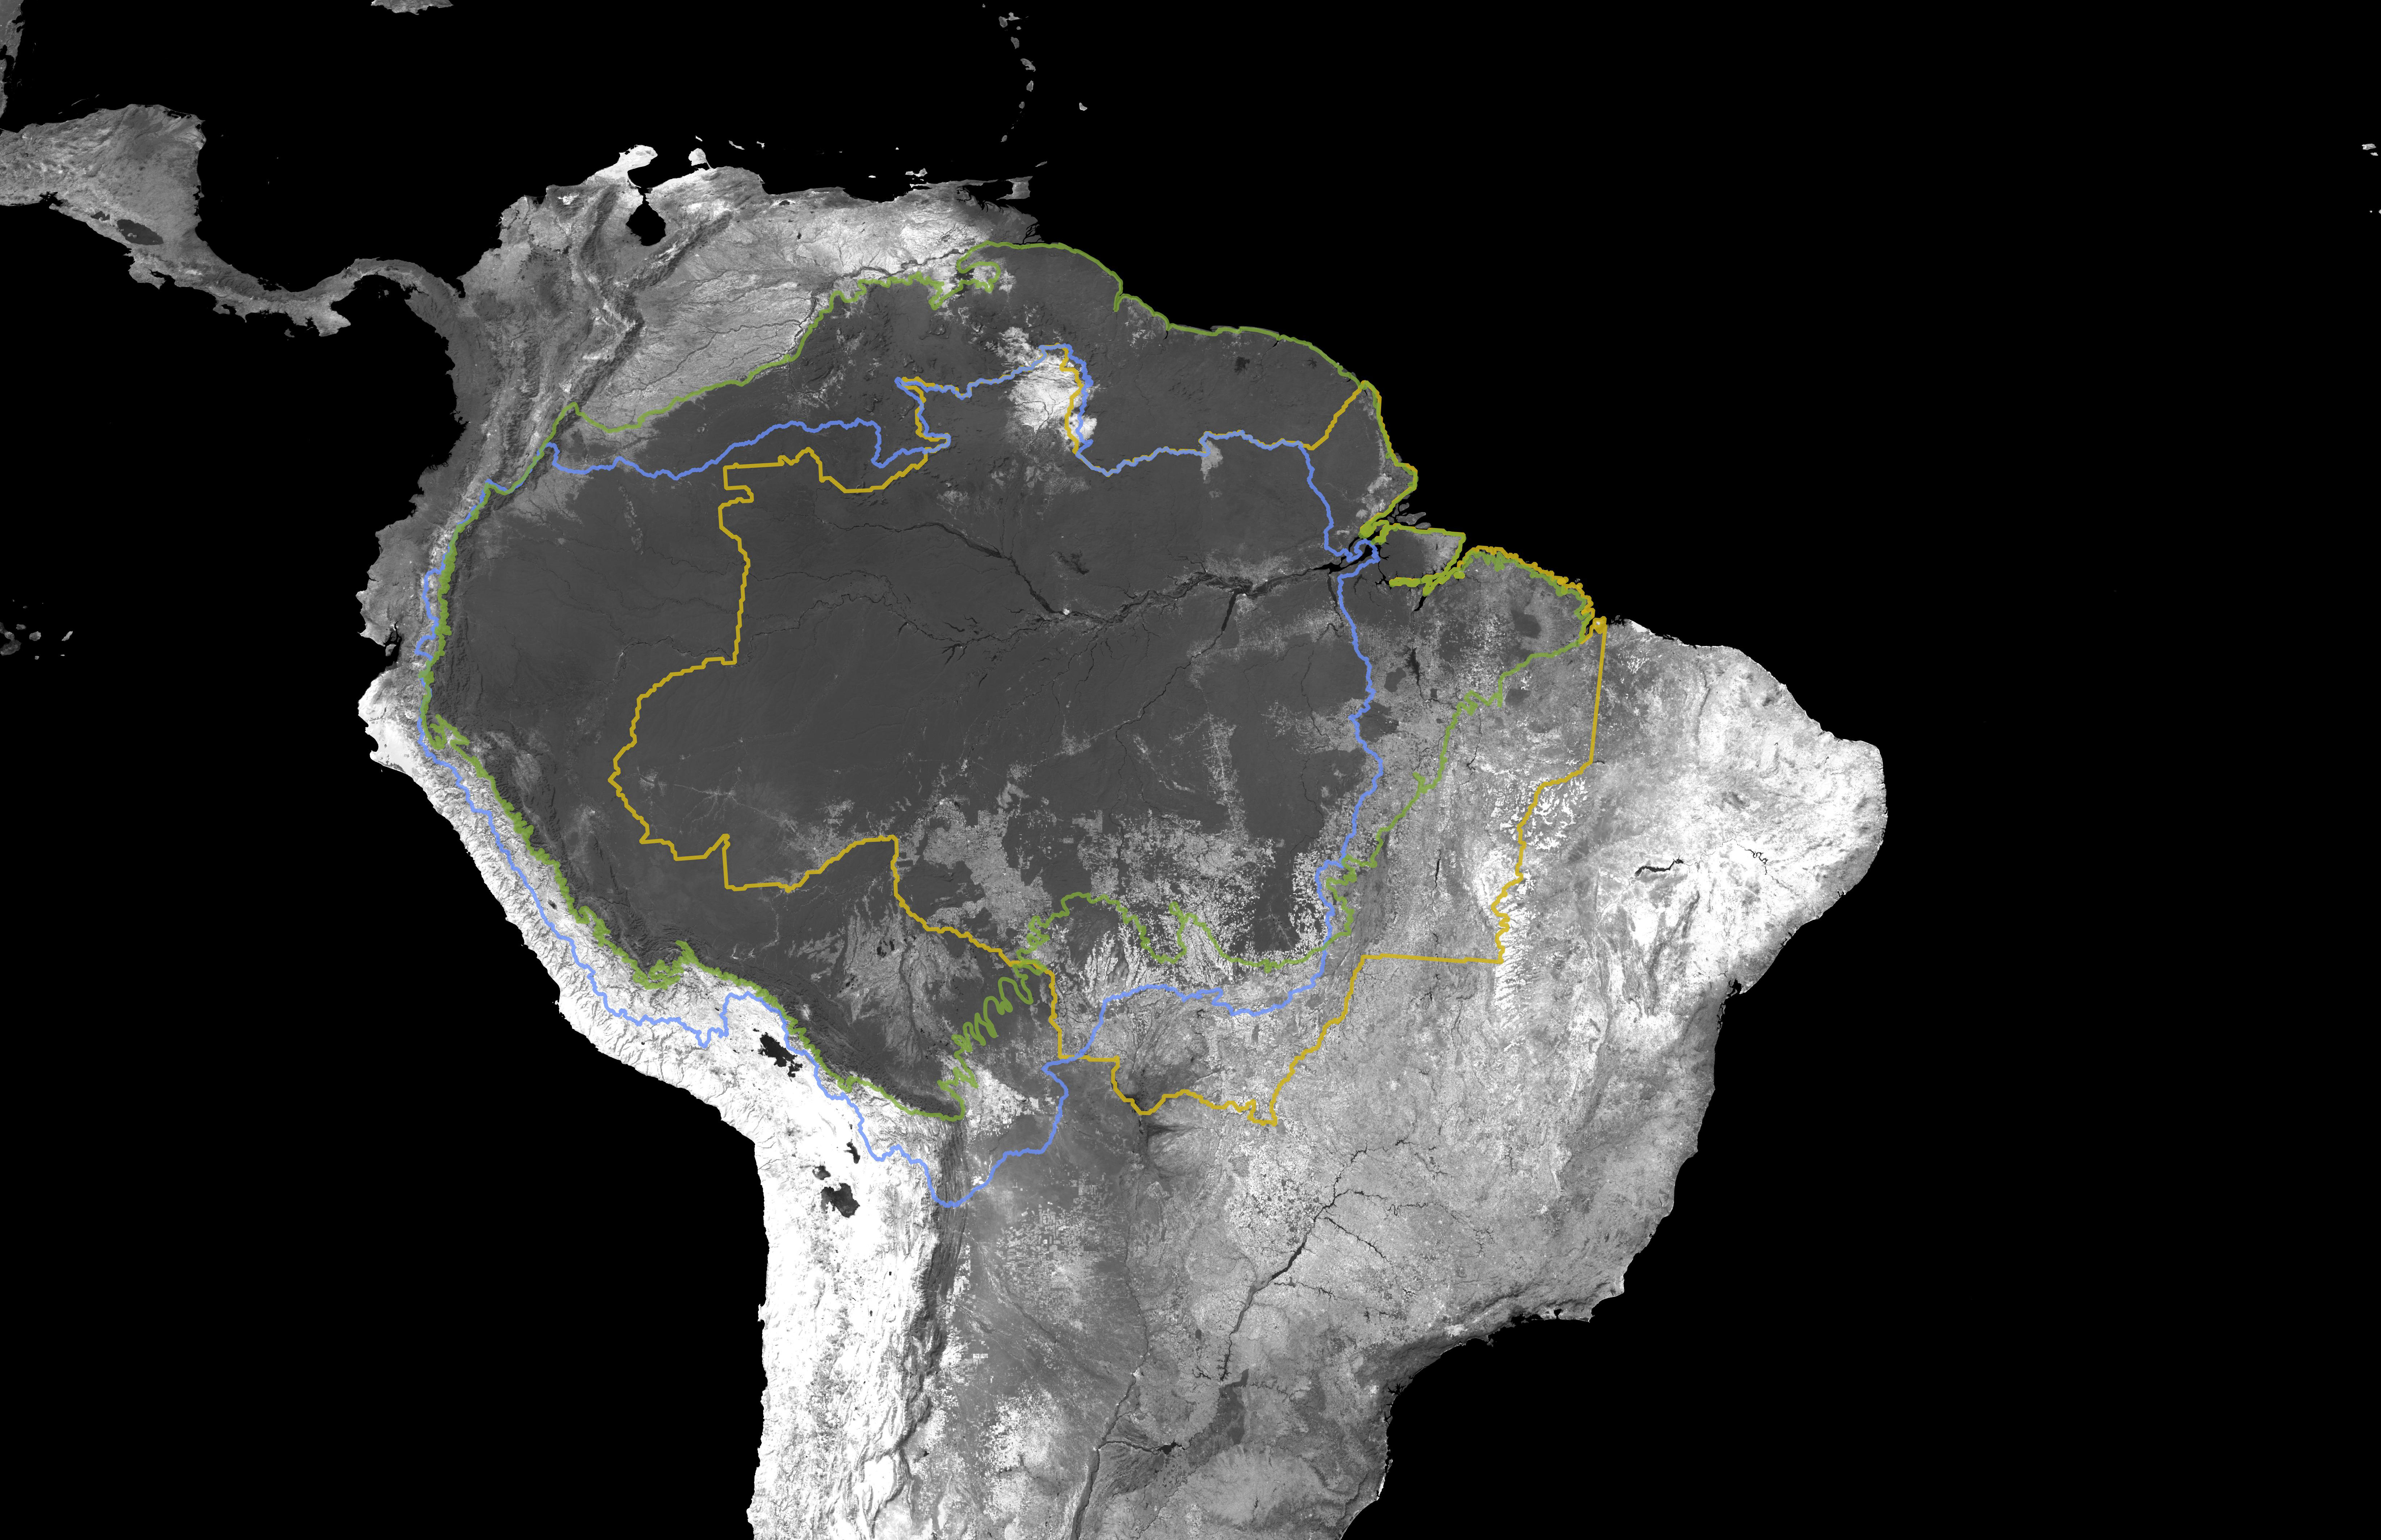
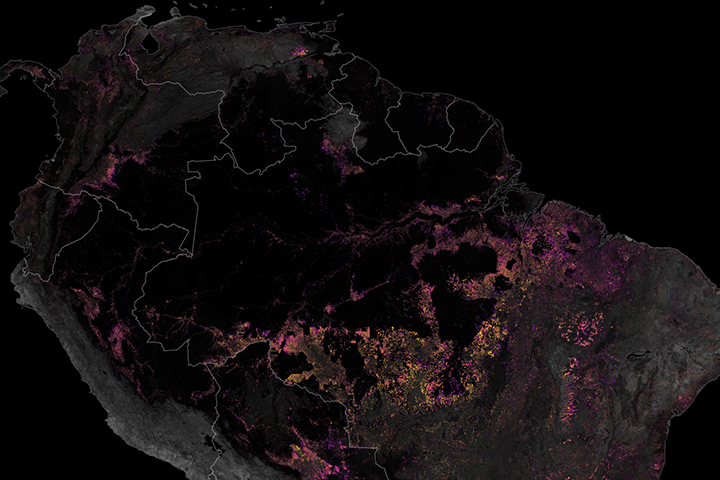
The map at the top of this page—a mosaic of cloud-free images collected by Landsat 7 and Landsat 8 in 2018—offers a clear view of the entire basin’s land surfaces. (If no cloud-free observations were available in 2018, imagery was taken from another recent year.) The false-color image (bands 5-4-3) incorporates observations of near-infrared and shortwave infrared light that accentuates key differences in vegetation, moisture levels, and other surface features.
The darkest green areas show where forest—mostly tropical humid rainforests—thrive and have not been severely changed or degraded by human activity. Lighter green areas in Venezuela, Guyana, Suriname and southern and eastern Brazil are generally tropical savanna (called Cerrado in Brazil). These woodland-grassland ecosystems often have trees, but they are spaced widely enough that the canopy does not appear fully closed.
Although tropical savannas receive plenty of rain during the wet season, they typically have vegetation that can withstand the lengthy dry season as well. Since water strongly absorbs in the near-infrared, moist areas are accentuated in this map. Rivers and reservoirs appear navy blue. The brown areas are seasonally flooded wetlands, notably the Llanos de Moxos, a seasonably flooding savanna in Bolivia, and the Araguaia River floodplain in the Cerrado.
Areas strongly affected by human activity also stand out. Forest areas that were converted to pasture generally appear yellow. Savanna converted to cropland is generally pink, especially if fields are fallow or have exposed soil.
“In a natural-color image without near-infrared, most of the forests and even some Cerrado areas to the southeast would end up having a similar green hue. A false-color image like this brings out variations,” explained Viviana Zalles, a researcher at the University of Maryland. “However, it is important to understand that the boundaries between biomes or land cover or land use classes on maps are not as neat and clean in real life.”
On the ground, ecosystems often fade gradually into each other, or there can be variations within a patch of land. “The key thing to remember is that the Amazon basin is an extremely diverse place,” said Zalles. “It includes the rainforest biome—Amazonia—as well as Cerrado. And Cerrado itself is a broad term. It can include dry forests, savannas, shrublands, all the way to grasslands with very few trees at all.”
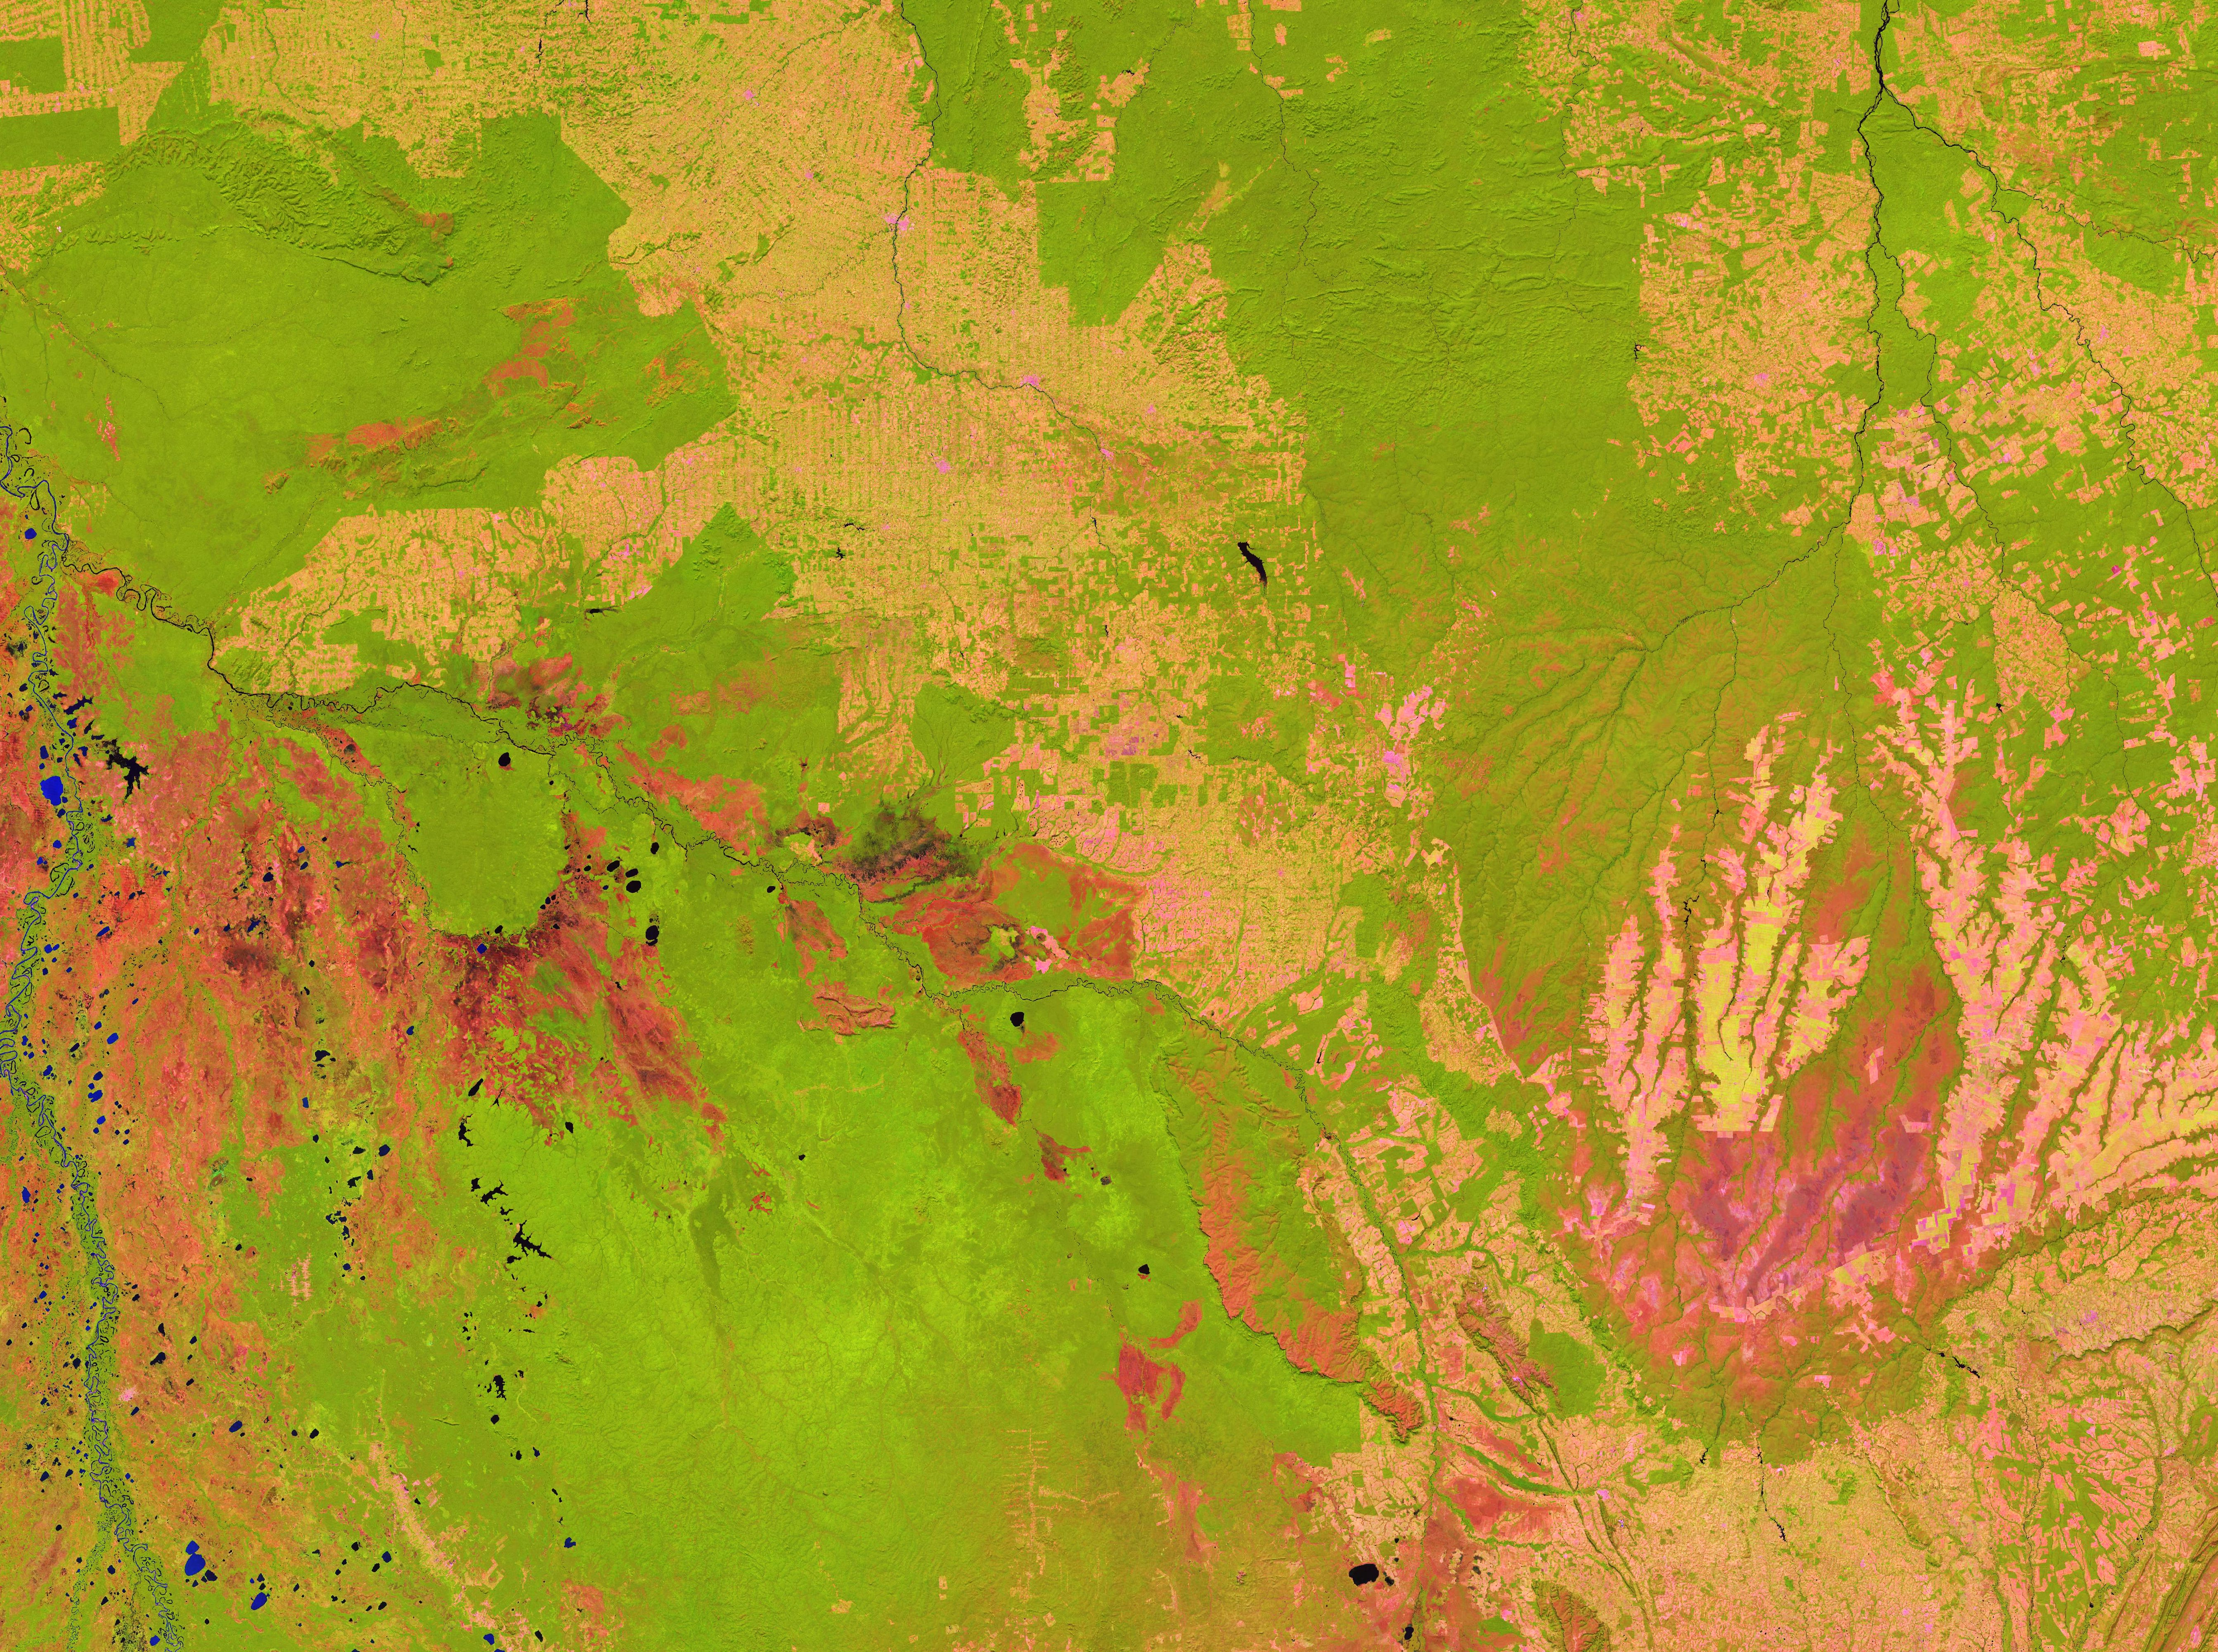
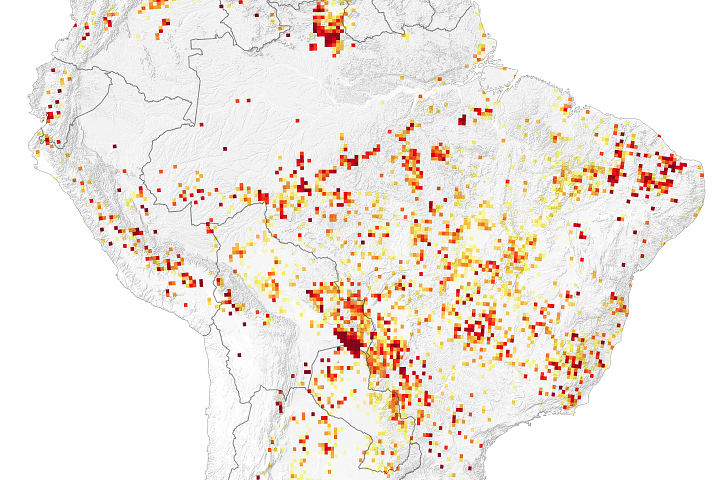
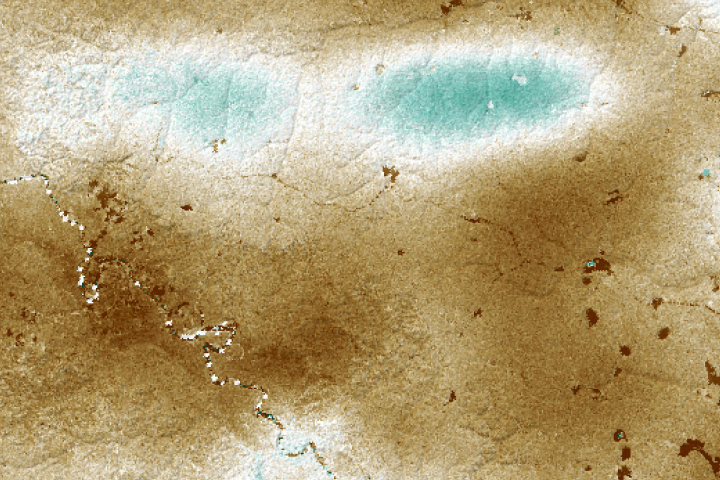
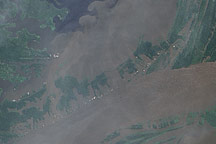
In some cases, the nuances can be lost on a continental-scale map. For instance, land cleared for crops and pasture along a deforestation frontier in Rondônia (a state in Brazil) appears to be a fairly continuous yellow area on the continental map at the top of the page. However, as seen in the more detailed view above, the area—which shows development extending into a seasonally flooded savanna near the border with Bolivia—is really a mixture of clearly defined pastures, fields, and forested stream banks of differing green, pink, and brown shades.
“The other thing that can be confusing about this part of the world is that different research groups use different systems when defining the boundaries of what they are studying,” Zalles said. “Some researchers, government agencies, and NGOs look at what’s happening in just one state or country. Others look at just one or two biomes. Others will look more broadly but still differ by focusing on just the Amazon basin or on the larger Amazonia biome or just the Brazilian Legal Amazon." (The second designation includes rainforest areas north and east of the Amazon basin and excludes parts of the Andes Mountains; the last designation includes Cerrado areas in addition to rainforest.)
“Even getting basic numbers, like the area covered by rainforest in 2018 in South America, is not as easy as you might think,” Zalles said. “The numbers that are quoted by different groups and media conflict in confusing ways because of slight differences in the way people define ecosystems or where they put the focus of their analysis.”
NASA Earth Observatory images by Lauren Dauphin, using MODIS data from NASA EOSDIS/LANCE and GIBS/Worldview, Landsat data from the U.S. Geological Survey and University of Maryland, and topographic data from the Shuttle Radar Topography Mission (SRTM). River data from the World Wildlife Fund HydroSHEDS Project. Amazon biome boundaries using data from Olson, DM, et al. (1998). Brazilian Amazon legal boundaries using data from Potter, C.S, et al. (2003). Astronaut photograph ISS042-E-215303 was acquired on January 30, 2015, with a Nikon D4 digital camera using an 98 millimeter lens and is provided by the ISS Crew Earth Observations Facility and the Earth Science and Remote Sensing Unit, Johnson Space Center. Story by Adam Voiland.


