
In late July 2019, a major melting event spread across the Greenland Ice Sheet. Billions of tons of meltwater streamed into the Atlantic Ocean throughout the month, making a direct and immediate contribution to sea level rise.
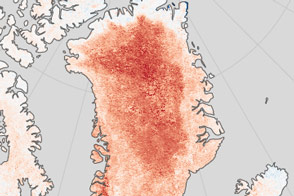
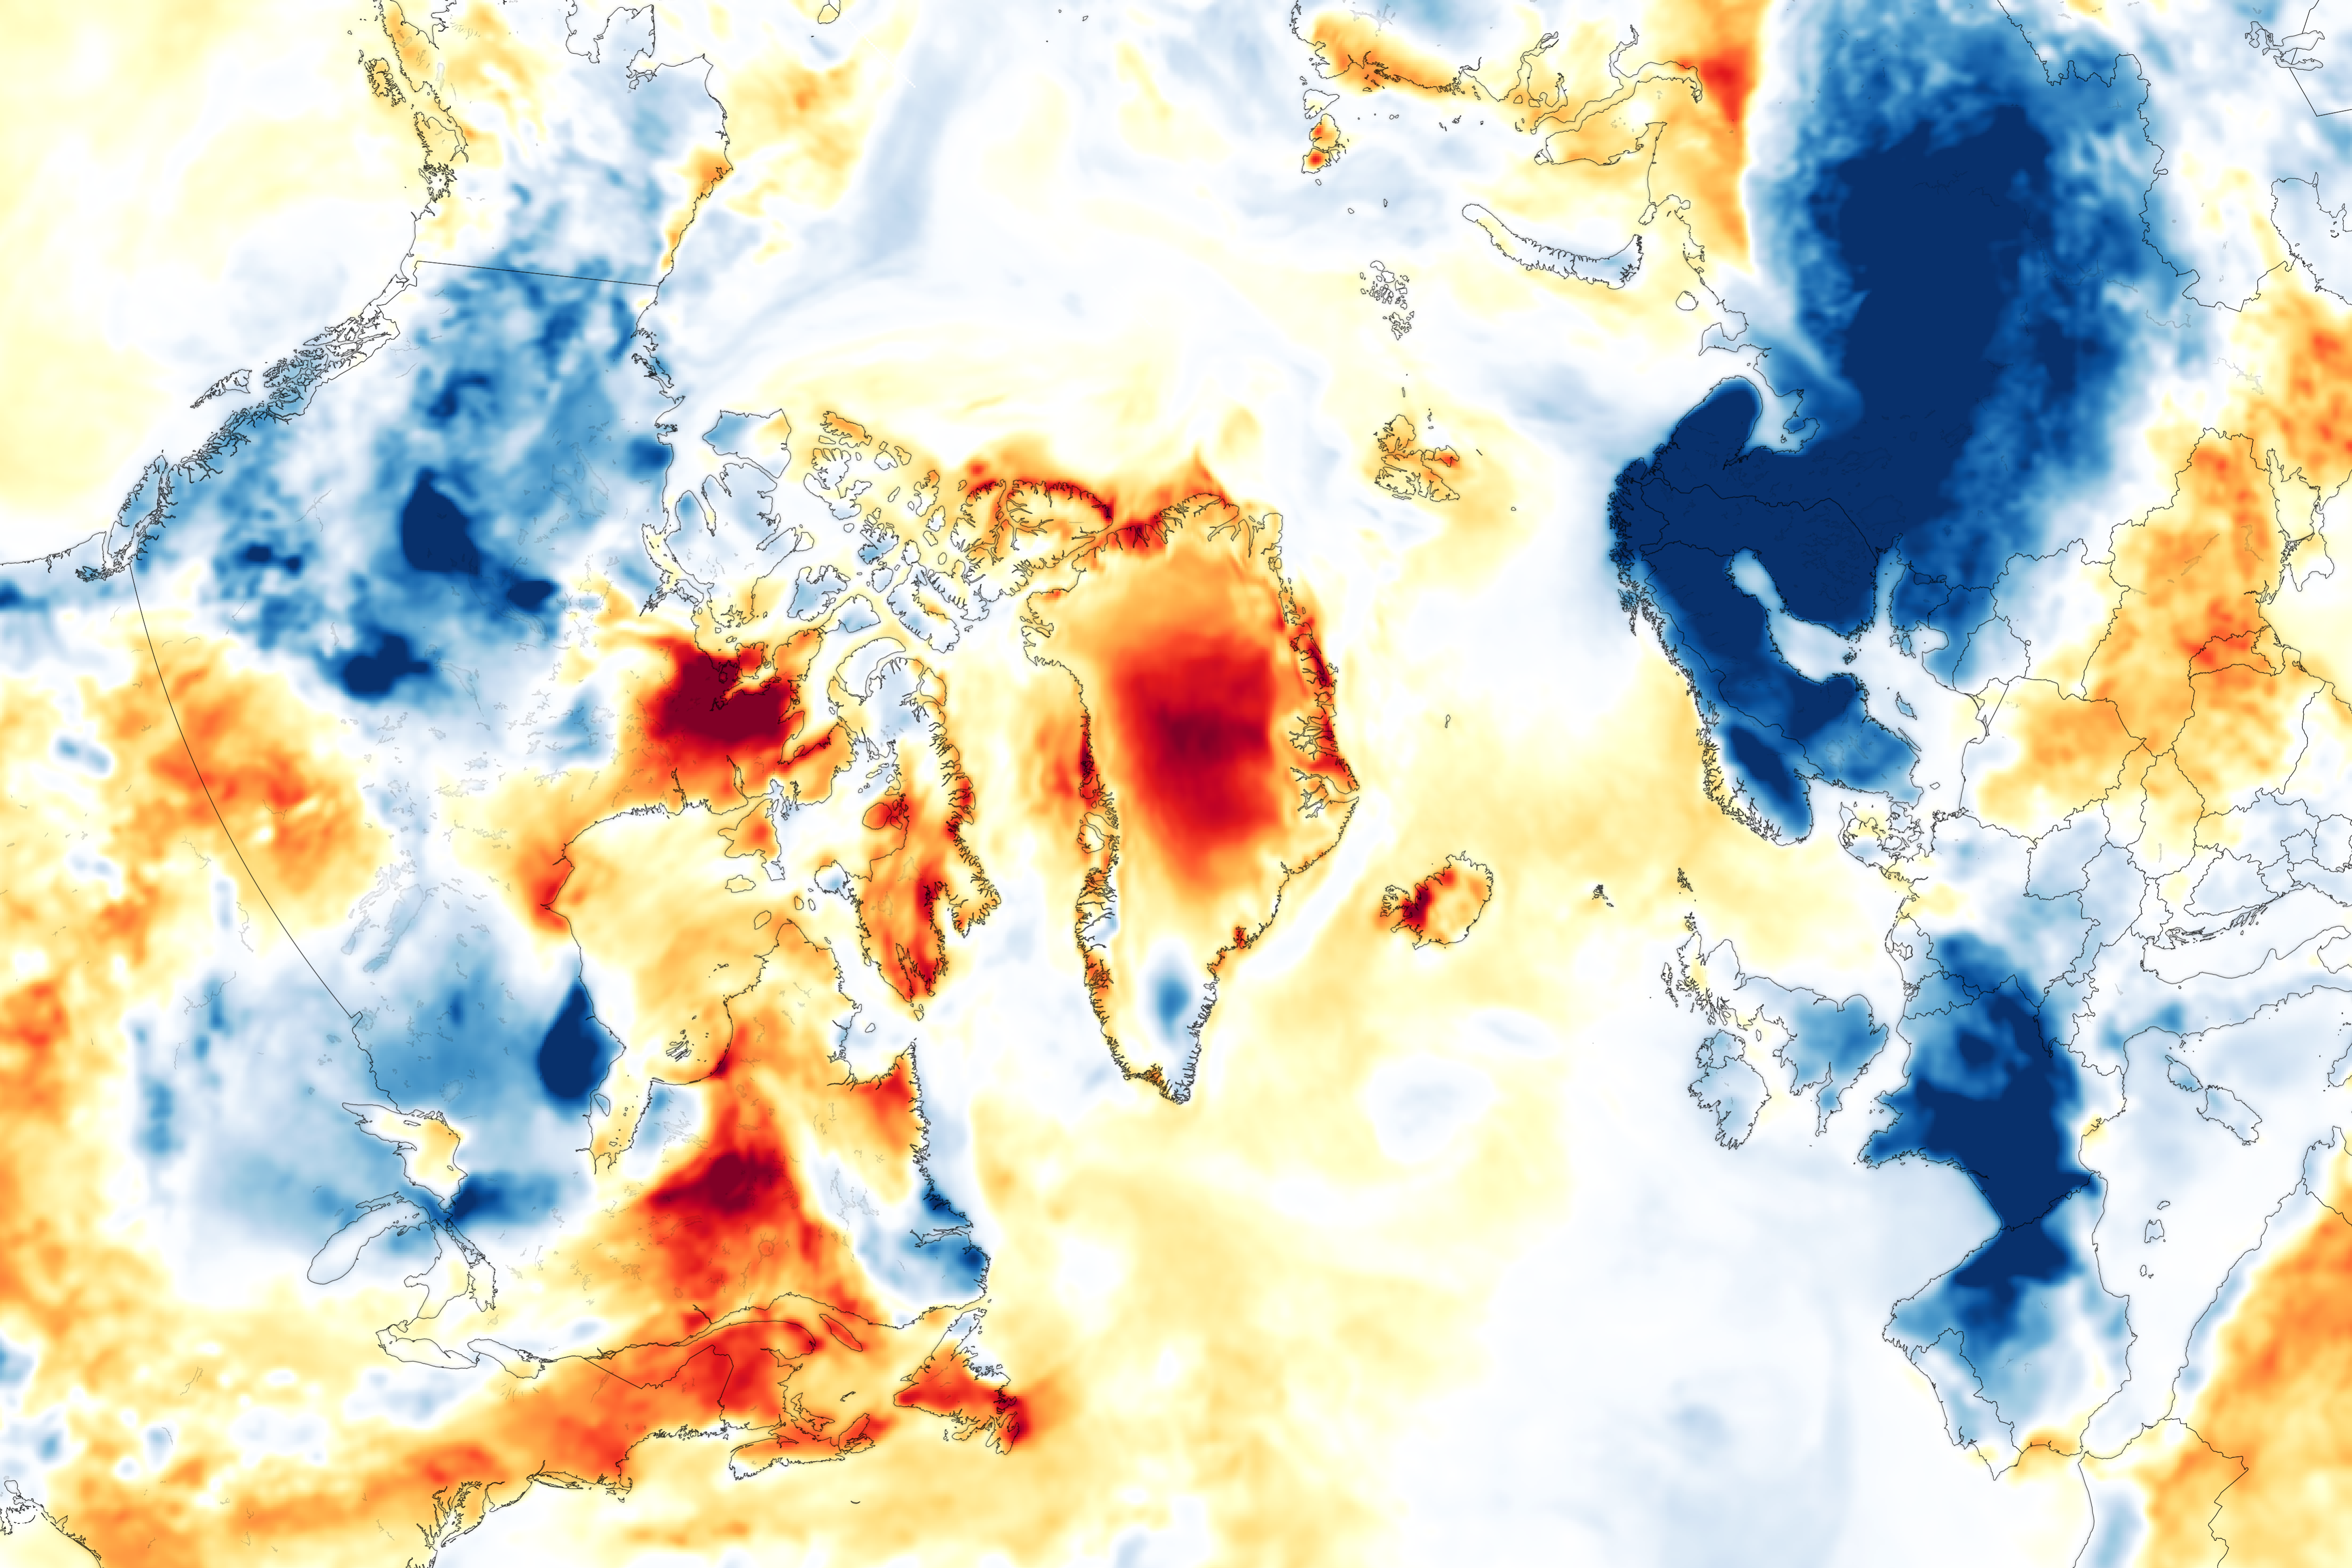
The melting was provoked by a bubble of warm air that moved over Greenland after delivering unseasonably warm temperatures to Europe. The map above shows the short-term temperature anomaly over Greenland; it depicts how much the air temperature on July 30, 2019, was above or below the average for the previous week (July 20 to July 26). Note how the central part of the ice sheet is bathed in warm air.
The map was derived from the Goddard Earth Observing System (GEOS) model and represents air temperatures at 2 meters (about 6.5 feet) above the ground. The GEOS-5 model, like all weather and climate models, uses mathematical equations that represent physical processes (like precipitation and cloud processes) to calculate what the atmosphere will do. Actual measurements of physical properties, like temperature, moisture, and winds, are routinely folded into the model to keep the simulation as close to measured reality as possible. Modeled data offer a broad, estimated view of a region where ground-based weather stations are sparse.
There are a few ground-based instruments making measurements, however, including one at Summit Station. Because it sits at the island’s highest altitude in the central part of the ice sheet, the station rarely sees temperatures reach the freezing point (0°C). But on July 30, air temperatures remained at or above freezing for more than 11 hours. That’s almost twice the amount of time that temperatures stayed at or above freezing during the last major melt event on July 11, 2012.
The melt events in July 2012 and July 2019 followed a similar pattern, in which the main event was preceded by a warm day that didn’t quite reach the freezing point, and followed by a day of cooling. The difference is that in 2019, the main melt event spanned two days, with a few hours of melt also occurring on July 31.
“These temperature data, provided by NOAA’s Earth System Research Laboratory, illustrate the importance of Summit Station’s position at the top of the ice sheet, where measuring climate variables illustrate unusual weather,” said Christopher Shuman, a University of Maryland, Baltimore County glaciologist based at NASA’s Goddard Space Flight Center.
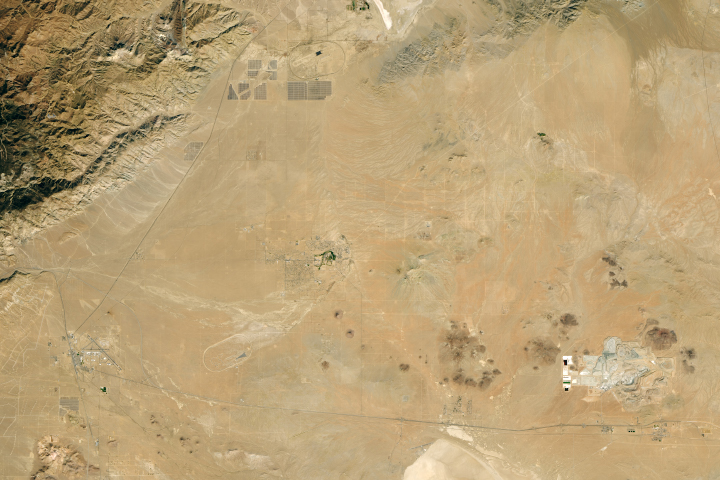
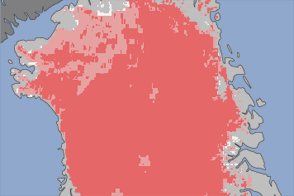
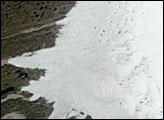
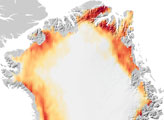
Warm temperatures cause meltwater to collect on the surface of the ice sheet. The natural-color image above, acquired on July 30, 2019, with the Operational Land Imager (OLI) on Landsat 8, shows meltwater ponding in northwest Greenland near the ice sheet’s edge. Summer melting along the periphery is typical. In contrast, a melt area that totals nearly 1 million square kilometers of the ice sheet, as it did on July 30-31, is less common.
Still, the extent of surface melt this year covers a smaller area than it did in 2012. One reason might be the unusual trajectory of the warm air mass, which approached from the east this year instead of the more traditional approach from the west.
NASA Earth Observatory images by Joshua Stevens, using GEOS-5 data from the Global Modeling and Assimilation Office at NASA GSFC, and Landsat data from the U.S. Geological Survey. Story by Kathryn Hansen.