By Eric Lindstrom
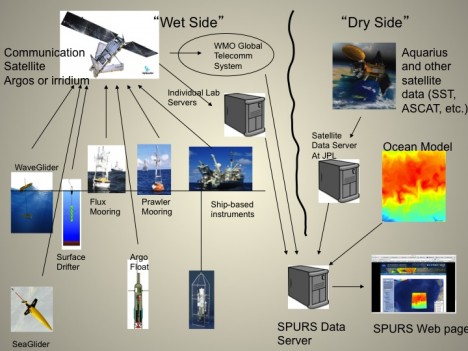
A high-level concept for SPURS data flow whereby data collected by the many devices will be relayed via satellite to shore and integrated with numerical ocean models and satellite observations.
The complex job of managing the data from SPURS is daunting because of the number of different platforms and data streams that need to be logged and cross-calibrated. Overall, by NASA standards, we are dealing with relatively small quantities of data (Gigabytes) but there are many,many different sensors and platforms involved. The value of the SPURS dataset comes from analyzing together the measurements made by all the different instruments at a variety of time and space scales. Such an analysis would not be credible without detailed comparison and calibration between all the instruments. SPURS interpretation is dependent on all the salinity measurements being comparable to one another and that one ocean salinity field is derived from the variety of measurements. Let me go into a little more detail on these points (forgive me for getting nerdy about this, but its important to the expedition, so I gotta tell you!)
To give you an example of the range of platforms and instruments measuring salinity in SPURS, consider that we are trying to measure surface salinity from space using Aquarius, surface drifters, Argo floats, Wavegliders, Seagliders, thermosalinographs on ships, moored salinity sensors, underway and station CTD, and bucket samples (it’s just what it sounds like!). NASA data systems are not generally working the entire buckets-to-satellites range of seawater analysis, so we are learning as we go — and doing just fine so far!
Salinity is a difficult variable to measure properly. It is determined by measuring the ability of seawater to conduct electricity. Though this sounds simple in principle, in practice, the measurement of salinity requires exacting standards of quality. The relevant variations in SPURS are one part in ten thousand (for comparison, a pinch of salt in a gallon of water changes its salinity by about 2 parts in ten thousand). Our instruments can measure salinity differences down to a few parts in a million.
The ocean salinity standard by which all of our ocean salinity measurements are compared is created by using a laboratory salinometer and a standard for seawater salinity, the “IAPSO Standard Seawater”. Operating the salinometer is a critical but tedious job, taking place daily in a temperature-controlled room just off the Knorr’s main laboratory. We collect dozens of water samples every day, all of which need to be examined by the salinometer with exacting adherence to procedures and recording of results. The salinometer is calibrated for each batch using the standard seawater with known salinity of exactly 35 parts per thousand.
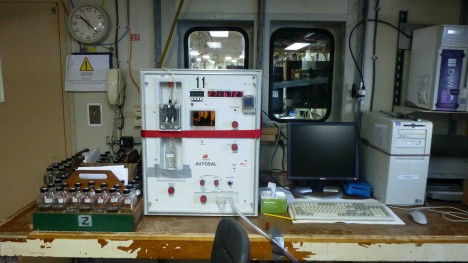
The salinometer on Knorr.
Bottles of seawater collected during CTD profiles and from the ship’s thermosalinograph system are analyzed on a regular basis and compared with the Standard Seawater. The fully-calibrated measurements from the CTD and the ship’s underway system are then used to standardize all of the other instruments being operated in SPURS (by comparison of nearby simultaneous observations).
A SPURS project led by Prof. Frederick Bingham of University of North Carolina Wilmington and Yi Chao at Remote Sensing Solutions in California has been focused in part on cross-calibration of the different data streams. Fred and student Andrew Whitley are on the Knorr from UNCW.
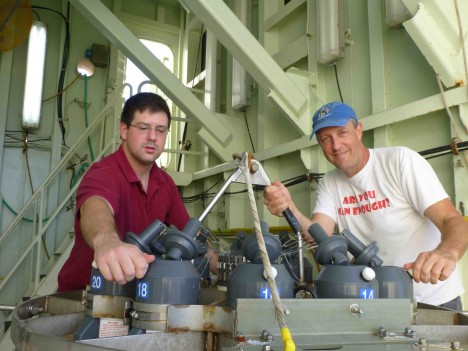
Fred and Andrew at work.
Fred is an observational physical oceanographer who has worked with many different kinds of oceanographic data over the years, including CTD, drifter, mooring, velocity, float and satellite data. In addition to his PhD in Oceanography, he has a Masters degree in computer science and information systems. This helps him manage and understand the sometimes complicated and confusing data structures the different oceanographic instruments produce.
Andrew Whitley is a graduate student at UNCW in Physical Oceanography studying large-scale coastline modeling. He has undergraduate degrees from UNC Chapel Hill (in music) and UNCW (in physics). Andrew is a first-timer to long oceanographic expeditions. He told me “I’ve always been fascinated with shipboard operations and research, but being a student of modeling rather than observing the ocean, I had not had opportunities to get aboard a research vessel. Thankfully, Dr. Bingham heard about my desire to go to sea, and I am very grateful that he asked me to come along. This has truly been one of the most extraordinary experiences of my life!”
I think he might have nightmares about seawater sampling for years to come! At sea, Andrew is also helping Fred with his data processing efforts. Andrew works up daily reports and plots on sea surface temperature and height, and drifter positions. He is processing daily CTD data for general shipboard use. Like many first-timers Andrew is soaking in the experience. It seems like no matter the hours or the watch to stand, he is loving every minute!
Another one of Fred’s duties on Knorr is to add to our “situational awareness” of ocean conditions and our sensor web. The SPURS instrument array is complex and constantly evolving in time as instruments drift or maneuver through the water. Satellites overhead provide information about sea surface salinity, temperature, currents, winds and weather. Onshore models make forecasts of ocean conditions 24-48 hours ahead. Much of this real-time data flow is unique to SPURS. In the new world of real-time oceanography, the ship can be directed to features of interest, instruments can be deployed based on analysis of satellite data or autonomous vehicles directed to travel to where they are needed away from the ship. Fred’s job is to keep the chief scientist aware of what observing assets are where and what the status of the array is.
In his every day work on board, Fred keeps a constant watch on the ship’s position and the positions of all of the other assets in the water. (An example of the type of display he uses can be seen on this website — click on “SPURS Data” and then on “Visualization”). When the need arises, he downloads and plots satellite imagery. He extracts data from the different data streams that are updating regularly and analyses them. It requires daily interaction with the modeling team at NASA’s Jet Propulsion Laboratory. All of the scientific team aboard Knorr use the daily updates on the environment and observing system provided by the UNCW team. It is an essential element for SPURS success!
By Eric Lindstrom
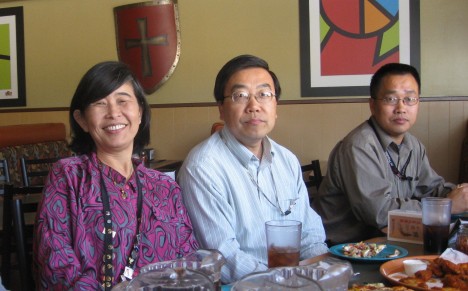
SPURS dry team members. From left to right: Peggy Li, Yi Chao and Gene Li.
Yi Chao is one of the “spiritual leaders” of our “dry” team in SPURS (those people who help from land). He is an ocean modeler in California who has been involved with Aquarius and SPURS for many years. He long ago decided to be on the dry team because of the seasickness that he experienced ten years ago during the tests of the Aquarius precursor instrument. Worse of all, he tells me, he had to stay on deck for days during the entire expedition because his seasickness got much worse if he went inside. He decided right then that it would be the last voyage in his oceanographic career. Since then, Yi has been an “armchair” oceanographer, working on satellites and computer models of the 3-D changing ocean. With outstanding results, I might add. Stay dry, Yi!
Other key members of the dry team include Zhijin “Gene” Li, Peggy Li, Quoc Vu, and Fred Bingham (on the Knorr to supply dry humor). Gene has dedicated more than a decade to formulate, develop and refine an ocean data assimilation system at JPL. This system integrates measurements from satellite, underwater autonomous vehicles and other ocean measurements into sophisticated computer models to depict the ocean. To support SPURS, this system is based on the community Regional Ocean Modeling System (ROMS), configuring as a nested set of three spatial domains and zooming in using horizontal resolutions of 9,3 to 1 kilometer to represent flow systems from hundreds of to a few kilometers in size.
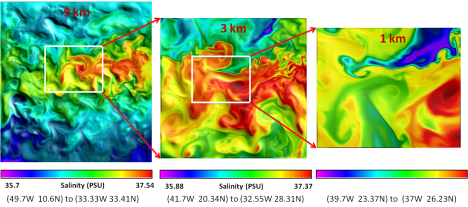
Sea surface salinities from the three model domains.
Before Knorr began its voyage, using the ROMS model, the dry team predicted for the “wet team” (as we the expeditioners are fondly known) that the SPURS area of research would be warmer and saltier than normal this year. Since then, the model system has been providing nowcast and forecast of the conditions of the SPURS ocean on a daily basis. The forecasts have helped to refine our sampling strategies aboard Knorr. Only time and more observations will determine whether their prediction is correct!
As the data stream from SPURS comes in, the model system will synthesize the observations and deliver more accurate forecasts of the ocean conditions, which will in turn help adjust the measurement strategy as needed. In essence, we use ROMS at NASA’s Jet Propulsion Laboratory (JPL) as our virtual ocean. It’s an estimate of the three-dimensional evolution of the ocean in the region given the data and physics of the ROMS model (both of which we try to improve).
Peggy Li is a dry team specialist in computer science (not an oceanographer) who is interested in building real-time visualization systems, convert data into useful information and present said systems in the fastest and most intuitive way. She has been providing outstanding support to SPURS investigators. She makes sure the information is flowing smoothly from the observation and model sources to the SPURS Data Management System. She is “on watch,” like those aboard Knorr. She initiates her day by checking to see if all the data are present on the SPURS visualization page. Only then she allows herself to have some coffee… such dedication! She has supported several field campaigns, but claims that this one is the most interesting by far.
A goal of the dry team is to integrate all the salinity data sets into a one-stop shopping web site for SPURS situation awareness. This includes data collected by both in situ and satellite platforms as well as output from computer models. Gathering the data from a distributed in situ (in place) sensor network is a challenge. All the in situ sensors send the collected data to their home institutions through satellite communication, where a quick first round of quality control is done by technicians who are experts in those instruments. For example, the ship R/V Knorr, flux mooring, wave glider, and Slocum glider send data to Woods Hole Oceanographic Institution in Massachusetts, the surface drifting buoys send data to the Scripps Institution of Oceanography in La Jolla, California, and the profiling floats and Seagliders send data to University of Washington in Seattle. The dry team computer at JPL in Pasadena, California, is checking all these computer servers around the country on the hourly basis, transferring and updating the data on the SPURS web site.
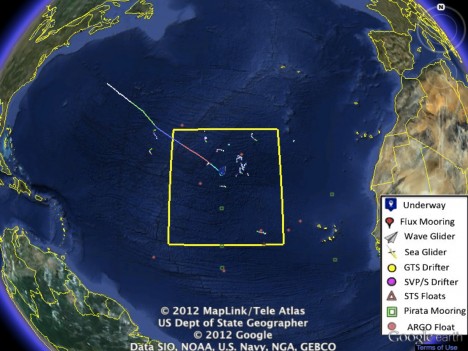
A screen shot for the SPURS data management system visualization using the Google Earth interface for monitoring the location for various instruments deployed from Knorr.
Using the well-known Google Earth interface, users on both the wet and dry teams can zoom in and out of the SPURS region to locate the most updated ship position, to read the salinity measurements from both in situ sensors and the Aquarius instrument in space, and to compare observations against the most recent model forecast.
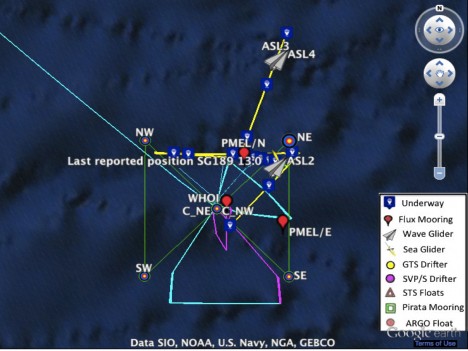
A closer look at the SPURS instruments’ deployment.
Communicating between the wet and dry teams has also been a challenge. The Internet link to shore is a shared resource between many U.S. research vessels at sea. It works well, but it is not like having a cable running right into your house!
All in all, the wet team on Knorr is much better informed because of the dry team’s efforts at JPL. Likewise, since one objective of SPURS is to improve our modeling of ocean salinity variations, the dry team is reaping great rewards from interaction with the wet team.
By Eric Lindstrom
The SPURS work has renewed interest in the broader community in studying the ocean to better understand the global water cycle, heating and cooling of the oceans, and oceanic mixing.
Julian Schanze of Woods Hole Oceanographic Institution/MIT is about to complete his Ph.D. in physical oceanography under the supervision of Ray Schmitt. Julian and Ray are on the Knorr to study ocean salinity, the water cycle and mixing in the ocean.
Julian Schanze at work.
Raymond Schmitt on the Knorr.
For his Ph.D. project, Julian is trying to estimate how much mixing occurs in the ocean. For this, he is using satellite datasets on surface fluxes of heat and fresh water and a concept known as power integrals. This is a mathematically complex subject, so let’s avoid the technical details and consider it in simpler terms.
Consider that, broadly speaking, the Earth is heated near the equator and cooled near the poles. For the equatorial and polar regions to not heat up or cool down, respectively, the excess heat must be transported away from the equator and towards the poles through mixing. The same approach can be used for the water cycle (which creates salt differences) as well such as ocean density and other, let us say “weird” ocean variables. For example, oceanographers consider the “spiciness” of ocean water as a measure of how warm and salty it is. So Julian is doing something really cool and looking at not just at heat moving through the ocean, but density and spiciness fluctuations as well. These are directly related to vertical and horizontal mixing in the ocean.
The equations that govern these power integrals relate the production of heat and salt variance (in our example, heating at the equator and cooling at the poles) to the destruction of variance (mixing) in the interior ocean. However, Ray and Julian found something curious: Under the right circumstances, the ocean interior can produce density variance rather than destroy it. The reason for this is double diffusion or salt fingers. When warm, salty water is found atop cool, fresh water, heat is diffused faster than salt in the ocean, leading to the formation of cold and salty “salt fingers”. These salt fingers transport salt downward and can create sharp density gradients. The SPURS region is top heavy in salt and therefore a likely place to find salt fingers.
On this SPURS cruise, Julian is trying to extend his understanding of mixing in the oceans from theoretical studies to hands-on work with the data. He is hoping the data will help him constrain uncertainties in the global maps of the water cycle and the heat budget that he has assembled. But while the approach he has taken in his dissertation allows him to calculate the total sum of mixing in the ocean, it does not constrain where the mixing occurs. This is where instruments deployed in SPURS enter the picture. Some of the SPURS instruments specifically allow for mixing in the ocean interior to be estimated by recording miniscule changes in temperature, salinity, and velocities in the ocean. The Vertical Microstructure Profiler and several of the gliders equipped with similar technologies allow oceanographers to estimate mixing quite precisely.
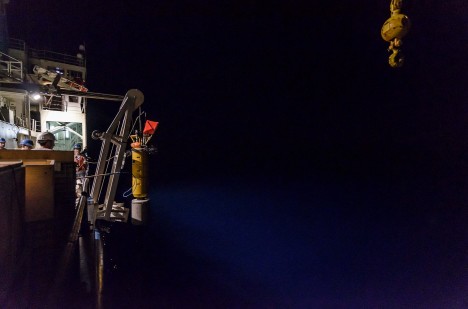
Night deployment of Velocity Microstructure Profiler.
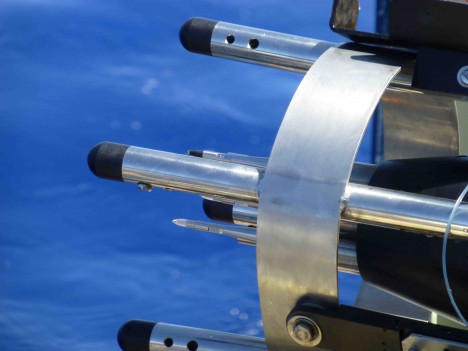
Sensor package on VMP.
On board, Julian is in charge of the Lowered Acoustic Doppler Profiler (LADCP), an instrument lowered on a wire that records horizontal velocities in the ocean by pinging sound waves off small particles that float in the water. This requires him to prepare the instrument for deployment, charge its batteries and process the data after the retrieval. The LADCP helps identify good sites for mixing by measuring where the velocity changes most rapidly with depth.
How did Julian get to be such an intelligent man? He tells me that at age seven, he moved close to the North Sea in Germany and became fascinated by the ocean. He soon became a keen sailor and decided to complete a four-year B.S./M.Sci. degree in oceanography at the University of Southampton in England. While his research has been largely focused on using satellite data to estimate the global water cycle (80-90 percent of which occurs over the ocean), he is thrilled at being able to go on a month-long research cruise to get in touch with the subjects he has been studying for the last 9 years. His fascination with satellite remote sensing and his research in oceanography are perfectly combined in NASA’s work on SPURS and the advent the Aquarius satellite, to measure sea surface salinity from space.
Everyone on Knorr believes that Julian has a stellar career in front of him!
By Eric Lindstrom
The thermosalinograph (TSG) on Knorr is a shipboard instrument for measuring temperature and salinity of the near surface water . It is situated in a lab and receives a flow of water taken in near the bow and piped out near the stern.
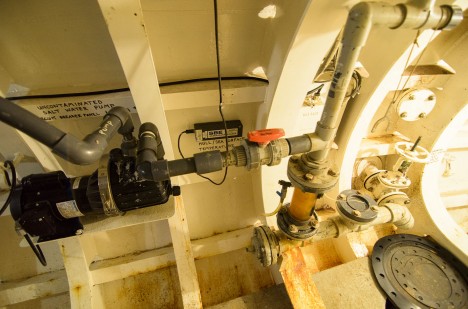
Inlet and pump for the Knorr’s thermosalinograph. (Photo: Julius Busecke.)
It is quite an adventure going down to see the inlet for the TSG. You go to a storage locker in the bow, then down a long tunnel, then forward at the bottom of the ship. And you discover something cool when you get there. When Knorr was built, they put viewing ports in the bow. One could sit below the waterline in the very front of the ship and watch the ocean go by. Wow! They must have been really cool for watching bottlenose dolphins playing in the ship’s bow wave! Sadly, the viewing ports were sandblasted at some time in the past, and one can no longer see through the glass.
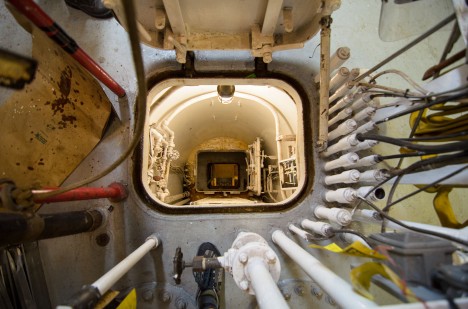
Start of downward journey to the thermosalinograph and the viewing port in the bow. (Photo: Julius Busecke.)
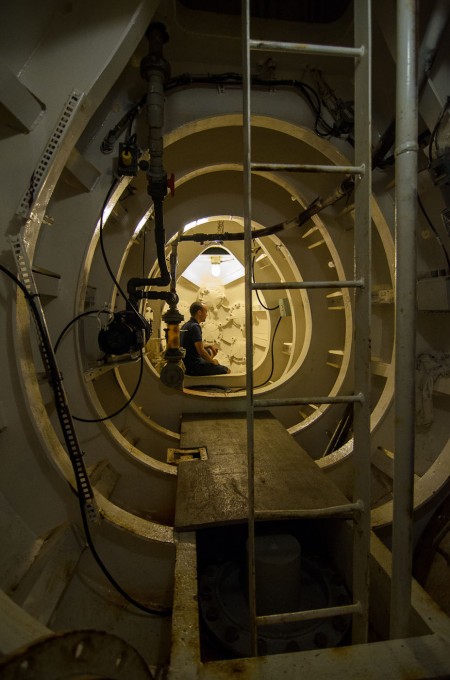
Looking forward to the viewing port in Knorr’s bow. (Photo: Julius Busecke.)
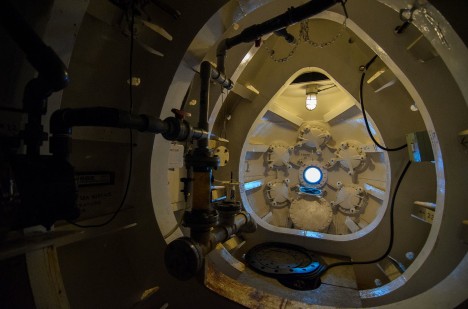
The viewing port in the bow of the Knorr. (Photo: Julius Busecke.)
On a cheerier note, an Aquarius project led by Prof. Arnold Gordon of Lamont Doherty Earth Observatory has been focused on surface salinity and the global record provided by TSGs on research vessels and ships of opportunity (commercial vessels that carry scientific equipment and take automatic measurements that scientists then use for their research).
Phil and Julius are aboard Knorr for SPURS from Lamont to assure the quality of the TSG data and provide ongoing analysis of the surface salinity from various instruments, including Aquarius. Chief Scientist Ray Schmitt set a contest in motion for a free dinner in the Azores for the group that documents and collects a bottle sample of the highest salinity of this SPURS expedition (most likely at the ocean surface). Game on!
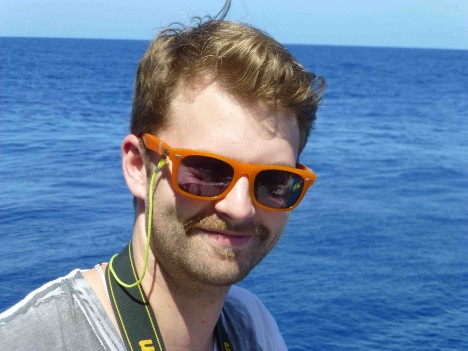
Julius at work.
Phil at work.
The closer we look at the ocean with increasingly sophisticated satellite and ship-based instrumentation, the less it looks like the textbook images of large-scale circulation gyres, and more of an assemblage of around 100-km-sized eddies. What role do these eddy “swirls” play in the overall climate system? And more specifically, how effective are eddies in stirring freshwater into the evaporative salty regimes of the subtropics? During the SPURS field program the TSG and hull-mounted Acoustic Doppler Current Profiler (ADCP) observations of ocean currents are used to map the eddy field, to ascertain their potential to compensate the excess evaporation. What we learn will be applied along with the Aquarius satellite ocean surface salinity data, to other areas of the ocean, to more fully grasp the impact of eddy dynamics on the marine hydrological system.
The Lamont team prepared for this expedition by inspecting the archival surface layer temperature and salinity in the SPURS region, collected by Voluntary Observing Ships and transits from past research expeditions to estimate the eddy flux of freshwater into the North Atlantic evaporative subtropics. What they found is encouraging: the ocean eddies very well may be the primary force in compensating the net regional evaporation. The seasonal cycle of the eddy effect seems to set the seasonal swings of the ocean surface salinity, not net evaporation. The SPURS expedition data along with the Aquarius satellite data provides a far more quantitative data set to pursue this topic.
SPURS experimental design and measurement methods, consisting of sensor-laden moorings with an array of autonomous instrumentation, provide a beautiful 3-D view of the ocean stratification and circulation as it evolves over time. The R/V Knorr’s high resolution TSG and ADCP, as well as the data stream from the Aquarius satellite, link together the data from all these assets, to fully capture the eddy field and ascertain its role in the larger scale system. It’s exciting to see the complex factors influencing ocean surface salinity coming into focus!
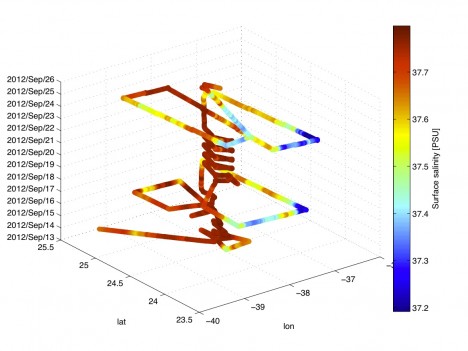
Ocean surface salinity from R/V Knorr Thermosalinograph (color bar) vs latitude, longitude, and time.
While we can guess what we might observe, being there to actually see the data as it rolls in allows for the building of understanding and thus adjustment of the experimental design to maximum return. The observations from the Knorr will expand our quantitative knowledge of how the ocean, and its field of eddies, are coupled to the sea-air flux of water. That is oceanographer speak for “this is awesome!”
By Eric Lindstrom
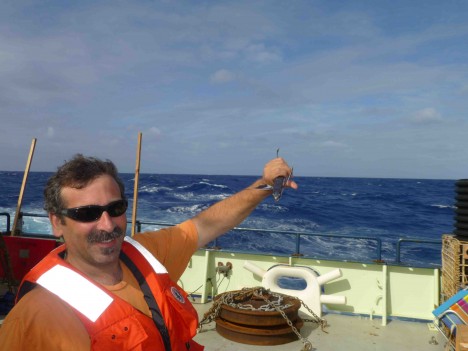
John snags a flying fish in mid flight.
There are not many places in the open ocean that get their own special name as a “sea.” Most seas are what we call marginal seas – offshoots of the major ocean basins.
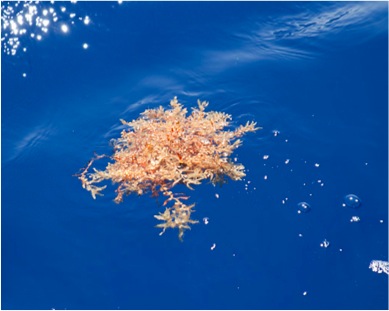
The Sargasso Sea, as a vast track of the western subtropical North Atlantic Ocean is known, has a special characteristic – something noted by Portuguese sailors for centuries and even visible from space. It is the home waters of Sargassum, a genus of brown macroalgae (seaweed) that inhabit the open ocean. The sea is named after the seaweed and it seems that small clumps are nearly always within sight of the ship (we have yet to see giant mats of the stuff in the SPURS region). Anyway, the Sargasso Sea is special because of a plant. Well, it is more complicated than that!
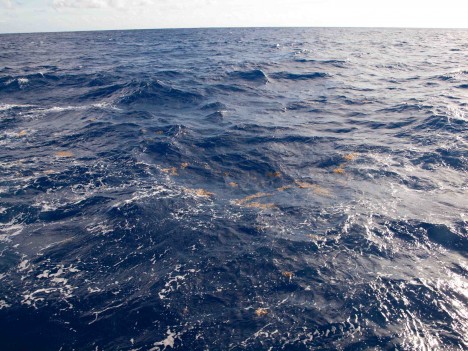
A patch of Sargassum at the surface (Photo: Julian Shanze.)
Sargassum, up close.
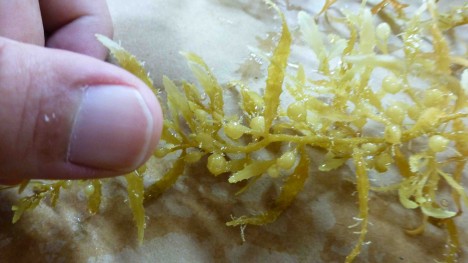
Closeup of Sargassum.
In my opinion, the really cool thing about Sargassum is that each clump can be a teeming ecosystem by itself. Several varieties of fish (e.g. Sargassum fish and flying fish), crabs , and nudibranchs live in close association with the weed. Each clump is a complex island of life floating free at the surface of the deep ocean. When you are out here in the vast emptiness of the open ocean, it is just hard to imagine how this intricate web of life came to be, survived, and actually thrives. Every time I am in the Sargasso Sea, it seems such a wonder.
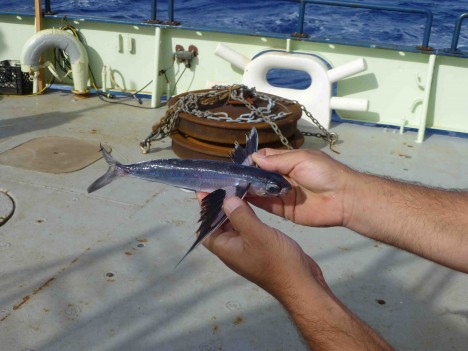
A flying fish.
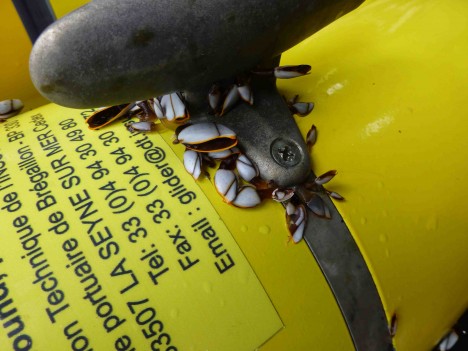
Barnacles on French glider recovered by Knorr.
We had spectacular sunset last night and I was reminded of the old adage: “Red sky at night, sailor’s delight. Red sky in morning, sailor’s warning.” Here we are still in proximity to Hurricane Nadine and is this saying true, or is it just an old wives’ tale? Like the answer to most questions, there is a web site for that. In fact I think it may be true for us; we are well south of the hurricane weather and forecasts have good weather for in days ahead.
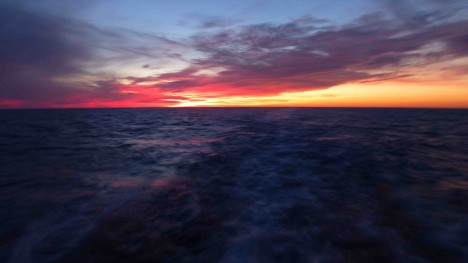
Sunset sen from the Knorr.
An interesting sidebar to today’s blog topic is another kind of life we have found in great abundance at our SPUR study location. It was a mystery for a few days – we were seeing lots of floating microscopic reddish dusty particles. Some said it looked a little like sawdust (but where are the trees?), and some wondered whether it was floating dust from the Sahara. Well, thank goodness for the Web again. I discovered that it’s a bloom of an important nitrogen-fixing bacterium (Trichodesmium) also known as “sea sawdust.” It certainly reinforces the idea that a key to identification is a good description!
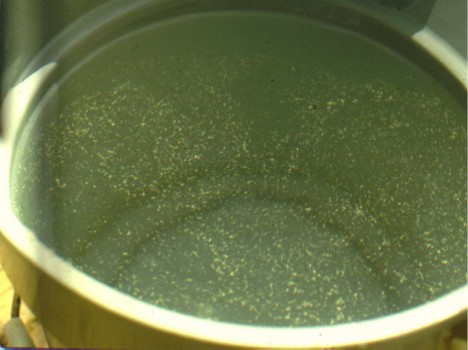
Trichodesmium in a bucket of sea water.
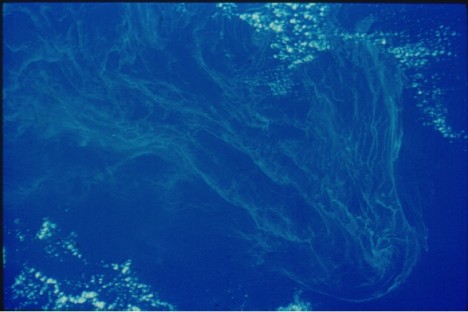
A Trichodesmium bloom in the Pacific Ocean seen from space.
Trichodesmium, it turns out, just loves these sea conditions – just as much as SPURS oceanographers love the North Atlantic salinity maximum!
