By Eric Lindstrom
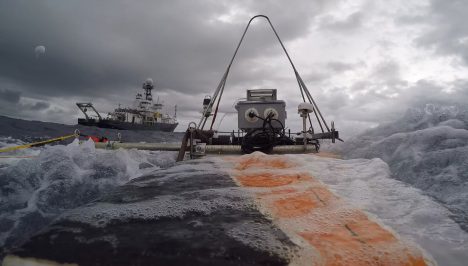
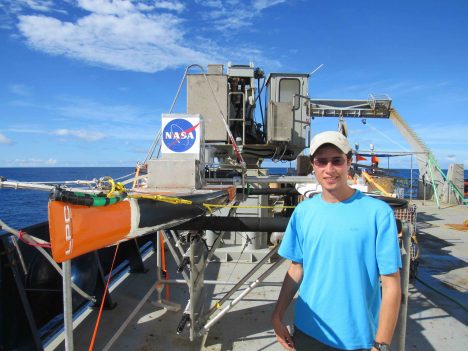
The R/V Revelle and the Lighter-Than-Air InfraRed System (on the left corner), as seen from the Surface Salinity Profiler. Credit: Dan Clark.
Kyla Drushka from University of Washington Applied Physics Laboratory (APL) received a National Science Foundation grant to participate in SPURS-2. It is one cornerstone of our work and is entitled “Rain-Formed Fresh Lenses in SPURS-2.” The idea of rainfall resulting in freshwater puddles or lenses at the sea surface is (perhaps) easy to imagine but is very tricky to observe and study in the real world. SPURS-2 will provide a wealth of new data on this subject with which to test the fidelity of our scientific imagination.
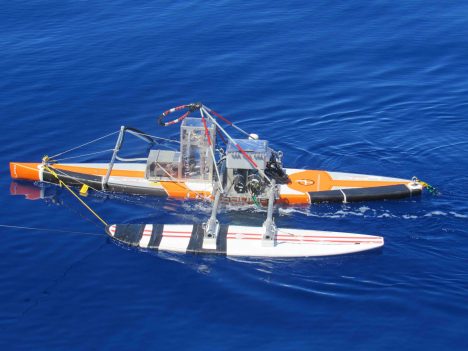
A beauty shot of the Surface Salinity Profiler.
Kyla and the APL crew have a variety of instruments aboard R/V Revelle but the Surface Salinity Profiler (SSP) is central to SPURS-2 science objectives. When you want to know the fate of rainwater after it hits the sea surface, measuring salinity (or equivalently the amount of freshwater) in the upper meter of the ocean is crucial. The profile of salinity in that top meter of the ocean is elusive for a number of reasons – technical and logistical. Technically, salinity sensors require some time and bubble-free water flow to make the measurement. However, normally the sea surface is rapidly moving up and down (because of waves!) so a sensor is not always in the water and away from bubbles until it is several meters below the surface. Finding a way to tow salinity (and other) sensors at fixed, shallow depths following the motions of the sea is another approach. APL scientists and engineers including Andy Jessup, Bill Asher, and Dan Clark designed the SSP to apply this approach.
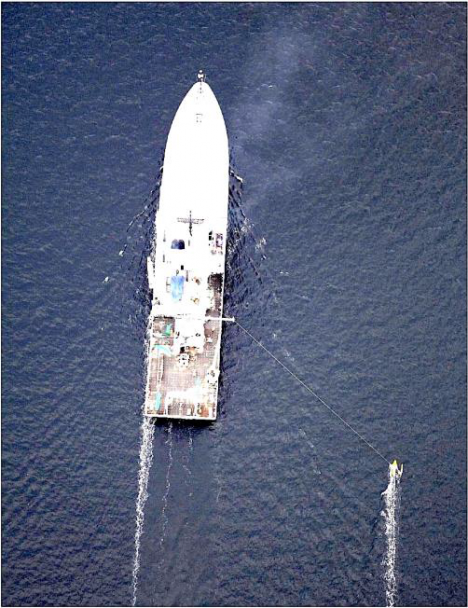
How the Surface Salinity Profiler runs outboard the ship — photo taken from the Lighter-Than-Air InfraRed System balloon camera.
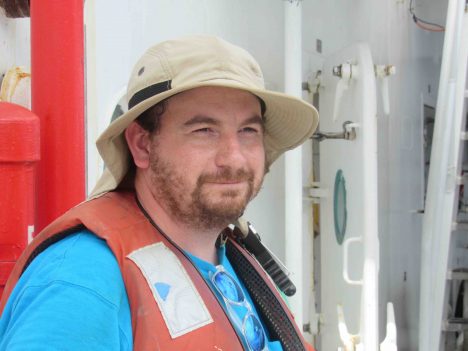
Dan Clark, APL engineer extraordinaire.
The SSP platform is a converted paddleboard with a keel and surfboard outrigger. It is tethered to the ship so it skims the sea surface outside the wake or influence of the ship. Below the paddleboard, on the leading edge of the keel, are salinity (and temperature) sensors at depths of 10 centimeters (4 inches), 30 centimeters (1 foot), 50 centimeters (1.64 feet), and 100 centimeters (3.28 feet), microstructure sensors (to estimate turbulence), and cameras. The Salinity Snake (see my last blog entry) supplements the SSP by providing temperature and salinity in the upper few centimeters of the ocean. The SSP can be towed for many hours before the instrument batteries need refreshing.
Deployment of SSP is most informative when there is a rain event, leading to stratification of the near-surface ocean with less dense fresher water on top of denser saltier water. If there is a rain event ahead of the ship, the SSP goes in the water. Then it can measure how the ocean changes over the periods from before rain, during rain, and recovering from rain. Salinity from several depths and simultaneous turbulence estimates are then used to determine how rainwater mixes into the ocean.
Suneil Iyer with Surface Salinity Profiler on deck (sensor to bottom left on keel)
Suneil Iyer is a new graduate student at University of Washington who will work with Kyla on interpretation of the microstructure measurements from the SSP data. He just arrived in Seattle from his hometown of Kansas City, Kansas, one week before the R/V Revelle departure from Honolulu. He just had time to find an apartment before jumping on a plane for SPURS-2. Graduate school in oceanography can be a blast of new experiences! This is not his first exposure to physical oceanography: Suneil worked on tides in estuaries during his undergraduate work at University of South Carolina.
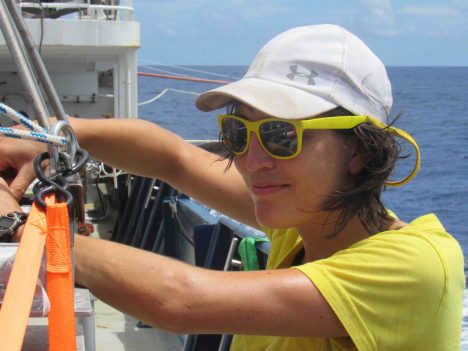
Kyla Drushka working on the Surface Salinity Profiler.
Kyla Drushka joined UW in 2014 after PhD work at Scripps Institution of Oceanography. She is now an active member of NASA’s Ocean Salinity Science Team and the mission science team for the Surface Water Ocean Topography satellite that is planned for launch in April 2021.
This blog entry goes to press near an auspicious moment on R/V Revelle SPURS-2 voyage. Saturday at 2 am (local time) is the halfway point of our expedition! In our oceanography lexicon we would call this the “hump day” for our voyage. For all you land-loving 5-day-a-weekers hump day might mean Wednesday. For the 24/7 work at sea, we really have only a “hump moment” to mark the halfway point of a continuous work schedule. Like any good NASA activity, people aboard have countdowns running to both our hump moment and our arrival back in Honolulu (8 am on Sept. 23). Amusement is in short supply!
By Eric Lindstrom
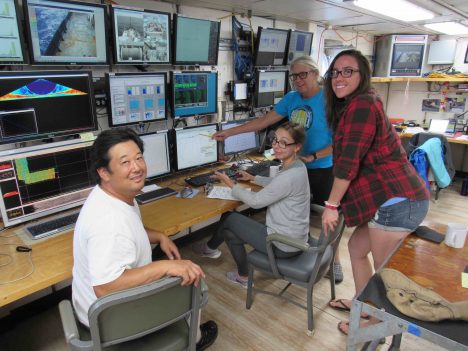
The CTD team (Spencer, Leah, Janet, and Kristin).
The focus of SPURS-2 is the upper ocean and the fate of rainwater. However, in order to study the top of the ocean one needs to know what is going on deeper down. The beauty of SPURS-2 is not skin-deep! SPURS-2, like many prior physical oceanography experiments, requires a basic background and context of the ocean circulation environment upon which many of our other more specialized or detailed measurements can be interpreted. The two major pieces of the contextual information for us are the surface circulation and the surface salinity pattern.
The surface salinity pattern is provided by remote sensing for the largest scale and by the array of drifters and profiling floats that have been deployed with salinity sensors. Also, the R/V Revelle is collecting a treasure trove of upper ocean salinity measurements wherever she goes – with continuous underway measurements of salinity from intakes at the surface, 2 meters (6.5 feet), 3 meters (9.8 feet), and 5 meters (16.4 feet) depths. I’ll go into that in more detail in a later blog on the Surface Salinity Profiler.
The surface circulation of the ocean is largely the result of the wind and the shape of the massive deep layers below the surface. In fact it can be crudely estimated if one knows the precise shape of the thermocline – the boundary between the warm upper ocean and the vast deep cold ocean. Here in the tropics the thermocline is pretty well represented by the 20°C (68° F) isotherm. Think of the warm upper ocean as all the water warmer than 20°C and the layer below as all the water colder than 20°C. Tropical oceanographers can use the depth of the 20°C isotherm much like meteorologists use surface atmospheric pressure maps to chart the highs and lows of weather and their associated winds. Here, if the 20°C isotherm rises toward the surface locally it is associated with a counterclockwise ocean surface current. The signature of the westward North Equatorial Current is a gentle slope of the isotherm from deeper in the north to shallower in the south. This is where our Conductivity-Temperature-Depth (CTD) instrument comes into the SPURS-2 plan. We can use it to track the shape of the thermocline. I wrote about the CTD during the SPURS-1 campaign. It is still the workhorse of physical oceanography – or maybe the monkey on the back of every physical oceanographer! Our show seldom goes on without it.
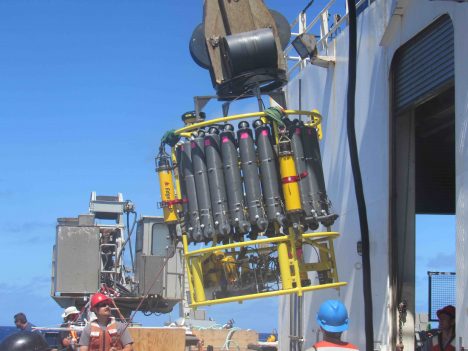
Preparing the CTD to go over the side.
Janet Sprintall from Scripps Institution of Oceanography and her team (Spencer Kawamoto, Leah Trafford, and Kristin Fitzmorris) are now mapping the temperature and salinity structure of the ocean well into the deep cold abyss (to 1.5 kilometers –0.93 miles– below the surface). The ocean depth is about 4.5 kilometers (2.8 miles) and the lower 3 kilometers (1.86 miles) are (for our purposes) relatively uniform and cold. Janet has planned a grid of 49 stations 30 miles apart around the SPURS-2 central mooring. These will be completed over about a week’s time. Simultaneously there will be regular sampling with the Surface Salinity Profiler between some of the CTD stations and we will optimize our meteorological measurements by limiting our speed to 10 knots (11.5 mph). So, while studies of the meteorology and near surface salinity are ongoing, as we move about the ocean, Revelle stops for an hour every 30 miles to collect necessary information on the background oceanographic conditions.
The CTD instrumentation remains largely unchanged (although perfected) in recent decades. Temperature, salinity, and oxygen sensors are mounted on the bottom of a large frame. Water sample bottles are mounted around the outside of the frame. Other instruments, such at the acoustic Doppler current profiler, may also be mounted on the frame. All data is transmitted up the conducting wire cable that is used to raise and lower the instrument. This bulky package is now easier to deploy and recover than in yesteryear due to innovations on today’s vessels. Now the Revelle has a specialized mechanical arm to get the CTD over the side and back on deck safely without much human intervention.
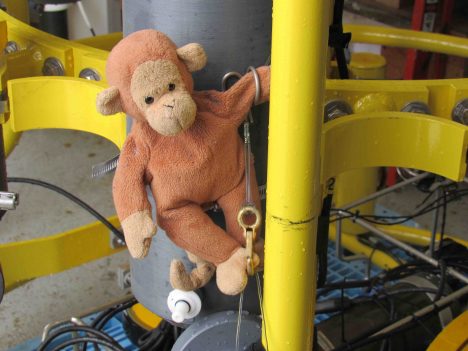
Monkey climbing over the water sample bottles on the CTD.
For my entire career oceanography has been spelled “CTD.” Knowing the temperature and salinity structure from surface to ocean depths is the key to our understanding of the ocean’s role in climate. The first global mapping of these characteristics (with CTDs) was not realized until the World Ocean Circulation Experiment in the 1990’s. Now oceanographers are working hard to understand all the physical, chemical, and biological changes associated with global warming, rising carbon dioxide levels, and industrial fishing. In that big picture, SPURS-2 might look like a small bit of monkey business over the tropical thermocline. However, we know that the resulting scientific understanding will long outlive the memory of our tiny field program in this vast Pacific Ocean!
By Eric Lindstrom
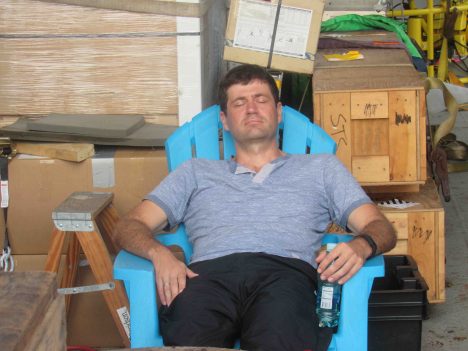
Denis Volkov taking a break from work in the afternoon.
One of the popular topics of conversation during the first week of the voyage has been sleep. Whether it is poor sleep, good sleep, disturbed sleep, or deep sleep, almost everyone in the science party has had something to say about the subject of sleep.
Sleep on a ship is special. As you can imagine, the rocking and rolling (actually pitching, rolling, and yawing) can be a gentle sleep inducement – unless it is making you terribly sick! What those on land probably cannot imagine are all the noises associated with the ship – the engines, equipment, and the sea slapping at the ship. An amazing array of new hums, grinds, bangs, bumps, slams, alarms and conversations must be assimilated into one’s sleep life.
After a week of hard work preparing the ship for sea in Honolulu, it is no surprise that many slept well the first night. However, the next couple days were much harder for some. The mild seasickness and the abnormal noises from the ship unsettled sleeping patterns. More than one person commented to me that their adjustment and best sleep came around day 5. By that time all the seasickness had past and the sounds of being at sea had been incorporated into ones dreams. Soon we will start weeks of 24/7 operations and the luxury of long sleeps may be over until the transit back to Honolulu. Sleep may get interrupted when operations call.
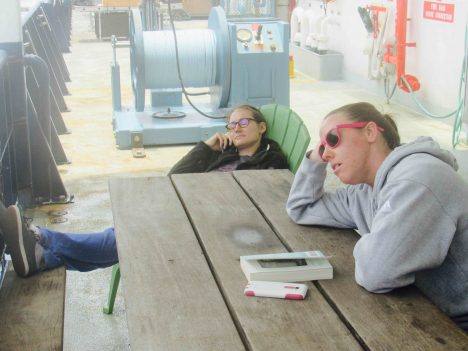
Audrey and Kristen during the early seasick times.
Many scientists will be on 12-hour watches (noon to midnight or midnight to noon) so one should not be too worried out lack of sleep among your favorite scientists. It is more likely that one’s normal rhythm of sleep may be at odds with duties.At sea it is not abnormal to find people eating, sleeping, exercising, and working at odd hours.
Part of writing about sleep now is because (at this writing on Sunday afternoon, August 21) we have completed our transit from Honolulu to 125W longitude and are beginning 24-hour scientific operations with a southbound trek along the meridian. We will be deploying drifters at regular intervals, profiling temperature and salinity while underway, and deploying three moorings along this meridian.
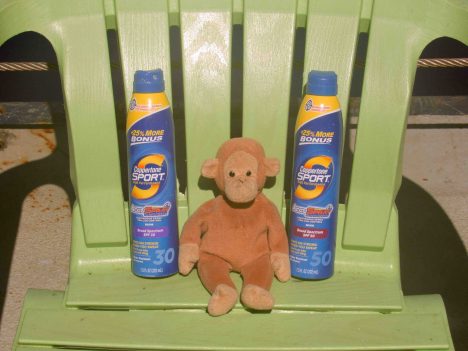
Monkey working on his “monkey tan” at steel beach.
Let me finish today with a little local story about sleep. Andrew Meyer, the mooring technician from the National Oceanic and Atmospheric Administration, has a son, Jack, who is 3 and a half years old. Jack sleeps with his plush toy Monkey every night. When dad left home for the SPURS-2 expedition, Jack sent Monkey along so Andy would not be lonely. So Monkey is having a good time, sending pictures to Jack and family regularly. Monkey is certainly helping Andy keep in touch with his loved ones and that also means that Monkey is helping Andy sleep better at night. So, dear readers, Monkey joins the blog today to honor all that we do to sleep well and to remember those we left at home as we work, and sleep.
Sunset at sea on Aug. 21.
I leave you today with a sunset and hope that all of you will sleep well!
