As we head into the 2018 Atlantic hurricane season, now is a good time to reflect on the accomplishments achieved by CYGNSS since its launch in December 2016. Early mission operations focused on engineering commissioning of the satellites and of the constellation as a whole. One achievement in particular is noteworthy. The satellites have no active means of propulsion, yet their relative spacing is important for achieving the required spatial and temporal sampling. The desired spacing is achieved by individually adjusting a spacecraft’s orientation and, as a result, the atmospheric drag it experiences. This technique is referred to as “differential drag”. An increase in drag will lower a satellite’s altitude, thereby changing its orbital velocity. We adjust the distance between spacecraft by adjusting their relative velocities. This is a new way of managing the spacing between a constellation of satellites, and one that can be significantly less risky and lower in cost than using traditional active propulsion. As a result, we were able to afford more satellites for the same price, which ultimately led to better, more frequent, sampling of short lived, extreme weather events like tropical cyclones.
Here is a figure, provided by CYGNSS team member Kyle Nave of ADS, illustrating the change in relative speed between two of the CYGNSS spacecraft that occurred the first time a differential drag maneuver was performed, on February 23, 2017.
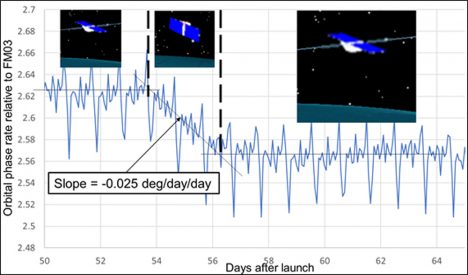
The orbital phase rate between the two spacecraft is shown before, during and after the higher of the two had its orientation changed to maximize atmospheric drag. Phase rate measures how quickly the angle between two satellites changes. By increasing the drag on the higher one, it lowers to an altitude and orbital velocity closer to the lower one, thus reducing the phase rate. This was an important first confirmation of our ability to perform the maneuver. Since then, there have been many more drag maneuvers. Five of the eight satellites are now properly positioned relative to one another at a common altitude, and the remaining three are expected to have their drag maneuvers completed later this year.
The primary science objective of the CYGNSS mission is measurement of near surface wind speed over the ocean in and near the inner core of tropical cyclones. In an earlier NASA blog, (15 Dec 2017), I reported on our measurements of Hurricane Maria made in September 2017. Since that time, we have been examining the quality of our measurements both within and away from major storms. Measurements at ocean wind speeds below 20 m/s (44 mph) were found to have an RMS uncertainty of 1.4 m/s (3 mph). Measurements of storm force winds during the 2017 Atlantic hurricane season were found to have an uncertainty of 17% of the wind speed. The analysis that produced these results is reported in Ruf et al. (2018). DOI: 10.1109/JSTARS.2018.2825948.
CYGNSS operates continuously, over both ocean and land, and the land data have been another focus of recent investigations. The quality of some of those measurements, in particular regarding its spatial resolution, has come as something of a pleasant surprise. Here is one example of CYGNSS land imagery, of the Amazon River basin in South America, provided by Dr. Clara Chew of UCAR.
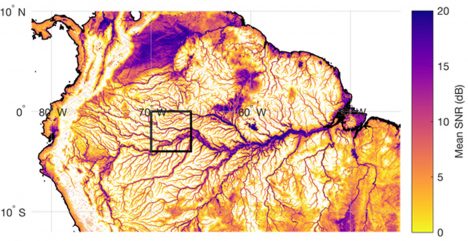
In the image, inland water bodies are prominently visible. This includes not only the major arms of the Amazon River but also its quite narrow minor tributaries. Careful examination of this and similar CYGNSS images suggests that the spatial resolution is markedly better here than it is over typical open ocean areas. The explanation lies in a transition of the electromagnetic scattering from an incoherent, rough surface regime over ocean to a largely coherent, near specular regime over inland waters. The fact that coherently scattered signals have inherently better spatial resolution is a well known phenomenon. What was unexpected is the widespread, global extent to which land surface conditions support coherent scattering. It requires the height of the surface roughness to be significantly below the wavelength of the radiowave signal, which in our case is 19 cm. This is apparently a ubiquitous property of wetland regions. It is a very fortuitous property for us, as it should enable an entirely new direction in scientific applications of CYGNSS measurements over land. NASA has recently added new investigators to the CYGNSS team specifically to study these new and exciting land applications.
A recent article summarizing these and other CYGNSS achievements, as well as some of the future applications of its measurements, is available at <www.nature.com/articles/s41598-018-27127-4>. The mission has demonstrated that smaller, more cost-efficient satellites are able to make important contributions to the advancement of science. In the months and years ahead, CYGNSS will hopefully be able to demonstrate that those advances can lead to practical scientific applications, such as extreme weather monitoring and prediction, that will benefit humankind.
CYGNSS was launched into low Earth orbit on December 15, 2016 at 08:37 EST and today is its first anniversary. The mission has had a very busy first year on orbit, transitioning from an early engineering commissioning phase into the science observing phase in time for the very active 2017 Atlantic hurricane season. The mission was supported during the hurricane season by the NOAA Airborne Operations Center (AOC), which operates a fleet of P-3 “hurricane hunter” airplanes that make reconnaissance flights into tropical storms and hurricanes to observe wind speed and other weather conditions first hand. We worked closely with AOC to coordinate many of their flight campaigns with overpasses of the storms by CYGNSS. They were able to time many of their eyewall penetrations to align closely in both time and space with our overpasses, which helps us train and evaluate our own wind speed measurements As a result, we now have dozens of coincident tracks of wind speed observations through the inner core regions of Hurricanes Harvey, Irma, Jose and Maria. The collaboration with NOAA this summer and fall has been incredibly fruitful, and I and the CYGNSS project team are very grateful for their generous support.
As the 2017 hurricane season winded down, we turned our attention to processing the coincident overpass data and characterizing and evaluating the performance of our wind speed measurements. One example is shown here. On September 24, 2017 at 18:13-18:21 UTC, the CYGNSS FM#2 spacecraft flew across Hurricane Maria.
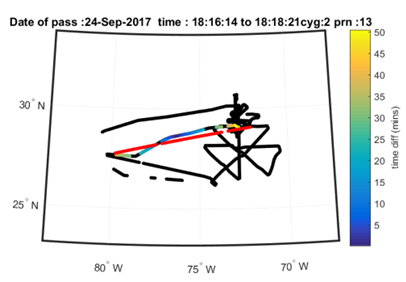
The red line in the figure shows the track of the specular reflection from transmissions by the GPS PRN#13 satellite. CYGNSS makes its wind measurements along this track. The black line in the figure shows the flight path of the P-3 hurricane hunter that day. A distinctive cloverleaf pattern can be seen that results from the plane making multiple eyewall penetrations. The colored portion of the P-3 flight path is the leg closest in time and space to the CYGNSS specular point track. The color scale represents the difference in time between the CYGNSS overpass and the P-3 observing time. With such close coincidence in time and space, we hope and expect that the two measurements of wind speed will be consistent.
The next figure shows the wind speed measured by CYGNSS (blue), measured by the P-3 airplane using its Stepped Frequency Microwave Radiometer (SFMR) wind speed sensor (red), and produced by the ECMWF and GDAS numerical weather prediction (NWP) models (black) along the CYGNSS specular point track.
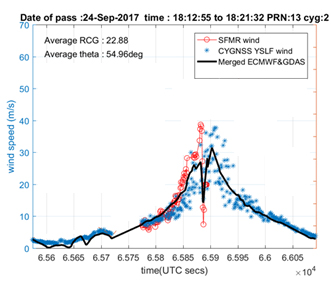
Away from the storm center at lower wind speeds, CYGNSS and NWP measurements agree well. Near the storm center, CYGNSS responds to the much higher wind speeds. In general, NWP models tend to underestimate peak winds in large storms and this is likely the case here. While NWP models generate winds everywhere, SFMR winds are only available along the portion of the satellite track where the P-3 airplane flew. In the region where coincident measurements were made, CYGNSS and SFMR winds can be seen to agree fairly well. It should be noted that the scatter present in the CYGNSS measurements can be seen to increase as the wind speed increases. This is probably a result of the decrease in GPS signal strength scattered in the specular direction when the sea surface is significantly roughened by high winds. How best to handle this characteristic of the CYGNSS wind speed retrievals will be an important topic of upcoming investigations.
Happy Birthday, CYGNSS!
p.s. and just in time for the first year anniversary of CYGNSS on orbit, new science data files using the latest (v2.0) engineering calibration and science retrieval algorithms have just been posted at the NASA PO.DAAC web site. Access the data by going to
https://podaac.jpl.nasa.gov/dataset/CYGNSS_L1_V2.0
https://podaac.jpl.nasa.gov/dataset/CYGNSS_L2_V2.0
https://podaac.jpl.nasa.gov/dataset/CYGNSS_L3_V2.0
and selecting the ‘Data Access’ tab to reach an FTP link to the data files.
Since I last posted, AV-6 flew a successful mission over Cristobal. Meanwhile, AV-1 is still stuck in California until crews can figure out the electrical issues that are affecting the aircraft. Those of us on the AV-1 instrument teams, which includes the team I’m on, are starting to get pretty jealous of AV-6’s ability to actually fly. One of the most frustrating parts of being on an instrument team is waiting around until both your aircraft is available to fly and there is a good target for your aircraft to fly over. When we do get to fly, every instrument team has to staff the Global Hawk Operations Center, or GHOC. Thanks to multiple shifts of researchers and pilots, we can fly the UAVs for long lengths of time—all from the comfort of our desks! In the GHOC, researchers don headsets and monitor our instruments to make sure they are working properly; which is less flashy than it sounds. However, I still cannot wait to be a part of a flight. I’m staying patient and thinking positively about getting AV-1 here at Wallops.
On Thursday, August 28th, I was able to watch AV-6 take off from Wallops Flight Facility. The black plane that you can see in the linked video is flown as an added safety precaution as it follows the UAVs during take off to make sure no other aircraft crosses its path. The photo below shows what Cristobal looked like shortly after take off around 7 pm from the Geostationary Operational Environmental Satellite (GOES):
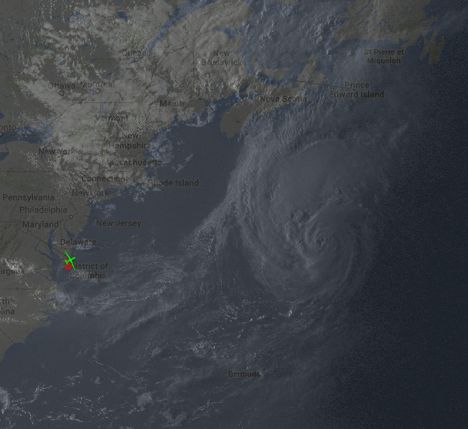
Slightly after AV-6 (green aircraft icon) took off from Wallops Flight Facility on August 28, 2014, Hurricane Cristobal was located just off the East coast of North America. This image is a combination of GOES visible imagery and a Google map for reference.
One of the challenges for mission scientists during this flight was that Cristobal was moving rapidly. Throughout the night, forecasters and scientists were altering the flight plans to account for the fast motion of the storm as well as commercial air traffic in the region, in order to get the best possible coverage of Cristobal. Overall, the flight was a success and the mission’s objectives were achieved.
While I was tracking AV-6 on the way home from Cristobal, I had fun looking at the imagery that was taken from a camera on the bottom of the aircraft. Below is a photo captured on the way home from Cristobal on August 29th:
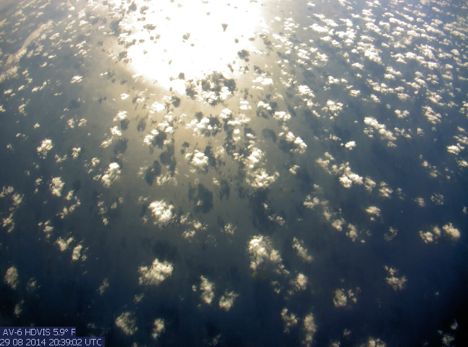
Imagery from AV-6 on the way home from sampling Cristobal; Sunlight reflects off the Atlantic Ocean and clouds cast shadows onto the sea surface
After the excitement of Hurricane Cristobal, forecasters and scientists are looking for the next storm to target. The National Hurricane Center has given a tropical wave over the northwestern Caribbean a 60% chance of tropical cyclone formation over the next 5 days. This system will likely be AV-6’s next target in the Bay of Campeche on Tuesday, September 2nd. If you would like to follow along with the flight you can track AV-6 on this page.
Welcome to the HS3 blog! My name is Mary Morris and I am a graduate student studying atmospheric science at the University of Michigan. Over the next few weeks I will be posting about my experiences while I participate in the HS3 mission at NASA Wallops Flight Facility.
HS3 is a mission designed to investigate the processes that control hurricane formation and intensification. In order to collect observations of hurricanes we have two unmanned aerial vehicles (UAVs) outfitted with meteorological instruments that we can fly for long distances to reach hurricanes and storms forming in the Atlantic Ocean basin. On one of those UAVs, AV-1, is an instrument called the Hurricane Imaging Radiometer, or HIRad. My graduate research is currently focused on extracting surface wind speed and rain observations from HIRad data, so participating in the collection of HIRad data is an exciting opportunity. While the HIRad team has been here at Wallops since August 25th, we are still awaiting AV-1’s arrival. Until then, HS3 scientists will be relying solely on the other UAV, AV-6, to investigate hurricanes.
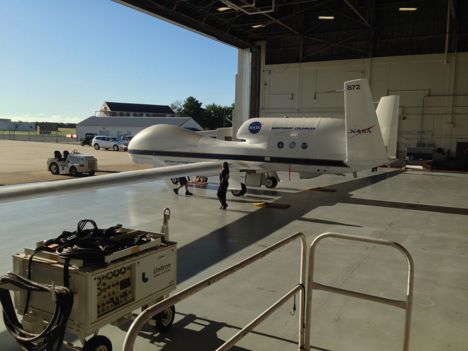
AV-6 arrives at the Wallops Flight Facility on August 27, 2014
Wallops Flight Facility (WFF) welcomed AV-6 back from Armstrong Flight Research Center (AFRC) on August 27th. On the way to WFF, AV-6 was able to get a good set of observations of Hurricane Cristobal. In order to collect data on the storm’s environment, AV-6 uses three types of instruments. First, dropsondes are—you guessed it—dropped from AV-6 to gather information about air temperature, dewpoint, atmospheric pressure, and winds. Dropsondes are similar to weather balloons. The Scanning High-resolution Interferometer Sounder, or S-HIS, is used to gather information about air temperature and water vapor. And finally, the Cloud Physics Lidar, or CPL, is used to gather information about clouds and aerosols in the atmosphere. All of these observations are helpful for analyzing the environment of a hurricane.
Since the UAVs can fly long distances, we are going to get a good second look at Cristobal later tonight and tomorrow. HS3 scientists are particularly interested in observing Cristobal as it interacts with a frontal zone. As Cristobal interacts with the frontal zone, it will lose the characteristics that make it a tropical cyclone and gain characteristics that will make Cristobal an extratropical cyclone. In short, the differences between these two types of cyclones have to do with where the cyclones get their energy. With the NOAA Hurricane Hunters collecting data on Cristobal from the beginning, and with HS3 following up on Cristobal tonight, atmospheric scientists will have lots of observations that document Cristobal’s life cycle. These observations will then help scientists as they continue to research the processes that underlie hurricane formation and intensification.
