Fieldwork notes, July 21-August 3, 2023
Summer fieldwork for our project, “Clarifying Linkages Between Canopy Solar Induced Fluorescence (SIF) and Physiological Function for High Latitude Vegetation,” once again took our team from University of Maryland Baltimore County north to the boreal forests of central Alaska. We visited this area in the spring to collect data during the very start of the growing season, and now we are returning to collect data during the peak of summer.
This project is part of the NASA Terrestrial Ecology program’s Arctic-Boreal Vulnerability Experiment (ABoVE). The goal of ABoVE is to improve our understanding of high latitude ecosystems, how these ecosystems respond to climate change, and how satellite data can provide information to describe ecosystem processes and aid management decisions.
Our study focuses on measuring light emitted by plants called solar induced fluorescence. Green leaves absorb light, and through photosynthesis take in carbon dioxide and water and produce oxygen and sugars. Fluorescence occurs during photosynthesis as some of the absorbed light energy is radiated out from the plant. The amount of light fluoresced is only a very small fraction of what is absorbed, which is why our eyes don’t see plants glowing. In our study, we use sensitive instruments that can detect this fluorescence. Our goal is to better understand the sources of fluoresced light and how to use this information to describe productivity in boreal forests and tundra.
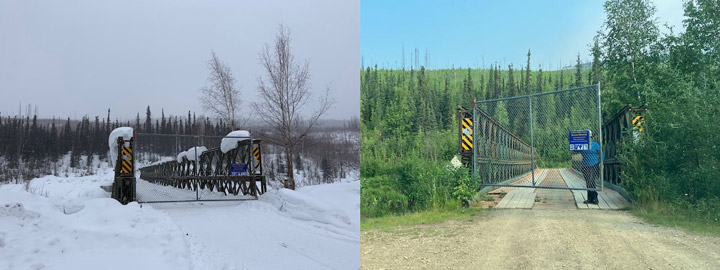
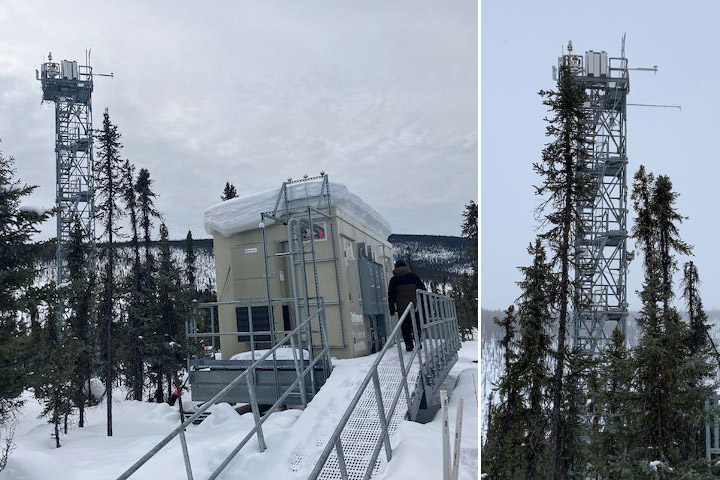
Our study site is at the Caribou Creek flux tower run by the National Science Foundation’s National Ecological Observatory Network (NEON). In spring, we deployed automated instruments at the NEON tower site that continuously collect data. On this trip, we are checking on how they have been working.
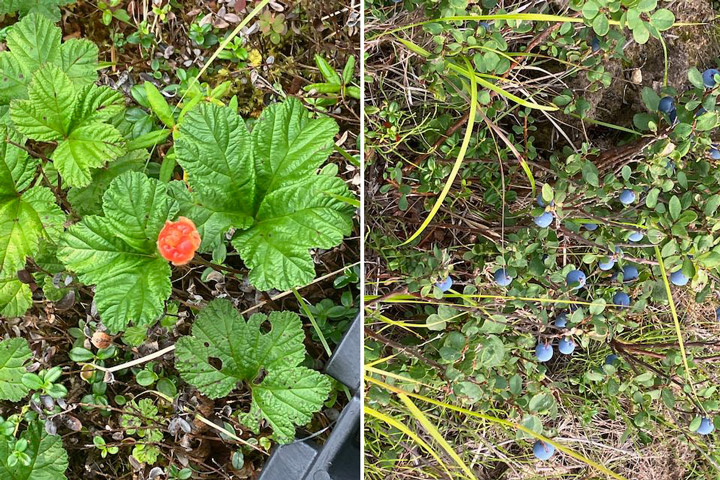
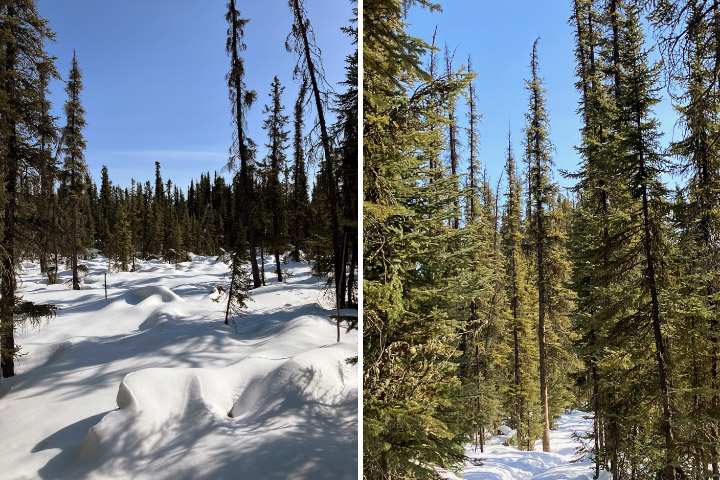
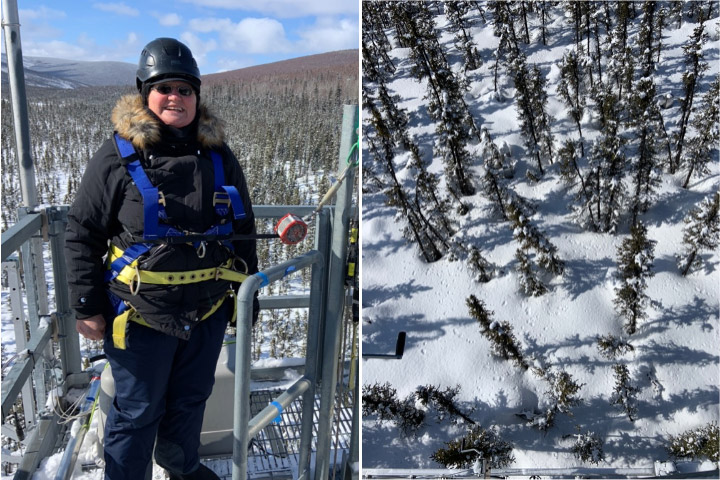
In July there was a big change from our previous visit in April. In April, the area had a deep snow cover with temperatures dropping below 0°F, while during this visit the daytime temperatures were in the 80s F and the ground was now all green (images below).
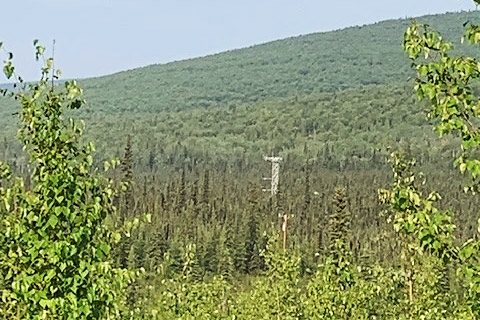
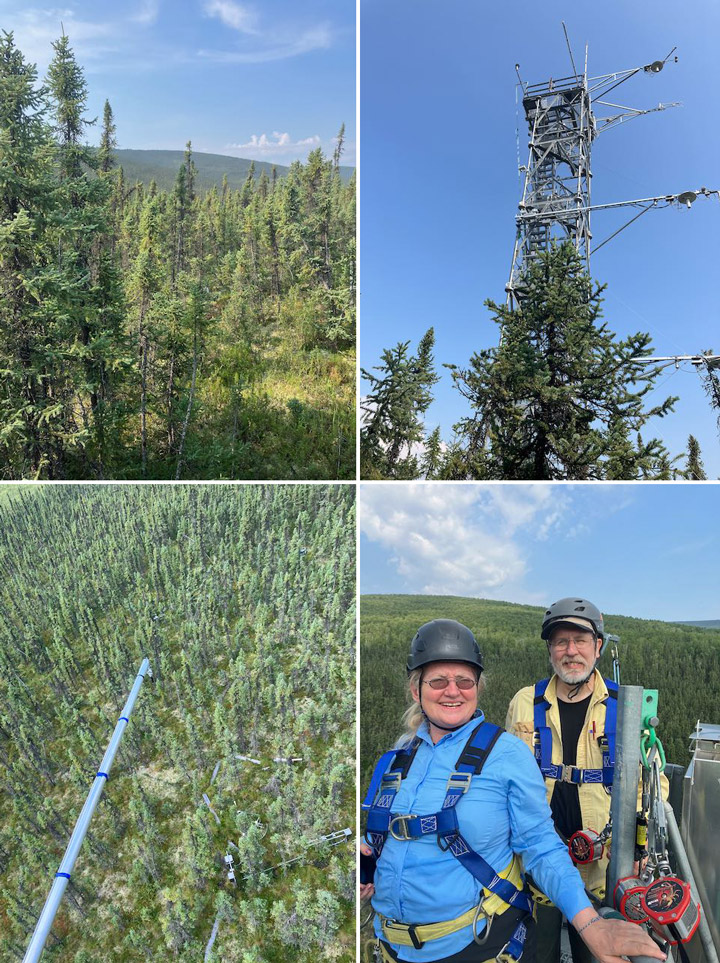
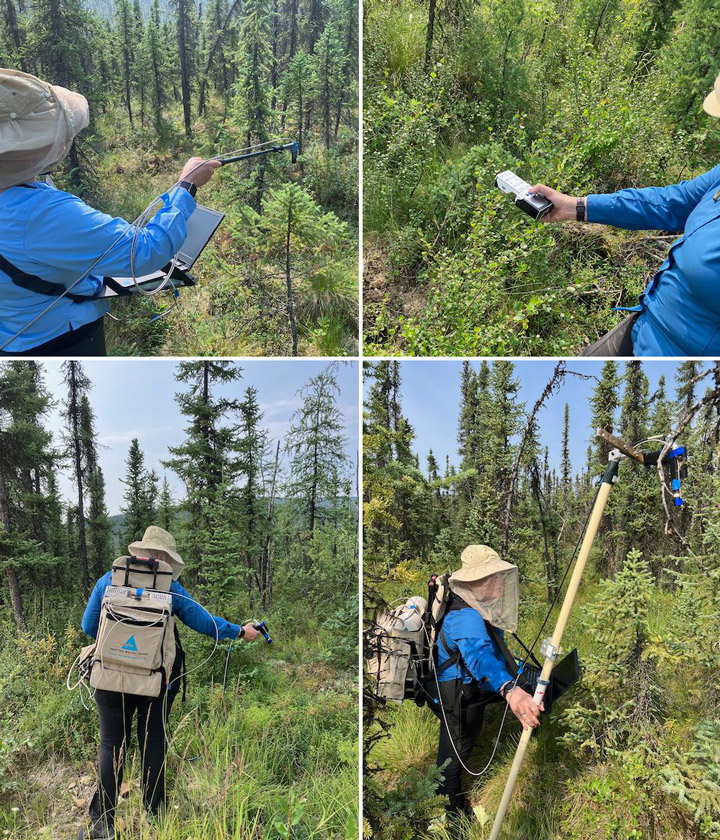
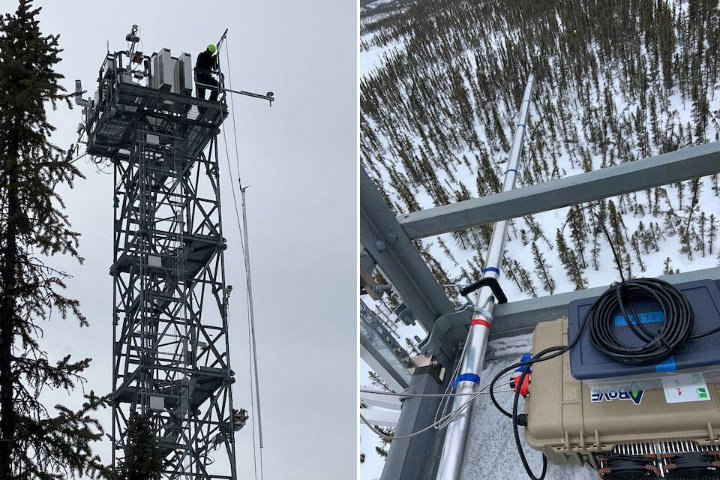
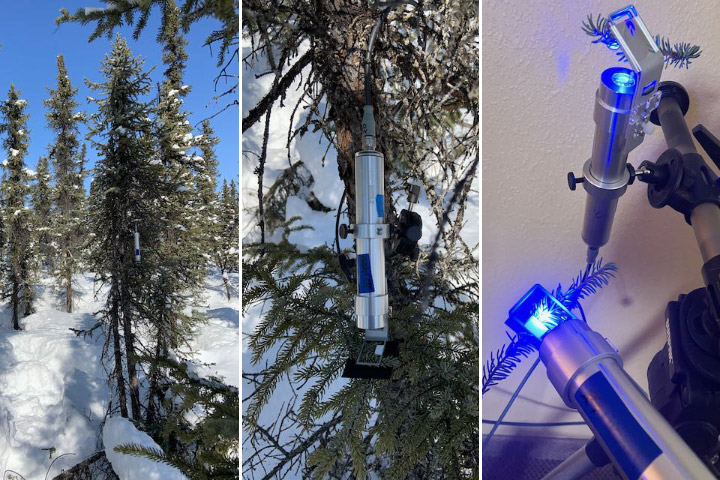
On the top of the tower we have an instrument called a FLoX (Fluorescence Box). The FLoX views a patch of forest from above, and every few minutes during the day it measures the reflected light and solar induced chlorophyll fluorescence. This provides us with a description of plant activity at different times of the day through the growing season (images below).
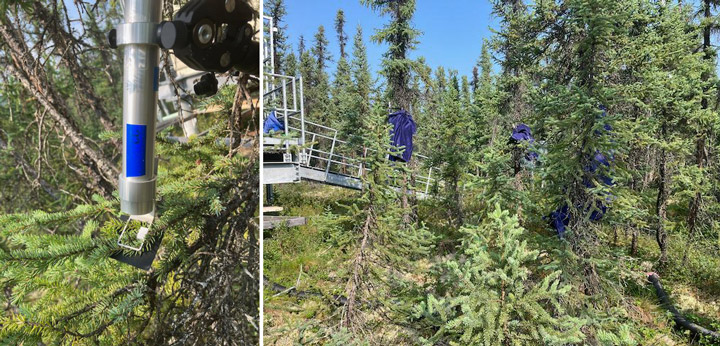
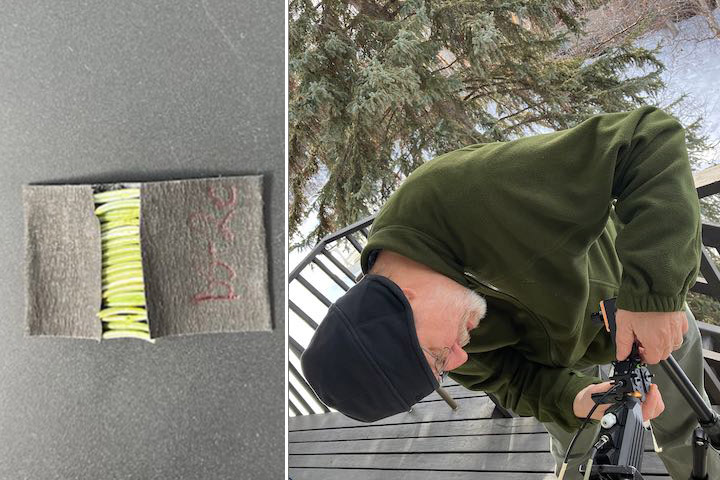
Also at the site we have monitoring PAM (MoniPAM) instruments attached to shoots of the spruce trees. The MoniPAM probes shine pulses of light at individual spruce shoots to measure fluorescence and photosynthetic processes at the leaf level (images below). We put blankets over the probes for a while to dark-adapt the shoots to measure their response when unstressed. In the spring, we put the MoniPAM probes in easy-to-reach places when there was a lot of snow on the ground. On this trip, when we returned to check them in the summer, we found we had to really reach up to get them without the snow to stand on.
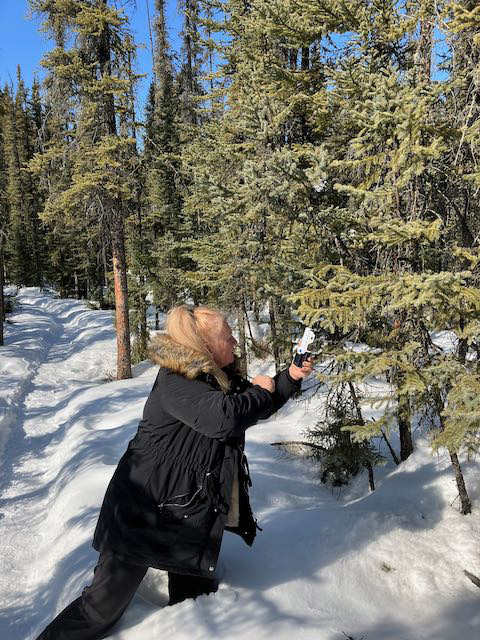
From the ground, we collected reflectance and fluorescence measurements (similar to the data collected by the FLoX) of individual plants in the FLoX field of view and a variety of representative plants in the larger area surrounding the tower. These measurements will help us understand the local variability (images below).
A lot of the ground cover was cotton grass (Eriophorum spp.) that forms tussocks, which are tight clumps of grasses. The tussocks made walking through the area difficult, like walking on half-buried basketballs, so it was easy to twist an ankle, especially with a heavy backpack spectrometer on your back.
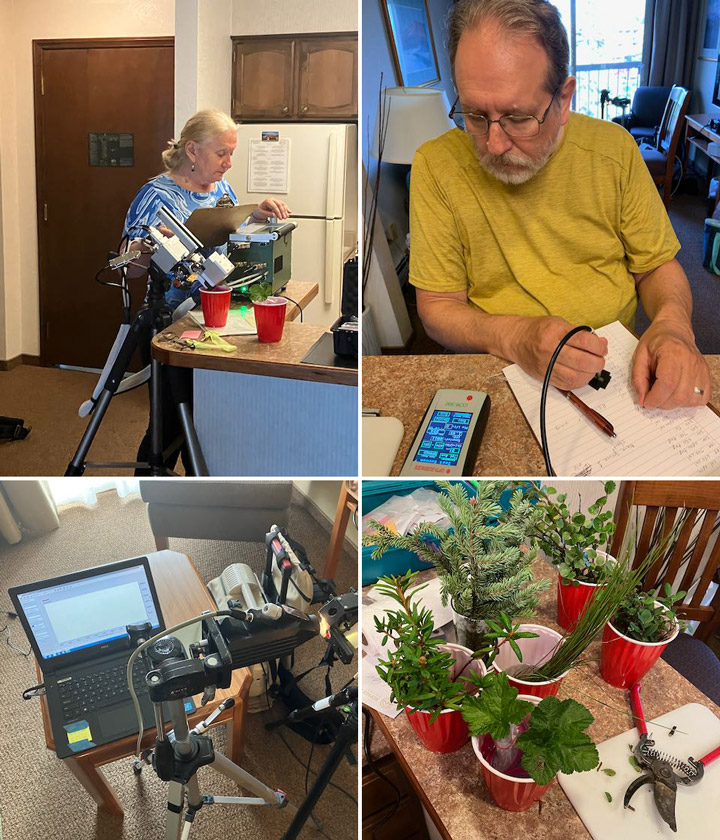
We collected branch samples to make measurements of leaves and needles that we will use to parameterize models of vegetation fluorescence and productivity (images below).
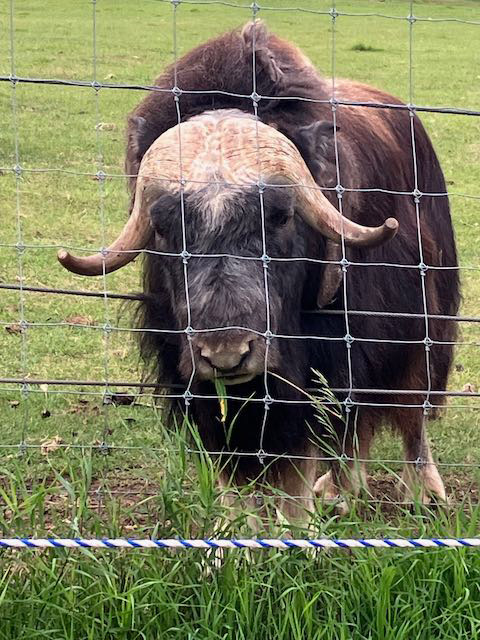
We took a little time off to visit some other places in the area. We saw musk ox, which are animals of the tundra but raised in captivity at the University of Alaska Fairbanks’ Large Animal Research Station. Their thick, shaggy coat keeps them warm through the frigid arctic winters. Under the long guard hairs is a soft wool called qiviut that musk oxen shed in the spring. Qiviut can be spun into a very warm and soft yarn. Small balls of qiviut yarn can sell for over $100.
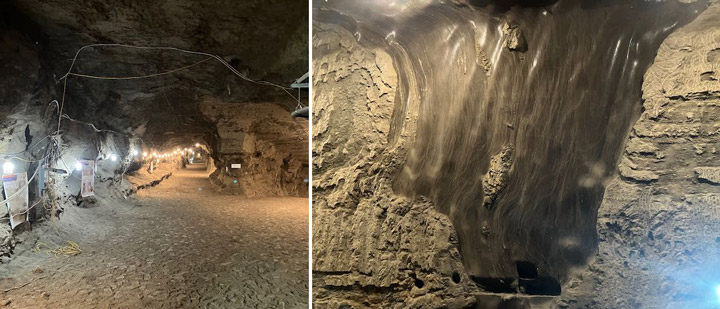
On our last day in Alaska we visited the Cold Regions Research and Engineering Laboratory (CRREL) Permafrost Tunnel Research Facility (images below). Permafrost refers to soil that has been frozen continuously for more than two years. The permafrost around Fairbanks, Alaska, is considered ‘warm’ (at a temperature of -0.3oC/-0.4oC) as compared to the permafrost in our other study site in the North Slope of Alaska at Utqiagvik (e.g., a temperature -3oC/-4 oC). This warm permafrost is very sensitive to the changes in soil temperatures that can result from fires, rain events, and other disruptions that can cause permafrost thawing. Thawing permafrost can result in damage to roads and buildings and cause disturbance in forests.
The permafrost tunnel is dug into a hillside through earth that has been frozen for thousands of years. The tunnel reveals bones of extinct ice age animals, plants preserved since the ice age, and large ice wedges that can take hundreds to thousands of years to form. The ice wedges cause the formation of polygonal patterned ground, where the ground surface is covered with a pattern of shapes of slightly higher or lower ground. Our study site in Utqiagvik was in an area of high centered polygons, so it was interesting to be able to actually see the shapes of the underground ice that formed that unique landscape.
The boreal forest is Earth’s northernmost forest. It circles the Earth at high latitudes, covering large parts of Russia, Canada, Scandinavia, and Alaska. These forests are some of the largest intact forests on Earth. They store a large amount of carbon—as much as (if not more than) is stored in tropical forests. The trees use photosynthesis to grow, and in the process, they take in carbon dioxide from the atmosphere. Carbon dioxide is an important greenhouse gas and a driver of global climate change, which is why it is vital to understand the rates of the transfer and storage of carbon between the atmosphere and the boreal forest.
Due to their vast area and remoteness, boreal forests are difficult to monitor from the ground. Data from satellites provide the means for observing these forests’ condition and detecting change across wide areas. In our project, “Clarifying Linkages Between Canopy Solar Induced Fluorescence (SIF) and Physiological Function for High Latitude Vegetation,” our team from University of Maryland Baltimore County, NASA’s Goddard Space Flight Center, and the University of Texas El Paso is working to develop advanced approaches to using satellite data to describe boreal forest productivity and detect stress responses. Our project is part of the NASA Terrestrial Ecology program’s Arctic-Boreal Vulnerability Experiment (ABoVE), a large-scale field study in Alaska and western Canada, whose overall goals are to make use of NASA technology to gain a better understanding of ecosystems at high latitudes, their responses to environmental change, and the effects of those changes.
A large proportion of the trees in the boreal forest are conifers, such as spruce trees (images above). These trees keep their green needles all year long. This makes it hard to determine when they start photosynthesizing in the spring, compared to deciduous trees, like oaks, where we can clearly see the growth of new green leaves in the spring.
The timing of the start of the growing season is key to determining the overall productivity of the forest and can be a useful predictor of possible stress events later in the summer. So, one of the goals of our project is to find ways to use light to detect when these evergreens “turn on” photosynthesis in the spring and actively start taking up carbon from the atmosphere.
This brought team members to Fairbanks, Alaska, right in the heart of the boreal forest. We arrived with our instruments in April 2023 to observe the very start of the boreal growing season. Our instruments use different methods to detect the onset and rate of photosynthetic activity in plants. One method we are using to identify photosynthetic activity in the evergreens is based on light that is actually emitted from the trees. Plants absorb light to power photosynthesis, but in the process of photosynthesis some of that light energy is radiated out from the plant; this is called chlorophyll fluorescence. This fluoresced light is very dim, which is why we don’t see plants glowing, but we can use sensitive instruments to measure fluorescence at leaf and canopy scales, which can even be done with instruments on satellites from space.
A second method is to detect very subtle changes in the color of the needles that are related to changes in the pigments in the leaves. Pigments such as chlorophyll, which makes leaves green, and carotenoids, which cause the yellow color of leaves in the fall, control potential rates of photosynthesis as well as provide protection to the leaves when stressed. These color changes are also subtle enough that we don’t see them with our naked eyes, but our instruments can measure and detect these pigment changes.
Instruments that are already on the flux tower measure the transfer of heat, moisture, and carbon dioxide between the atmosphere and the forest (images below).
With the help of Jeb Timm, a NEON tower lead technician, we mounted our FLoX (Fluorescence Box) on the top of the tower. The FLoX looks down on the forest and measures the reflected light and solar induced chlorophyll fluorescence every few minutes continuously through the growing season (images below). FLoX measurements are similar to the data satellites provide, but with far more detail.
From the flux data we can determine photosynthesis rates and compare them with our fluorescence and reflectance measurements for relating the remotely sensed optical measurements to forest productivity. The continuous measurements allow us to examine the effects of varying light levels, moisture, and temperatures on the forest.
Near the flux tower we also put our MONITORING-PAM (MoniPAM) instruments whose probes actively illuminate individual spruce shoots with controlled pulses of light to measure fluorescence and photosynthetic processes at the leaf level (images below).
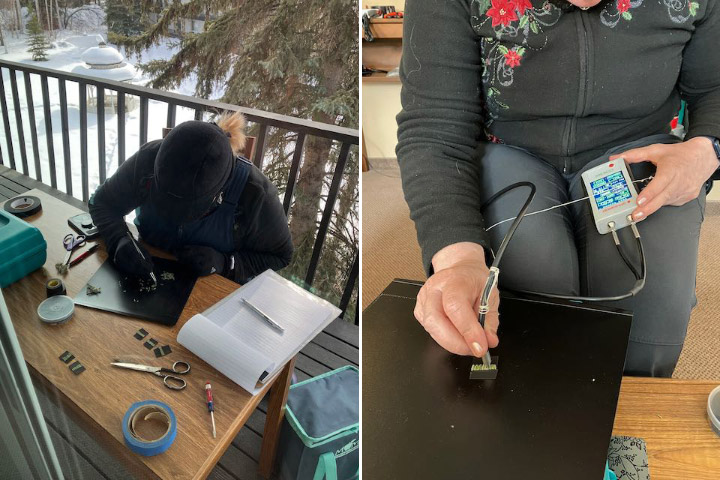
Besides setting up our instruments to catch the start of the growing season, we were hoping to be around when the spruce started to photosynthesize. This would allow us to test if we could detect the onset of photosynthesis through changes in needle reflectance due to changing pigment pools and/or fluorescence measured using a special leaf clip. To get consistent measurements using the same amount of needles, we had to pull off the individual tiny needles then line them up to make a solid mat to measure. And because photosynthesis and fluorescence are temperature sensitive, we had to make our measurements at the temperature the needles experience, so we worked on the deck outside in the cold (images below). The deck looked out on a big white spruce that was full of busy red squirrels who chattered and scolded us while we made our measurements.
Unfortunately, the temperatures mostly stayed below freezing the entire time we were there, so we didn’t get a chance to measure needles as they became photosynthetically active.
While we were there, there was also a NASA funded study of snow called SnowEx. In this part of the SnowEx study, researchers were studying changes in snow characteristics during the thaw period. The SnowEx field team made measurements of the snow on the ground, and NASA flew the Airborne Visible-Infrared Imaging Spectrometer – Next Generation (AVIRIS-NG) imaging system on an airplane, collecting high resolution canopy spectroscopy measurements. We plan to make use of the airplane imagery in our study to see if we can identify changes in tree reflectance (which is noise to the snow scientists) indicating the start of photosynthesis.
We will return in late July to collect measurements during the period of peak summer forest productivity.
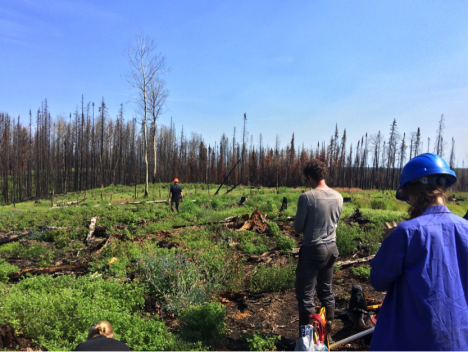
As part of our field work to measure carbon emissions in burned areas, we often have to hike through an obstacle course of fallen trees to reach our research sites. I took some video with a GoPro to give a sense of what this is like, as well as how we extract soil to take measurements and how we find the perfect sites.
Elizabeth Wiggins is a PhD student in the department of Earth System Science at the University of California, Irvine.
In the field, collecting the data is a big job – but our work starts long before we start taking measurements, with the task of finding desired sites within the landscape.
Jocelyne coring a tree to determine the age of the forest (Credit: Sander Veraverbeke)
As our time in Saskatchewan progresses, choosing and finding the right places to collect data becomes progressively more difficult. We are looking for a wide range of forest ages and species composition. This becomes more and more challenging as the time passes, since we now need to find sites with the particular characteristics that we are missing. To find these places, we look at maps that show when and where fires have occurred, and combine this information with maps from logging companies that show location and dates of timber projects.
Every day, we head out to several sites that we identified the night before. We usually drive an hour or so on gravel roads, and hike several hundred meters into the forest. We check for the right species composition at the site, and use a tool called a tree borer to extract a thin cylinder from a nearby tree trunk. From this tree core, we can count the number of rings and determine the approximate age of the forest. If the forest age and species composition meet our expectations, we finally begin our data collection. If not, we return to the car and attempt another location.
It can be challenging when we don’t find what we expected, which can result from inaccuracies in the map layers we use. At times this can be frustrating, but thanks to our team’s stamina, we always eventually manage to find what we need. With only a couple days left in the field, all the gaps in our data will soon be filled.
Jocelyne Laflamme is an undergraduate student in Wildlife Biology and Conservation at the University of Guelph in Canada.
Since our last post, our team has moved an hour south to the small village of Weyakwin, where the Philion fire burned last year. There is a lot of logging Weyakwin, and we are very interested in the interactions between fires and logging. We are comparing burned forests that grew back after people cut trees, to those that grew back after an earlier forest fire.
Sampling a young harvested site that burned last year. It was harvested only a year or two before it burned. (Credit: Solvik)
We believe there could be differences between the two in burn severity and the amount of carbon released by the fire. When a plot is harvested for lumber, the logs are removed but the soil remains. This is the opposite of burned areas, where fire burns into the soils but a lot of the trees remain standing, albeit charred. To study these differences, we are searching for areas of burn and harvest origin that are about the same age. We have seen some very young burned sites, many were less than 10 years old when they burned. This is surprising since forests in boreal regions typically burn when they are 50 to 100 years old. We were shocked to find a burned plot that had been harvested only a year or two earlier. Even without any significant trees or shrubs to carry the flames, the soil was able to sustain the fire.
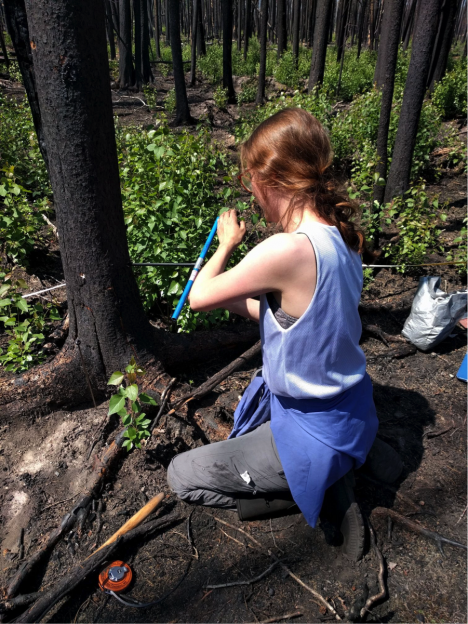
At the sample sites, my job is to help characterize and quantify the aboveground biomass. This includes trees, shrubs, and dead trees that have fallen over, called “coarse woody debris.” I work with Brendan Rogers, our team leader, to measure every tree within a 2-by-30 meter sampling area. We identify the tree species, rate the amount of the canopy consumption, and measure the diameter. We will use these numbers to estimate how much carbon was released when that tree burned. Most of these tasks are fairly straightforward — although it can sometimes be tricky to differentiate between similar tree species after they have burned. We can measure individual trees pretty quickly, but it can still take one or even two hours to work through an entire site. At one site, we counted over 350 trees, measuring the diameter and estimating the canopy consumption for each and every one!
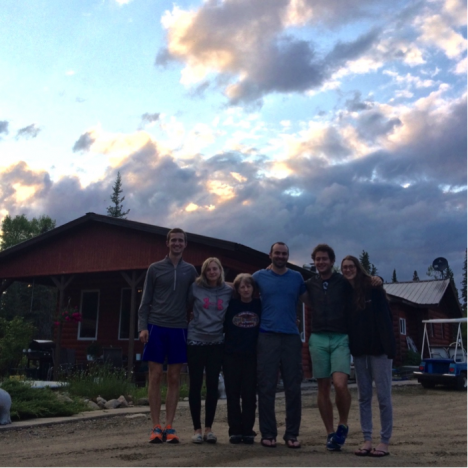
Our team and Rita. From left to right: Kylen Solvik, Liz Wiggins, Rita, Brendan Rogers, Sander Veraverbeke, and Jocelyne Laflamme. Missing: Catherine Dieleman, who had to fly home early for a friend’s wedding. (Credit: Solvik)
In Weyakwin, we are staying at a small bed & breakfast. Our host, a wonderful lady named Rita, takes great care of us. She cooks us breakfast and dinner, and she even packs us brown bag lunches for us to grab on our way out. After going out for dinner every night at our previous lodging in La Ronge, it has been a great change of pace eating home-cooked meals. We will be staying with Rita for the next week, and then we will be returning to Saskatoon to fly back to our respective homes. One of our team members, Catherine Dieleman, left early for her friend’s wedding. We will miss her and her soil expertise dearly.
But there are a lot more sites to sample before we are done!
Kylen Solvik is a research assistant at Woods Hole Research Center in Falmouth, Massachusetts.
