By Eric Lindstrom
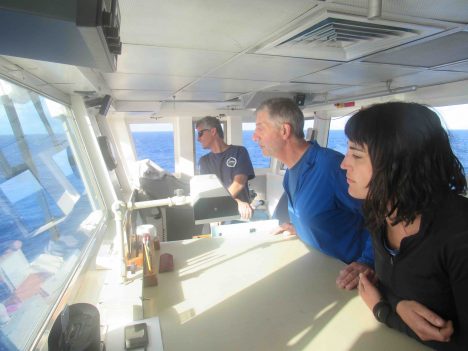
A longstanding technical challenge for oceanography has been how to measure the sea surface – temperature, salinity, gas exchange, or surfactants – to name a few examples. Obviously enough, the surface is where the ocean and atmosphere interact and exchange heat, freshwater, gases, momentum, and particles of all kinds. So, how do we measure the properties and exchanges right at the surface? If we are on a ship or any floating platform, the platform disturbs the surface. From satellites we can measure many properties of the surface but only on very broad scales. The R/V Revelle, right now, is the ship showing how modern science is meeting the challenge. Let me tell you about some key elements.
Julian Schanze from Earth and Space Research in Seattle and Jim Edson from University of Connecticut have brought two instruments aboard with innovative ways to measure the temperature and salinity at the surface – the Sea Snake for temperature (Edson) and the Surface Salinity Snake (Shanze) for, obviously, surface salinity. The former places a temperature sensor at the end of flexible hose that is hung outboard from the bow of the ship (near the wake), to continuously measure temperature. The Salinity Snake, outboard of the wake passes water through a vortex de-bubbler and thermosalinograph to obtain an estimate of salinity within inches of the ocean surface. It is an awesome “contraption” (with no offense to Julian).
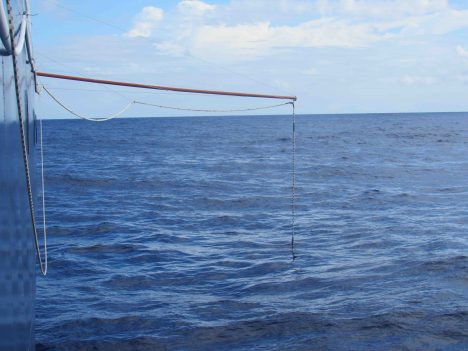
The Salinity Snake being deployed over the starboard side.
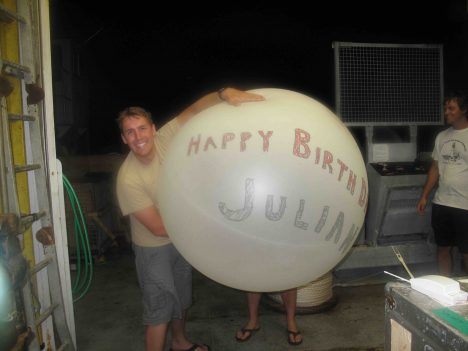
Julian Schanze’s birthday balloon.
Today is Julian’s birthday so all the Salinity Snake gear has been draped with colorful paper snakes carrying birthday greetings. Julian participated in SPURS-1 in 2012 and has since received his PhD and is making a name for himself by tackling surface salinity science from gadget to satellite and from seawater intake to space. It is wonderful to have someone so capable on the NASA Ocean Salinity Science Team!
Andy Jessup, our chief scientist from University of Washington Applied Physics Laboratory and Michael Reynolds from Remote Measurements and Research Co. in Seattle have brought a dazzling array of instruments for measuring and probing the skin temperature of the ocean. The surface of the ocean is known to have a cool skin at the molecular level. Photos of the sea surface with infrared cameras reveal complex and interesting patterns as a result of mixing, wave breaking, surfactant conditions, and wind. NASA has always had a deep interest in skin temperature because satellites do measure this skin temperature while every probe you stick in the ocean measures something deeper and different than skin temperature. From the Revelle, Andy and Michael are using several infrared radiometers and cameras to measure and depict the sea surface skin temperature. There is one on a boom to measure outboard of the ship wake, one mounted on the rail to look outward from the ship and another on a balloon to take infrared photos of the skin from 300 feet above the ship (the Lighter-Than-Air InfraRed System – LTAIRS.)
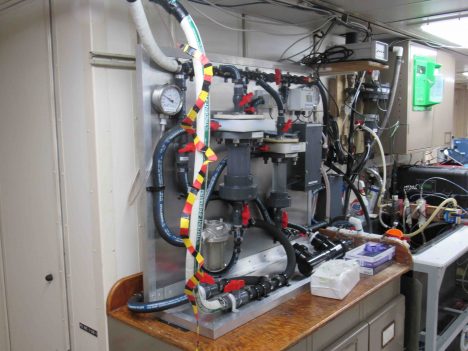
The laboratory end of the Salinity Snake and Carbon Dioxide analysis.
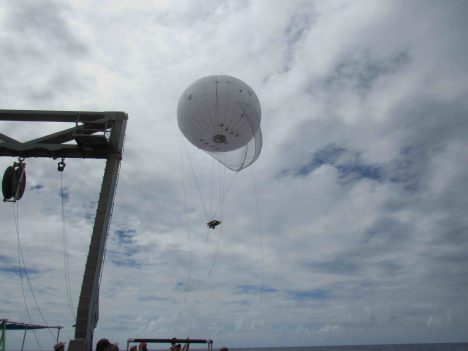
LTAIRS ascends toward 300 feet.
Eric Chan, from University of Hawaii, is aboard measuring making a suite of carbon dioxide, pH, and Dissolved Inorganic Carbon measurements for principal investigator David Ho. They study the exchange of carbon dioxide across the air-sea interface and they’re particularly interested in how rainwater on the surface of the ocean impacts the gas exchanges.
The array of instrumentation aboard Revelle is quite astonishing and the technical innovations displayed in measuring the sea surface are truly remarkable. And I haven’t even mentioned the Surface Salinity Profiler yet in this blog post. I have been teasing you with that since the start of the voyage and I PROMISE to give it a blog entry all to itself!
Today is also the birthday of the R/V Revelle Captain, Christopher Curl. I am sure I speak on behalf of the entire SPURS-2 science party when I offer him a hearty “HAPPY BIRTHDAY!” and say how pleased we are with the entire ship and crew of R/V Revelle. I guess that sharing the ship with a group of rare ocean-skin specialists with sea snakes is not how he imagined this birthday, but he is quick with a smile and will roll with our skinny offerings!
By Eric Lindstrom
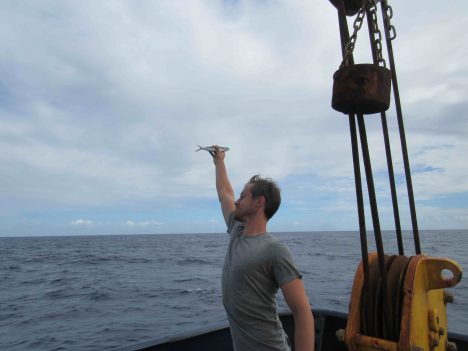
Sam Levang from WHOI catches a flying fish in flight.
I figured I would go off topic today and discuss a disturbing observation by someone who has spent more than half a lifetime going to sea. This is my personal opinion and does not reflect any policy or perspective of NASA. However, those of you on land really need to know that humans have had an enormous impact on the large life forms in the ocean. Sure, you probably know about how we took whales to the brink of extinction, but what about the fish on your dinner table. Do you really know how much is left in the sea?
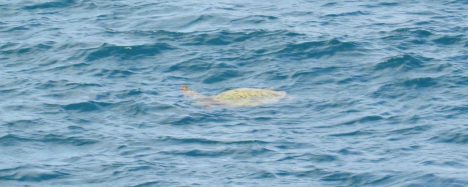
A sea turtle near Honolulu.
First, to minimize stating a bunch of boring facts and figures, I give you some brief but informative links below to research for yourself. This blog post is more of an emotional statement of alarm from my personal experience than that of a fisheries biologist or an expert on marine biota of any kind.
I became an observer of marine life from a very young age. I was raised in Seal Beach, California in the 1950’s when sea lions still roamed the beach. They have long departed. Most of my oceanographic life was spent in the tropical Pacific Ocean from late 1970s to present. My experience tells me has been an enormous change in the frequency of sightings of marine organisms from shipboard during those years. In the 1970s and 1980s it was a daily occurrence to see sharks, tuna, squid, and birds. Now, in the 21st century, we are lucky to see ANY of the former and few birds. Flying fish are still around but disturbingly little else swims by the ship during shipboard work in recent years. To put this in land-loving terms it feels like a rainforest filled with life is replaced by a desert of bleak lifeless sand. Sadly, this trend has been clear to me for decades and is substantiated in many ways by scientific studies. I particularly note that my personal observations coincide in time with the dramatic increase in tropical fisheries from the 1980s. Rapid depletion of large and visible marine organisms at the top of the food chain has been well-documented. A good book on this subject is “An Unnatural History of the Sea” By Callum Roberts.
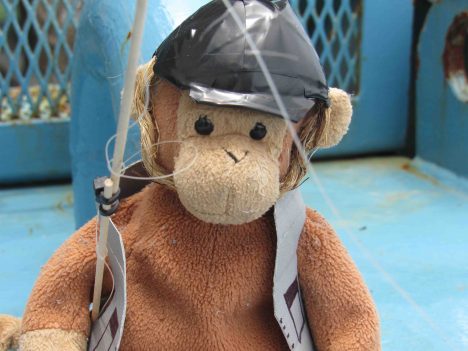
Monkey geared up for fishing.
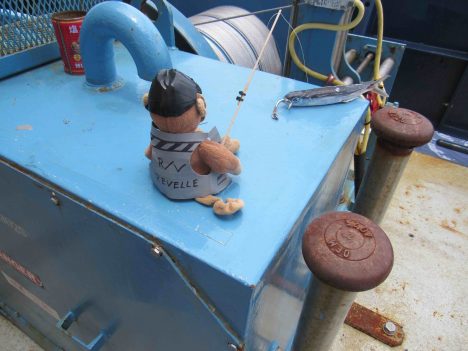
Monkey actually caught a fish!
Another aspect of the alarming trends in the ocean over recent decades is the growing abundance of marine debris, particularly plastics in the far reaches of the open ocean. I will devote a future blog to this subject (as I did during SPURS-1)
I do not wish to leave you with only a picture of doom and gloom. We should all pitch in to alleviate pressure on ocean ecosystems. The National Oceanic and Atmospheric Administration has created Fish Watch to help guide concerned consumers to sustainable seafood choices. I urge all who follow my blog to become concerned consumers! Also, any lessons from your past about the limitless abundance of the ocean should certainly be buried and replaced by thoughts about care and stewardship of precious and limited marine resources.
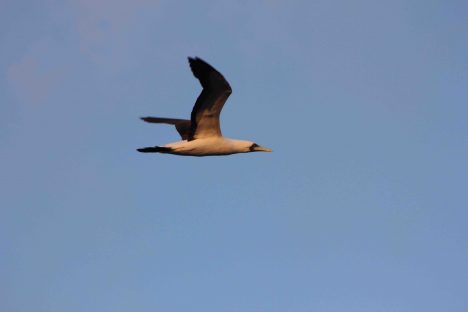
Masked booby.
References:
Overfishing (Wikipedia).
By Eric Lindstrom
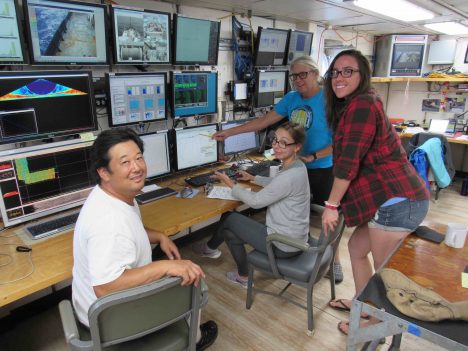
The CTD team (Spencer, Leah, Janet, and Kristin).
The focus of SPURS-2 is the upper ocean and the fate of rainwater. However, in order to study the top of the ocean one needs to know what is going on deeper down. The beauty of SPURS-2 is not skin-deep! SPURS-2, like many prior physical oceanography experiments, requires a basic background and context of the ocean circulation environment upon which many of our other more specialized or detailed measurements can be interpreted. The two major pieces of the contextual information for us are the surface circulation and the surface salinity pattern.
The surface salinity pattern is provided by remote sensing for the largest scale and by the array of drifters and profiling floats that have been deployed with salinity sensors. Also, the R/V Revelle is collecting a treasure trove of upper ocean salinity measurements wherever she goes – with continuous underway measurements of salinity from intakes at the surface, 2 meters (6.5 feet), 3 meters (9.8 feet), and 5 meters (16.4 feet) depths. I’ll go into that in more detail in a later blog on the Surface Salinity Profiler.
The surface circulation of the ocean is largely the result of the wind and the shape of the massive deep layers below the surface. In fact it can be crudely estimated if one knows the precise shape of the thermocline – the boundary between the warm upper ocean and the vast deep cold ocean. Here in the tropics the thermocline is pretty well represented by the 20°C (68° F) isotherm. Think of the warm upper ocean as all the water warmer than 20°C and the layer below as all the water colder than 20°C. Tropical oceanographers can use the depth of the 20°C isotherm much like meteorologists use surface atmospheric pressure maps to chart the highs and lows of weather and their associated winds. Here, if the 20°C isotherm rises toward the surface locally it is associated with a counterclockwise ocean surface current. The signature of the westward North Equatorial Current is a gentle slope of the isotherm from deeper in the north to shallower in the south. This is where our Conductivity-Temperature-Depth (CTD) instrument comes into the SPURS-2 plan. We can use it to track the shape of the thermocline. I wrote about the CTD during the SPURS-1 campaign. It is still the workhorse of physical oceanography – or maybe the monkey on the back of every physical oceanographer! Our show seldom goes on without it.
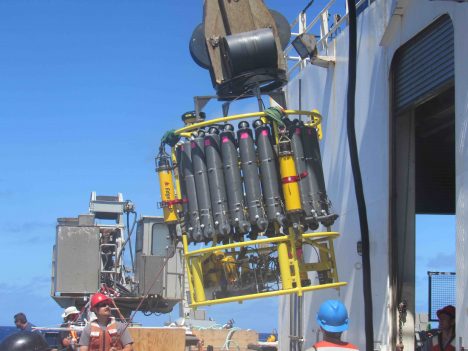
Preparing the CTD to go over the side.
Janet Sprintall from Scripps Institution of Oceanography and her team (Spencer Kawamoto, Leah Trafford, and Kristin Fitzmorris) are now mapping the temperature and salinity structure of the ocean well into the deep cold abyss (to 1.5 kilometers –0.93 miles– below the surface). The ocean depth is about 4.5 kilometers (2.8 miles) and the lower 3 kilometers (1.86 miles) are (for our purposes) relatively uniform and cold. Janet has planned a grid of 49 stations 30 miles apart around the SPURS-2 central mooring. These will be completed over about a week’s time. Simultaneously there will be regular sampling with the Surface Salinity Profiler between some of the CTD stations and we will optimize our meteorological measurements by limiting our speed to 10 knots (11.5 mph). So, while studies of the meteorology and near surface salinity are ongoing, as we move about the ocean, Revelle stops for an hour every 30 miles to collect necessary information on the background oceanographic conditions.
The CTD instrumentation remains largely unchanged (although perfected) in recent decades. Temperature, salinity, and oxygen sensors are mounted on the bottom of a large frame. Water sample bottles are mounted around the outside of the frame. Other instruments, such at the acoustic Doppler current profiler, may also be mounted on the frame. All data is transmitted up the conducting wire cable that is used to raise and lower the instrument. This bulky package is now easier to deploy and recover than in yesteryear due to innovations on today’s vessels. Now the Revelle has a specialized mechanical arm to get the CTD over the side and back on deck safely without much human intervention.
Monkey climbing over the water sample bottles on the CTD.
For my entire career oceanography has been spelled “CTD.” Knowing the temperature and salinity structure from surface to ocean depths is the key to our understanding of the ocean’s role in climate. The first global mapping of these characteristics (with CTDs) was not realized until the World Ocean Circulation Experiment in the 1990’s. Now oceanographers are working hard to understand all the physical, chemical, and biological changes associated with global warming, rising carbon dioxide levels, and industrial fishing. In that big picture, SPURS-2 might look like a small bit of monkey business over the tropical thermocline. However, we know that the resulting scientific understanding will long outlive the memory of our tiny field program in this vast Pacific Ocean!
By Eric Lindstrom
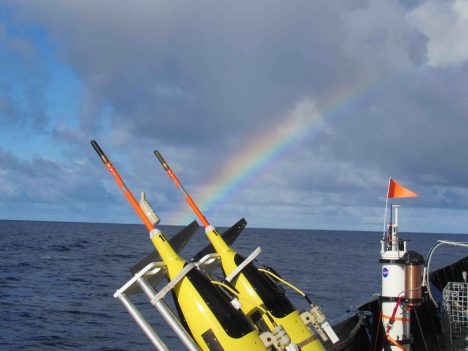
Instruments ready for Lagrangian array deployment at the end of the rainbow.
What do Leonhard Euler (1707-1783) and Joseph-Louis Lagrange (1736-1813) have to do with SPURS-2? How do we have two experiments going on simultaneously honoring the work of these famous mathematicians?
Two frames of reference have taken their names from these 18th century mathematicians. In science, including oceanography, when we make measurements of fluid flows fixed in space, we watch properties such as temperature or salinity as currents carry them by our instruments. This is called an Eulerian frame of reference. However, sometimes we make measurements while following the flow, trying to tag a parcel of water and watch as it moves and changes over time. This water following perspective is called the Lagrangian frame of reference. For example if you watch a river flow past from the bank, you are using an Eulerian frame of reference. If you examine the river from a boat flowing with river, you would be making a Lagrangian observation of the river.
In SPURS-2 we use moorings and a fixed grid of stations to describe a patch of ocean as the water passes by. Moorings, stations, and satellites provide the Eulerian perspective over the year of SPURS-2. We use a variety of drifters, autonomous vehicles, and profilers (instruments embedded in the moving water parcels) to also build an extensive Lagrangian view of the ocean over the year. We use the Lady Amber over the course of the year to service and reset some of the Lagrangian experiment as those assets drift away from the study site. We use the Revelle to deploy the Eulerian array and to seed the ocean with the Lagrangian instruments to be tended at later times by Lady Amber. It really is two experiments united to understand the salinity patterns and movement of freshwater in the ocean!
Audrey Hasson driving the A-frame during mooring deployment.
During the Revelle voyage we are also planning a short-term (48-72 hour) Lagrangian experiment capture the processes by which rainwater mixes into the ocean. We will launch drifters specially designed to follow the surface current during a rain event and then follow them for day or two. We will sample the region around the drifters using the Revelle to further examine the changing temperature and salinity properties of the upper ocean. The Revelle will attempt to take several snapshots of the ocean conditions as the Lagrangian array disperses over a day.
Together our Lagrangian and Eulerian sensor arrays constitute a sensor web in the ocean. This sensor web captures ocean motion and salinity changes (particularly) on a wide range of time and space scales. This allows us to analyze processes that lead to changing surface salinity all the way from minutes to seasons and from millimeter size turbulence to major ocean currents. We cannot measure all things we would like all the time and in every place, so we have tuned our effort and sensor web design to provide enough information to estimate what we would like to know. We would like to know about the role of turbulent mixing at the surface; we would like to know the role of eddies in transport of freshwater; and we would like to know how the major equatorial currents impact the eastern tropical Pacific low salinity pool. Obtaining such knowledge of the ocean is ambitious and challenging. SPURS-2 is giving us a shot at providing some unprecedented new knowledge.
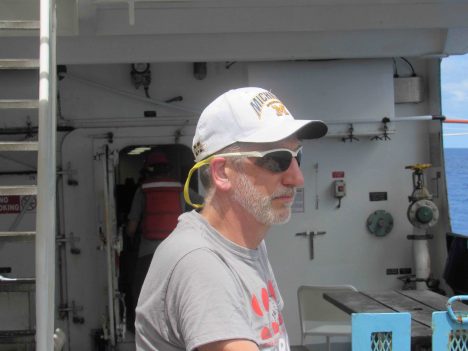
Andy Jessup, Chief Scientist on SPURS-2 R/V Revelle.
I would like to give a shout out to our chief scientist on the voyage, Andy Jessup, from the University of Washington Applied Physics Laboratory. Andy has demonstrated extreme patience and diligence to his duty to represent the many investigators working on diverse problems and scales in SPURS-2. He has a team from APL aboard with a complex set of measurements to execute. He balances the time devoted to his own science project and his duties as leader of all the projects represented on the ship. That is not easy and he has found a way to give everyone a voice.
I hope to devote some upcoming blog time to our able CTD crew from Scripps led by Janet Sprintall, the ocean currents in our region in general, and the interaction with the teams back home as seen through the eyes of Audrey Hasson.
Please feel free to send questions and comments on the blog. I’ll do my best to answer all fair questions!
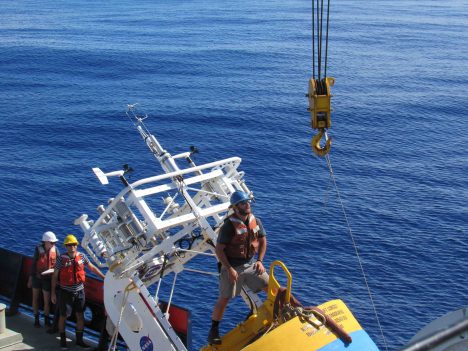
Ben Pietro readies a buoy for deployment.
For SPURS-2 we are installing three moorings that will stay in place for over a year. Our moorings are arrays of instruments dangling from a surface floatation and anchored at the bottom. The moorings eventually will be recovered by R/V Thompson in September or October 2017. They will be recovered by using a release mechanism (acoustically operated) above the anchor.
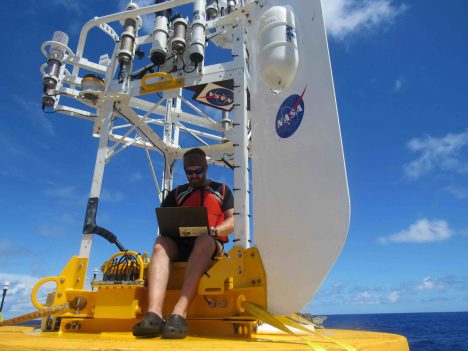
Emerson Hasbrouck, working in his office.
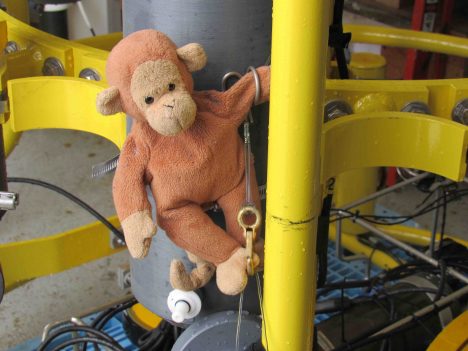
Two of the moorings are supplied by William Kessler at the NOAA Pacific Marine Envionmental Laboratory. They will use the Prawler (profiler + crawler) technology – an instrument system that crawls up and down the mooring wire to sample the upper ocean on a regular basis. This technology has been perfected since SPURS-1. Andrew Meyer and is buddy Monkey are working the deployment of those moorings.
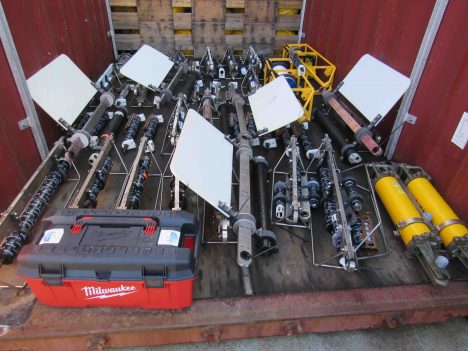
Two instruments, ready for the WHOI mooring.
The SPURS-2 Central Mooring is supplied by Tom Farrar from Woods Hole Oceanographic Institution under a grant from NASA. This mooring is heavily instrumented with temperature, salinity, and current sensors as well as a sophisticated meteorological package at the surface. This gear is the hub around which the rest of the experiment works. It provides the contextual environmental data over then entire year in which other shorter term more intensive measurement campaigns by R/Vs Revelle, Thompson, and Lady Amber will fit.
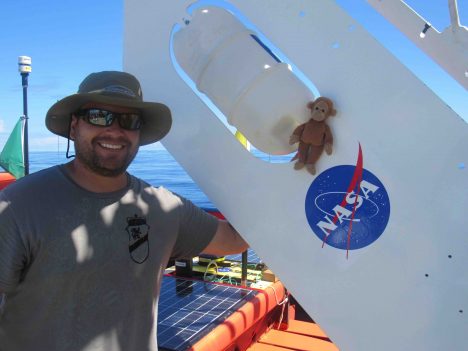
Andrew Meyer and Monkey pose with the SPURS-2 Central Mooring buoy.
Each mooring effectively takes one day of ship time to deploy, since daylight and a morning start is preferred. Each deployment starts with the surface buoy and continues with instruments and line/cable until the release and anchor remain on deck with about 3 miles of mooring strung out behind the ship. If all planning and estimating is correct, the ship will be appropriately positioned with regard to the target site so that the anchor can then be dropped. The ocean bottom – 3 miles down – is relatively flat here at SPURS-2 so precise aiming of the anchor drop zone is not necessary.
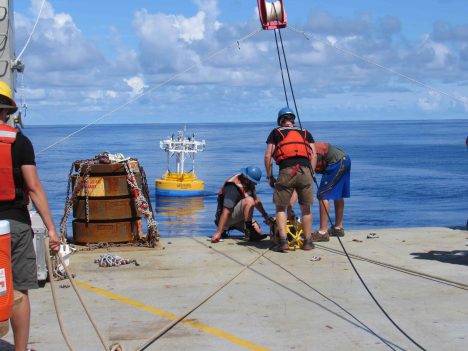
WHOI mooring with anchor.
Deployment of the central mooring in particular is labor intensive and many in the science party contributed to the effort. he deployment effort was orchestrated by Ben Pietro and Emerson Hasbrouck from the mooring group at Woods Hole. Drew Cole and Carmen Greto provided essential expertise as ship’s scientific technical support. Ben and Drew together lead the team through a solid 10 hours of work. Leah Trafford monitored and logged all the equipment as it was deployed. She was ever present with the clipboard and eyes on the instruments. Raymond Graham had a terrific day serving as Ben’s extra pair of hands, handling all manner of assignments with great dexterity.
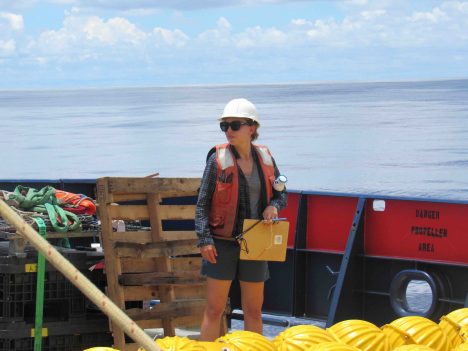
Leah Trafford with the mooring log.
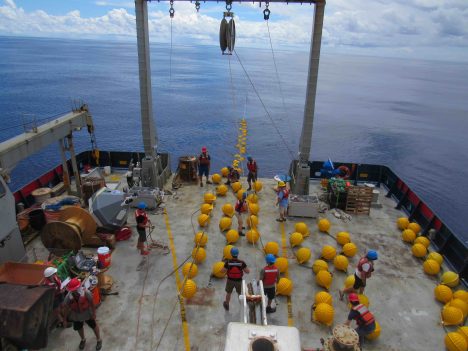
Mooring action on the fantail.
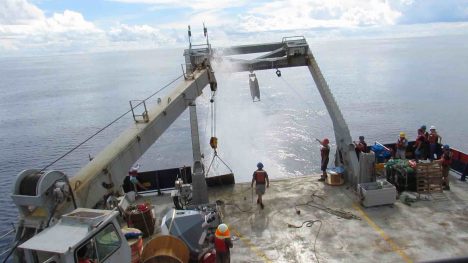
Anchor away for the SPURS-2 Central Mooring.
We’ll spend a full day post-deployment with a variety of projects related to the central mooring. We’ll complete a survey of the site to determine the precise location of the anchor (and acoustic release mechanism). We’ll check meteorological equipment against shipboard measurements. We’ll use a small boat operation to the surface buoy to add additional equipment that could not be launched during the primary operation.
After the second PMEL mooring is deployed, Revelle will be moving to begin mapping of the ocean around the central mooring. A box of approximately 180 miles on a side will be the focus of our sampling for more than a week. There is also a deployment of free-floating sensors. I’ll tell you more in the next post about how we sample the ocean with sensors fixed in space versus those fixed to a water parcel.
Meanwhile, we are enjoying our first serious rainstorm of the voyage at our study location. We hope for many more. If we are going to study how the rainfall mixes into the ocean, we really are hailing the rain dowsers to bring more showers!
Stay dry out there folks, but hope that we get soaked!
