
By Eric Lindstrom
How do you spell physical oceanography? I know my answer for that question! It’s easy: CTD.
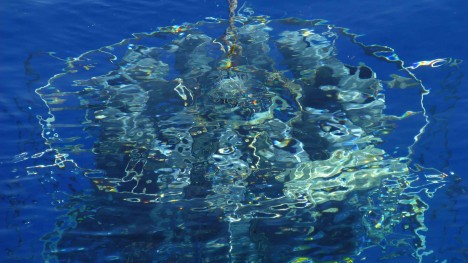
CTD art in the blue Sargasso Sea.
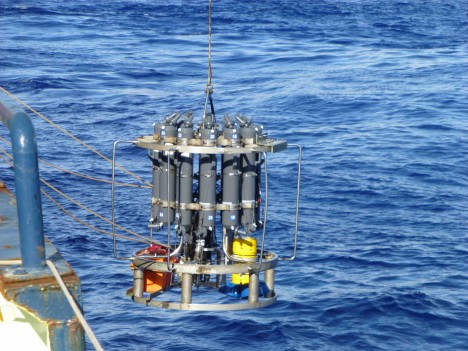
CTD into the water.
For about the last 40 years, the mainstay of physical oceanography has been profiling the ocean with sensors for Conductivity, Temperature, and Depth (CTD). The SPURS cruise is no exception. These are key properties to derive salinity and the physical state of the seawater is described through the “Equation of State” which depends on temperature, salinity and depth.
During SPURS, we are doing CTD stations from four to six times per day (to around 3,300 feet depth) and using an underway CTD as frequently as every 15 minutes (to about 1,300 ft). Computers aboard transform the raw sensor data into temperature, salinity, and depth information at regular levels (say every 3 feet) depending on the need. From there, it is relatively easy to use the equation of state to derive density and to estimate the geostrophic currents between the various CTD casts. Those are the currents caused by pressure variations resulting from the spatial density differences (like the winds between high and low pressure systems in the atmosphere). So CTD helps us unlock a major piece of ocean circulation, right there.
The CTD is the basic instrument embedded in most of our platforms – on gliders, moorings, autonomous vehicles, and our Knorr thermosalinograph. All use similar sensors in slightly different configurations. All the incoming data is converted to temperature and salinity data spread through space and time. Different CTDs on different platforms are specialized to measure different time and space scales of the temperature and salinity fields. So, some CTDs measure the microstructure at inches and smaller, and some better measure the variations over the full ocean depth. Some work best while moving rapidly through the water, while others are specialized for stationary measurements. Any way you cut it, you still spell physical oceanography with a CTD.
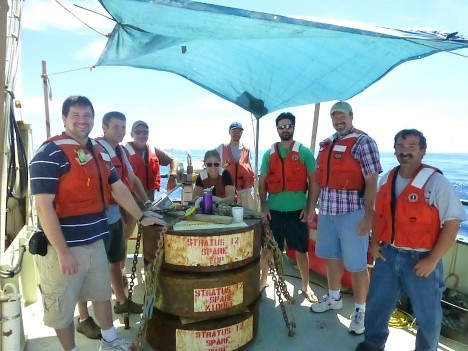
The underway CTD team.
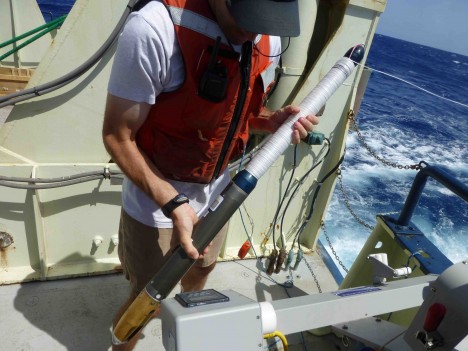
Underway CTD unit clips to tip with 1,300 ft (400 m) of line.
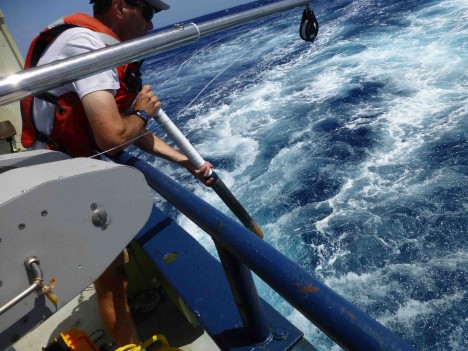
Dropping the underway CTD over the stern.
Over the course of one SPURS expedition the number of CTD stations may number in the hundreds. And since we launch the underway CTD as often as possible as we go between stations, as many as a thousand underway CTD profiles are collected over a month at sea. The usual arrangement for CTD profiles is to mount the instrument inside a metal frame and pairing it with a rosette. On the rosette, one can mount Niskin bottles (http://en.wikipedia.org/wiki/Nansen_bottle ) for collecting water samples. The Niskin bottles are cocked open before the CTD cast and are tripped in sequence. Samples are then extracted on deck for calibration of salinity (or any other purposes).
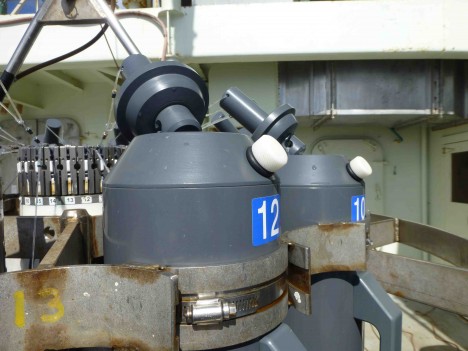
A top view of an open Niskin bottle.
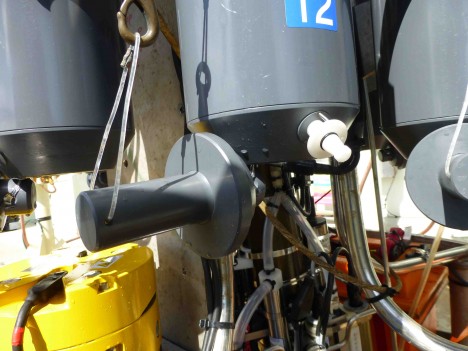
A bottom view of an open Niskin bottle.
All in all, the CTD is THE instrument of SPURS and the mainstay of physical oceanography since the 1970s. It was used to map the properties of the global ocean in the World Ocean Circulation Experiment in the 1990’s. In SPURS it will provide us with an unprecedented view of the salinity variations here in the highest salinity region of the Atlantic Ocean.
Tags: conductivity, NASA, oceanography, salinity, SPURS, SPURS1