
By Eric Lindstrom
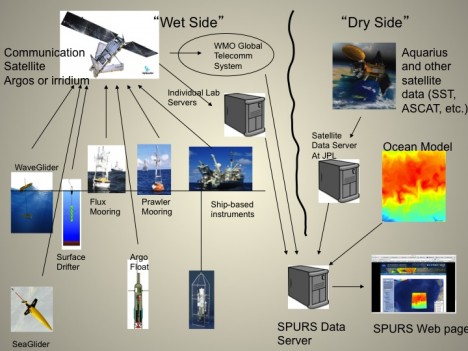
A high-level concept for SPURS data flow whereby data collected by the many devices will be relayed via satellite to shore and integrated with numerical ocean models and satellite observations.
The complex job of managing the data from SPURS is daunting because of the number of different platforms and data streams that need to be logged and cross-calibrated. Overall, by NASA standards, we are dealing with relatively small quantities of data (Gigabytes) but there are many,many different sensors and platforms involved. The value of the SPURS dataset comes from analyzing together the measurements made by all the different instruments at a variety of time and space scales. Such an analysis would not be credible without detailed comparison and calibration between all the instruments. SPURS interpretation is dependent on all the salinity measurements being comparable to one another and that one ocean salinity field is derived from the variety of measurements. Let me go into a little more detail on these points (forgive me for getting nerdy about this, but its important to the expedition, so I gotta tell you!)
To give you an example of the range of platforms and instruments measuring salinity in SPURS, consider that we are trying to measure surface salinity from space using Aquarius, surface drifters, Argo floats, Wavegliders, Seagliders, thermosalinographs on ships, moored salinity sensors, underway and station CTD, and bucket samples (it’s just what it sounds like!). NASA data systems are not generally working the entire buckets-to-satellites range of seawater analysis, so we are learning as we go — and doing just fine so far!
Salinity is a difficult variable to measure properly. It is determined by measuring the ability of seawater to conduct electricity. Though this sounds simple in principle, in practice, the measurement of salinity requires exacting standards of quality. The relevant variations in SPURS are one part in ten thousand (for comparison, a pinch of salt in a gallon of water changes its salinity by about 2 parts in ten thousand). Our instruments can measure salinity differences down to a few parts in a million.
The ocean salinity standard by which all of our ocean salinity measurements are compared is created by using a laboratory salinometer and a standard for seawater salinity, the “IAPSO Standard Seawater”. Operating the salinometer is a critical but tedious job, taking place daily in a temperature-controlled room just off the Knorr’s main laboratory. We collect dozens of water samples every day, all of which need to be examined by the salinometer with exacting adherence to procedures and recording of results. The salinometer is calibrated for each batch using the standard seawater with known salinity of exactly 35 parts per thousand.
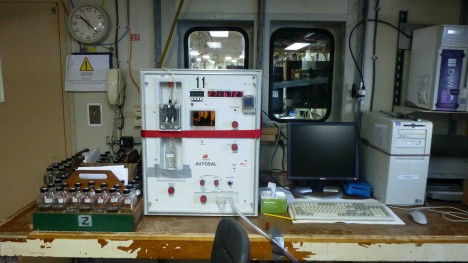
The salinometer on Knorr.
Bottles of seawater collected during CTD profiles and from the ship’s thermosalinograph system are analyzed on a regular basis and compared with the Standard Seawater. The fully-calibrated measurements from the CTD and the ship’s underway system are then used to standardize all of the other instruments being operated in SPURS (by comparison of nearby simultaneous observations).
A SPURS project led by Prof. Frederick Bingham of University of North Carolina Wilmington and Yi Chao at Remote Sensing Solutions in California has been focused in part on cross-calibration of the different data streams. Fred and student Andrew Whitley are on the Knorr from UNCW.
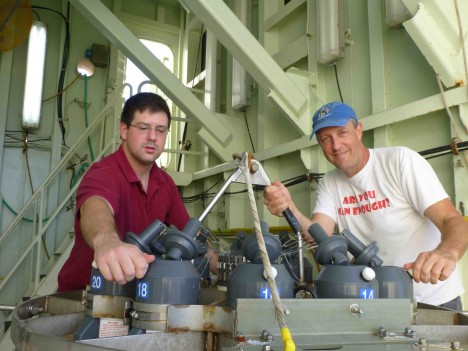
Fred and Andrew at work.
Fred is an observational physical oceanographer who has worked with many different kinds of oceanographic data over the years, including CTD, drifter, mooring, velocity, float and satellite data. In addition to his PhD in Oceanography, he has a Masters degree in computer science and information systems. This helps him manage and understand the sometimes complicated and confusing data structures the different oceanographic instruments produce.
Andrew Whitley is a graduate student at UNCW in Physical Oceanography studying large-scale coastline modeling. He has undergraduate degrees from UNC Chapel Hill (in music) and UNCW (in physics). Andrew is a first-timer to long oceanographic expeditions. He told me “I’ve always been fascinated with shipboard operations and research, but being a student of modeling rather than observing the ocean, I had not had opportunities to get aboard a research vessel. Thankfully, Dr. Bingham heard about my desire to go to sea, and I am very grateful that he asked me to come along. This has truly been one of the most extraordinary experiences of my life!”
I think he might have nightmares about seawater sampling for years to come! At sea, Andrew is also helping Fred with his data processing efforts. Andrew works up daily reports and plots on sea surface temperature and height, and drifter positions. He is processing daily CTD data for general shipboard use. Like many first-timers Andrew is soaking in the experience. It seems like no matter the hours or the watch to stand, he is loving every minute!
Another one of Fred’s duties on Knorr is to add to our “situational awareness” of ocean conditions and our sensor web. The SPURS instrument array is complex and constantly evolving in time as instruments drift or maneuver through the water. Satellites overhead provide information about sea surface salinity, temperature, currents, winds and weather. Onshore models make forecasts of ocean conditions 24-48 hours ahead. Much of this real-time data flow is unique to SPURS. In the new world of real-time oceanography, the ship can be directed to features of interest, instruments can be deployed based on analysis of satellite data or autonomous vehicles directed to travel to where they are needed away from the ship. Fred’s job is to keep the chief scientist aware of what observing assets are where and what the status of the array is.
In his every day work on board, Fred keeps a constant watch on the ship’s position and the positions of all of the other assets in the water. (An example of the type of display he uses can be seen on this website — click on “SPURS Data” and then on “Visualization”). When the need arises, he downloads and plots satellite imagery. He extracts data from the different data streams that are updating regularly and analyses them. It requires daily interaction with the modeling team at NASA’s Jet Propulsion Laboratory. All of the scientific team aboard Knorr use the daily updates on the environment and observing system provided by the UNCW team. It is an essential element for SPURS success!
Tags: data management, NASA, salinity, SPURS, SPURS1
I am new to SPURS research, and am curious as to the salinity levels in the Gulf of Mexico if they have been recently mapped. In particular, post BP oil disaster, and the effects it has and continues to have on the pertinent sealife such as oysters and other stationary bivalves, crustaceans and the like. If you could direct me to current data analysis, historical analysis, if any, and any trend in data flow I’d be most appreciative.
Janel,
Thanks for your query. I would suggest looking up the Gulf Research Initiative, which I understand is funded out of oil spill settlement funds. I don’t know that much about the Gulf myself as it is not my area of specialization.
http://gulfresearchinitiative.org/
Fred Bingham
Hey Dr. Linstrom,
Just curious, is the PH of the sample checked before tested for conductivity? (Just that with all the concerns over acid rain, CO2 (carbonic acidification or calcium reduction) that these processes could affect free ionic content as well, causing a bit of a corrundum…)
Good question!
The conductivity of seawater is quite insensitive to the small changes in the hydrogen ion concentration indicated by the Ph (acidity). The measure of salinity via conductivity is dependent on those ions that are present in large concentrations – sodium and chlorine ions are account for more then 90% of the ions (magnesium 5% and sulfate 2.5% and so on). So even though the hydrogen ion has a high relative conductivity, its imbalances make a relatively small contribution to the overall conductivity of a seawater sample because of its smaller abundance. The same goes for variations of other ions present in small concentrations like phosphate or calcium. The salt (NaCl) in seawater dominates the measurement of salinity via conductivity.