
The airplanes went home in December. The radars pulled out in January. So what is going on with OLYMPEX in February and March? In our past blogs we stressed how during OLYMPEX we measured the structure of precipitation as winter cyclones passed from the Pacific Ocean across the Olympic Peninsula and the Olympic Mountains. And most of our focus was on measuring rain. But OLYMPEX is also tasked to measure snow, both the structure of falling snow crystals and the building of the snowpack throughout the entire winter season. Snow is one of the most difficult things to measure – both from space and on the ground. In this blog post I will highlight how it takes Olympic efforts to measure snow during this extended field phase of OLYMPEX.
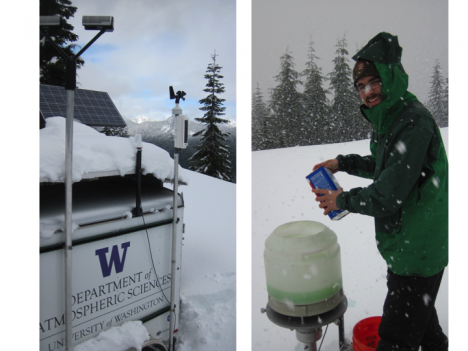
Some of the key quantities that we need to measure are the snow characteristics, i.e. the shapes, sizes and water content of falling snowflakes. In order to do that, instruments that measure these characteristics needed to be placed at elevations that frequently experience snow. The best location we found is on the north side of the Olympic Mountains at Hurricane Ridge within the Olympic National Park. We installed a Micro Rain Radar (MRR), a Parsivel Disdrometer and a Precipitation Imaging Package (PIP) which are shown below. The PIP works especially well in this environment as it can accurately collect data in strong winds, such as the 80mph winds that frequently accompany the winter storms as they assault the aptly named Hurricane Ridge.
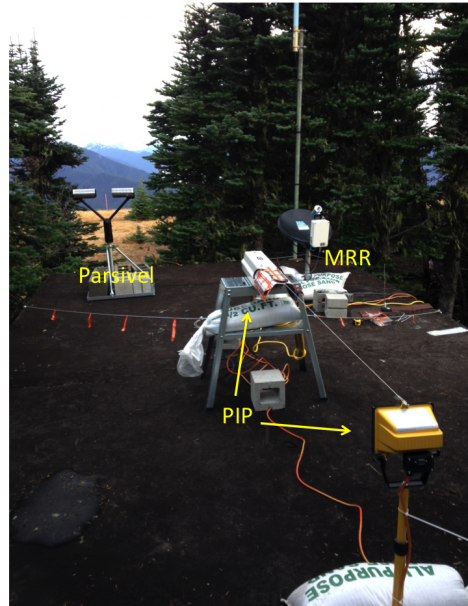
These instruments measure the characteristics of falling rain and snow. They include a Parsivel Disdrometer, and Micro Rain Radar (MRR) and a Precipitation Imaging Package (PIP). The MRR is a upwarding looking radar that measures fall velocity of rain and snow. The PIP is a high speed camera that takes pictures of the falling precipitation. Photo by Matt Wingo.
However, none of the instruments could quite handle the major snow dump we experienced in late December! Snow continues to accumulate and right now there is approximately 240 cm, or close to 8 feet of snow on the ground at Hurricane Ridge (luckily not covering our instruments!).
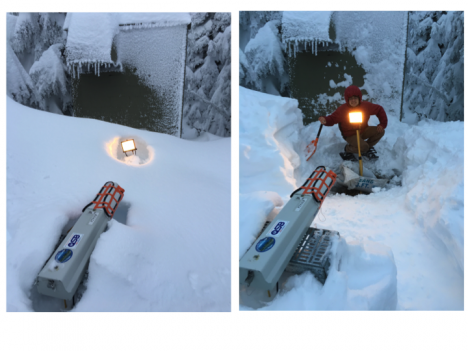
It’s hard to make measurements when your instruments are buried by 5 feet of snow. Thank you CJ Uhrnes of the Olympic National Park for digging out the PIP last January. Photo by Joe Zagrodnik.
Another way we are measuring snow and rain is with an instrumented trailer. The trailer is parked for the winter just outside the National Park at location at 3000’ elevation, where both rain and snow can fall any time throughout the winter.
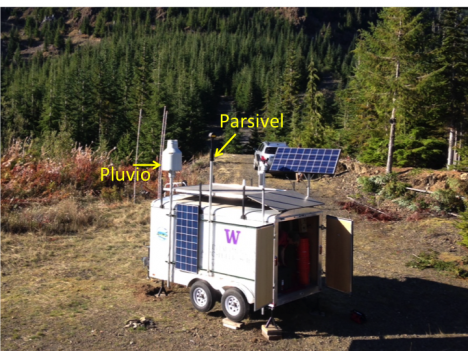
Instrumented trailer installed on the southern side of the Olympic Mountains. The Pluvio and Parsivel are mounted high on the trailer to keep them above the accumulating snowpack. Photo by Joe Zagrodnik.
The trailer has a Pluvio type of rain gauge and a Parsivel Disdrometer. The Pluvio is a very sensitive weighing type rain gauge that has a glycol mixture in it so falling precipitation, either liquid or frozen, will melt and the liquid equivalent is measured. The Parsivel Disdrometer measures the sizes of the falling drops or snowflakes and has a thermometer so we can tell if it is below freezing. Earlier in the project when the radars and airplanes were flying in storms, this trailer mostly experienced rain. However starting in mid December, the storms became colder and the trailer frequently experienced snow. Sometimes a bit too much snow.
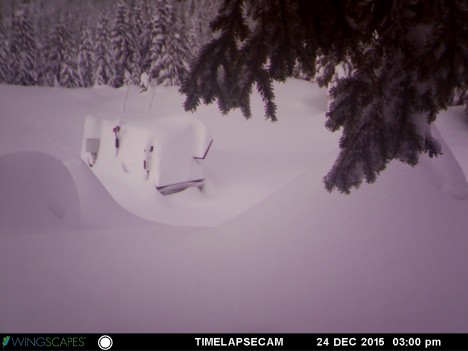
Photo taken December 24, 2015 by the remote camera monitoring the snow accumulation at the trailer. This snow came from the same series of storms that buried the PIP at Hurricane Ridge shown above.
A team of National Park rangers and our own graduate students often had to hike, ski or snowshoe to the trailer to dig it out, empty the Pluvio or recharge the batteries. In one 10 day period in early December, the trailer recorded over 40” of precipitation. That is more than the average annual precipitation in ‘rainy’ Seattle. So far, it has recorded over 200” of precipitation (liquid – Snow Water Equivalent, SWE) since October 1, and during the latest visit to the trailer around March 7, there was a foot of new snow.
Photos taken of the most recent trip to the trailer in early March. Our hero, CJ Urhnes is emptying the Pluvio. Photos by Bill Baccus.
Another important part of measuring snow is measuring the snowpack. Currently there are only 4 SNOw TELemetry or SNOTEL locations in the Olympic Mountains. These are permanent installations that make long term measurements of snow depth, total precipitation and other meteorological measurements (http://www.wcc.nrcs.usda.gov/snow/). In the Olympics Mountains, these are located mostly in the northeastern section. However, our focus was on the south and southwestern sides where there are no SNOTEL sites. In order to document the accumulating snowpack and the eventual melt-off, Dr. Jessica Lundquist of the Civil and Environmental Engineering Department at the University of Washington and her team of hardy graduate and undergraduate students installed snow stakes and remote cameras at 18 locations within the higher terrain on the southwestern side of the Olympic Mountains. Each site was installed in the summer in a series of backpacking trips deep into the wilderness areas.
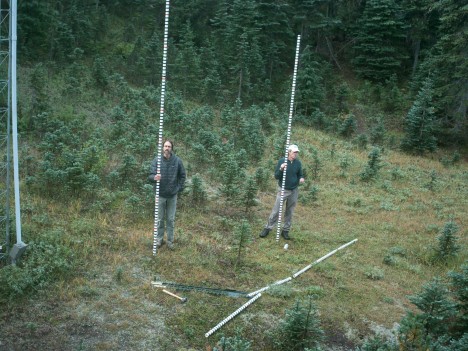
Bill Baccus of the Olympic National Park and Joel Massmann installing calibrated snow stakes in the Olympic National Park. Photo by Adam Massmann.
The cameras are installed in trees and take pictures of the stakes (with marks every 10 cm) several times a day. As the snow falls, the total on the ground is measured by the snow stake and photographed by the camera. Then the following summer the memory card from the camera is retrieved and analyzed.
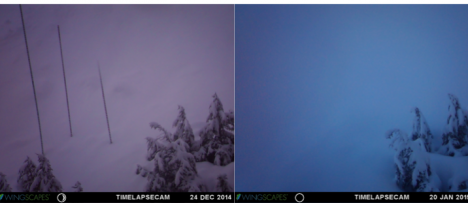
Photos taken by remote cameras during the 2014-15 snow season. The photo on the left shows three snow stakes measuring the snow depth. The photo on the right is taken after the snow stakes were obliterated by an avalanche. Now you see ’em, now you don’t. New snow stakes were installed for 2015-16 season in a different location that (hopefully) doesn’t experience avalanches.
Sometimes the students found that the stakes were mysteriously bent. They speculated that either wind or avalanches caused these problems. However at one site, the local inhabitants appeared to want to have a say in the new decorations of their meadow.
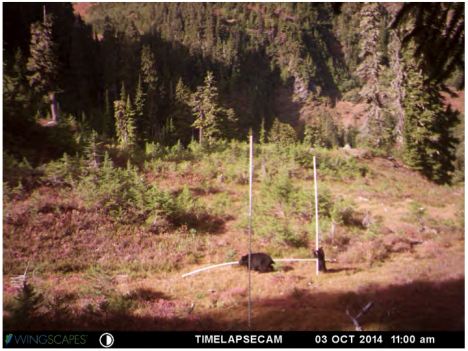
Mama Bear and Baby Bear trying to move the snow stakes to a ‘better’ location. Photo taken by the remote camera in October 2014.
A key component to interpreting the data from snow cameras is to have measurements of the density of the snow pack. That way the snow depth as photographed by the cameras can be converted to SWE, which tells how much water is stored as snow. That can only be done through direct measurements of the snowpack through snow surveys. For OLYMPEX, there will be two snow surveys, one in midwinter and one at the peak snowpack in April. The midwinter snow survey took place last February and is shown below. Here they are weighing the snow collected by the tube in order to calculate the density of the snowpack.
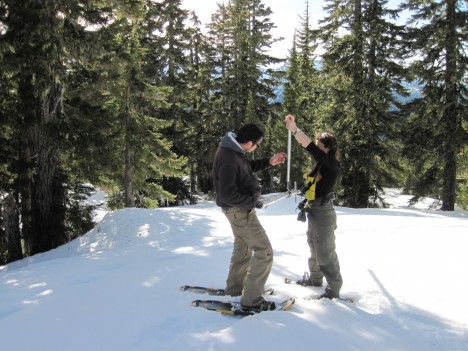
Making snow density measurements in the Olympic National Park. Photo by Bill Baccus.
Lastly, coincident with the snow survey, measurements of the snow depth over the entire Olympic Mountains were taken by Lidar instruments aboard the NASA Airborne Snow Observatory (ASO) plane of JPL (aso.jpl.nasa.gov). A second flight will take place in April coincident with the next snow survey.
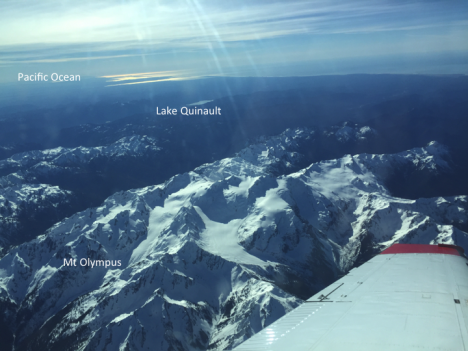
Photo taken from the ASO Lidar flight over the Olympic Mountains. Mt. Olympus, Lake Quinault and the Pacific Ocean are all visible in this image. Photo by Liz Duffy.
OLYMPEX– measuring rain and SNOW – over the Olympic Mountains.
I want to get measuer data od olympiv mountain experiment of MRR anf PARSIVEL.