Not content with looking at ice from the air, on their day off from flying last week the MABEL and ER-2 team decided to look at ice underground. About a dozen of us went to visit the Permafrost Tunnel Research Facility, a U.S. Army site north of Fairbanks, Alaska, where the crew is based for a summer campaign.
Cut into a forested bluff, with just a red, shed-like structure leading into the hillside, the Permafrost Tunnel doesn’t look like much from the outside. But inside, there are thousands of years of sediments, plants, and ice-age mammal bones frozen in the wall.
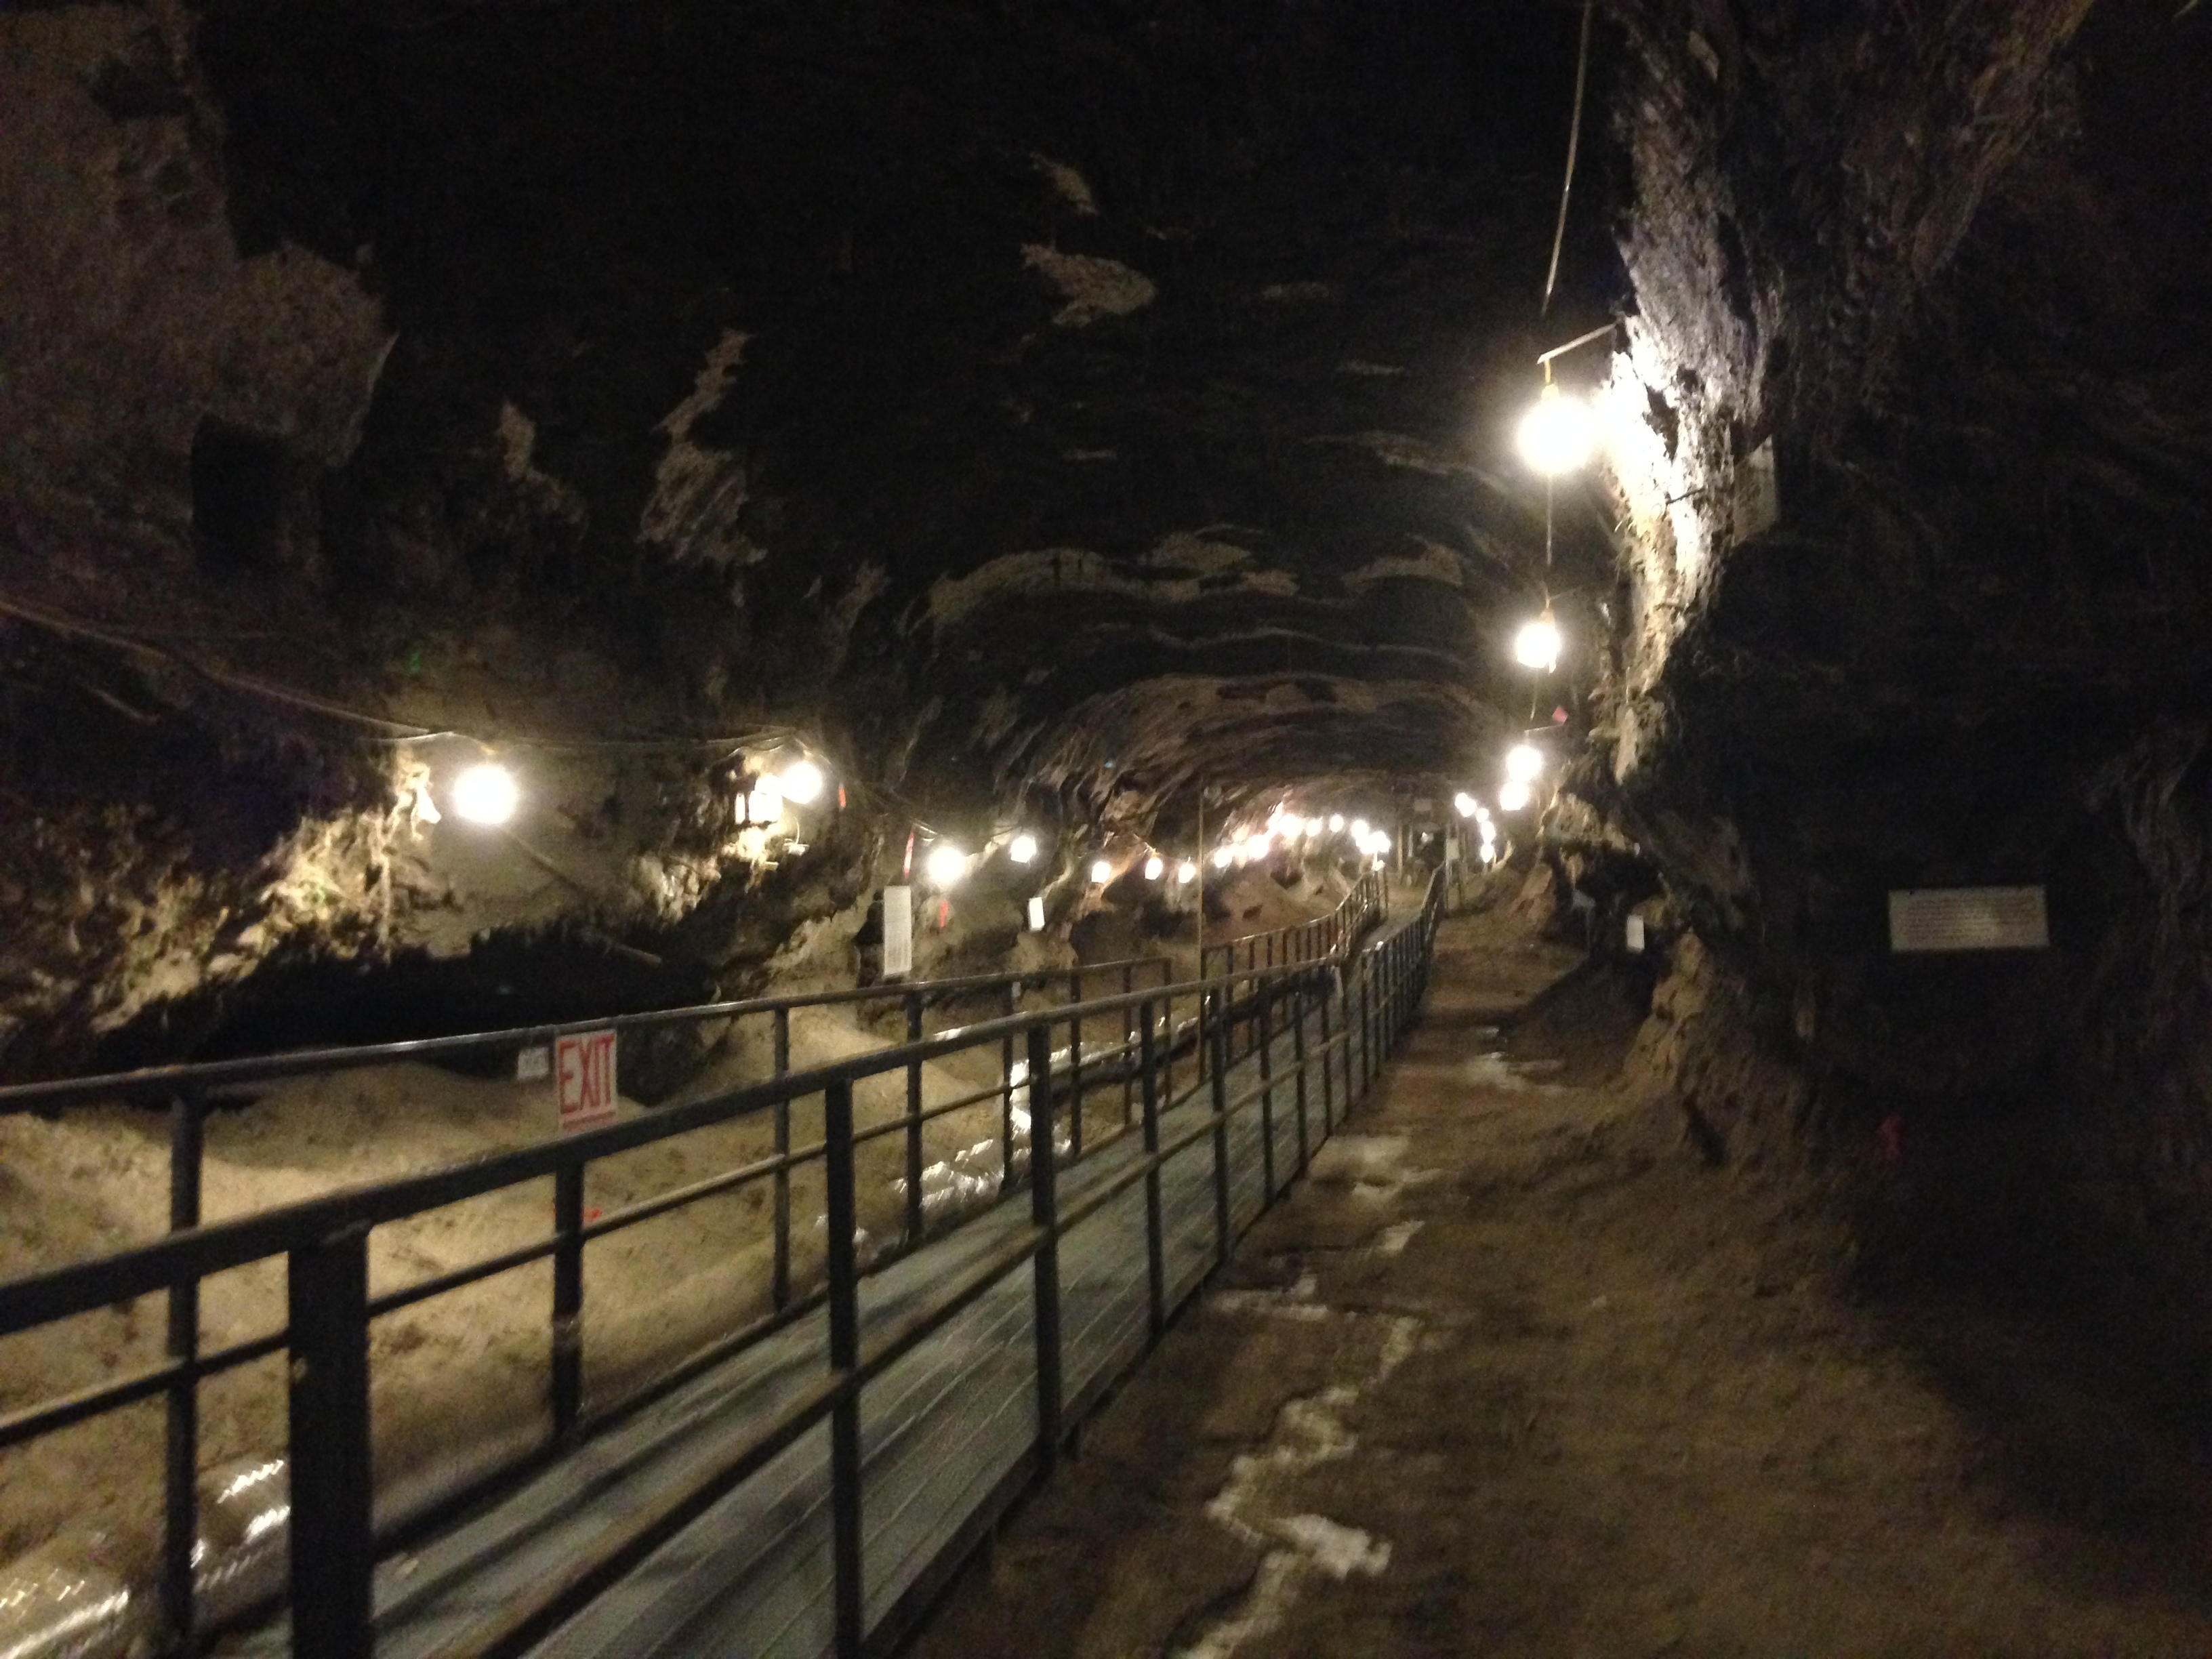
The Permafrost Tunnel Research Facility, dug in the mid-1960s, allows scientists a three-dimensional look at frozen ground. (Credit: Kate Ramsayer/NASA
It’s hard to say what you notice first: the cold or the smell. The cold – it’s kept at a brisk negative 3 degrees Celsius (26.6 degrees Fahrenheit) – is now maintained during the summer with a chiller system. Opening and closing the tunnel door for decades, along with warming outside air temperatures, would otherwise melt the permafrost. The smell, explained our guide Tom Douglas, a geophysicist with the Army who conducts research in the tunnel, is from all the decaying organic material in the walls – plant and animal matter – coming into contact with the air and oxidizing.
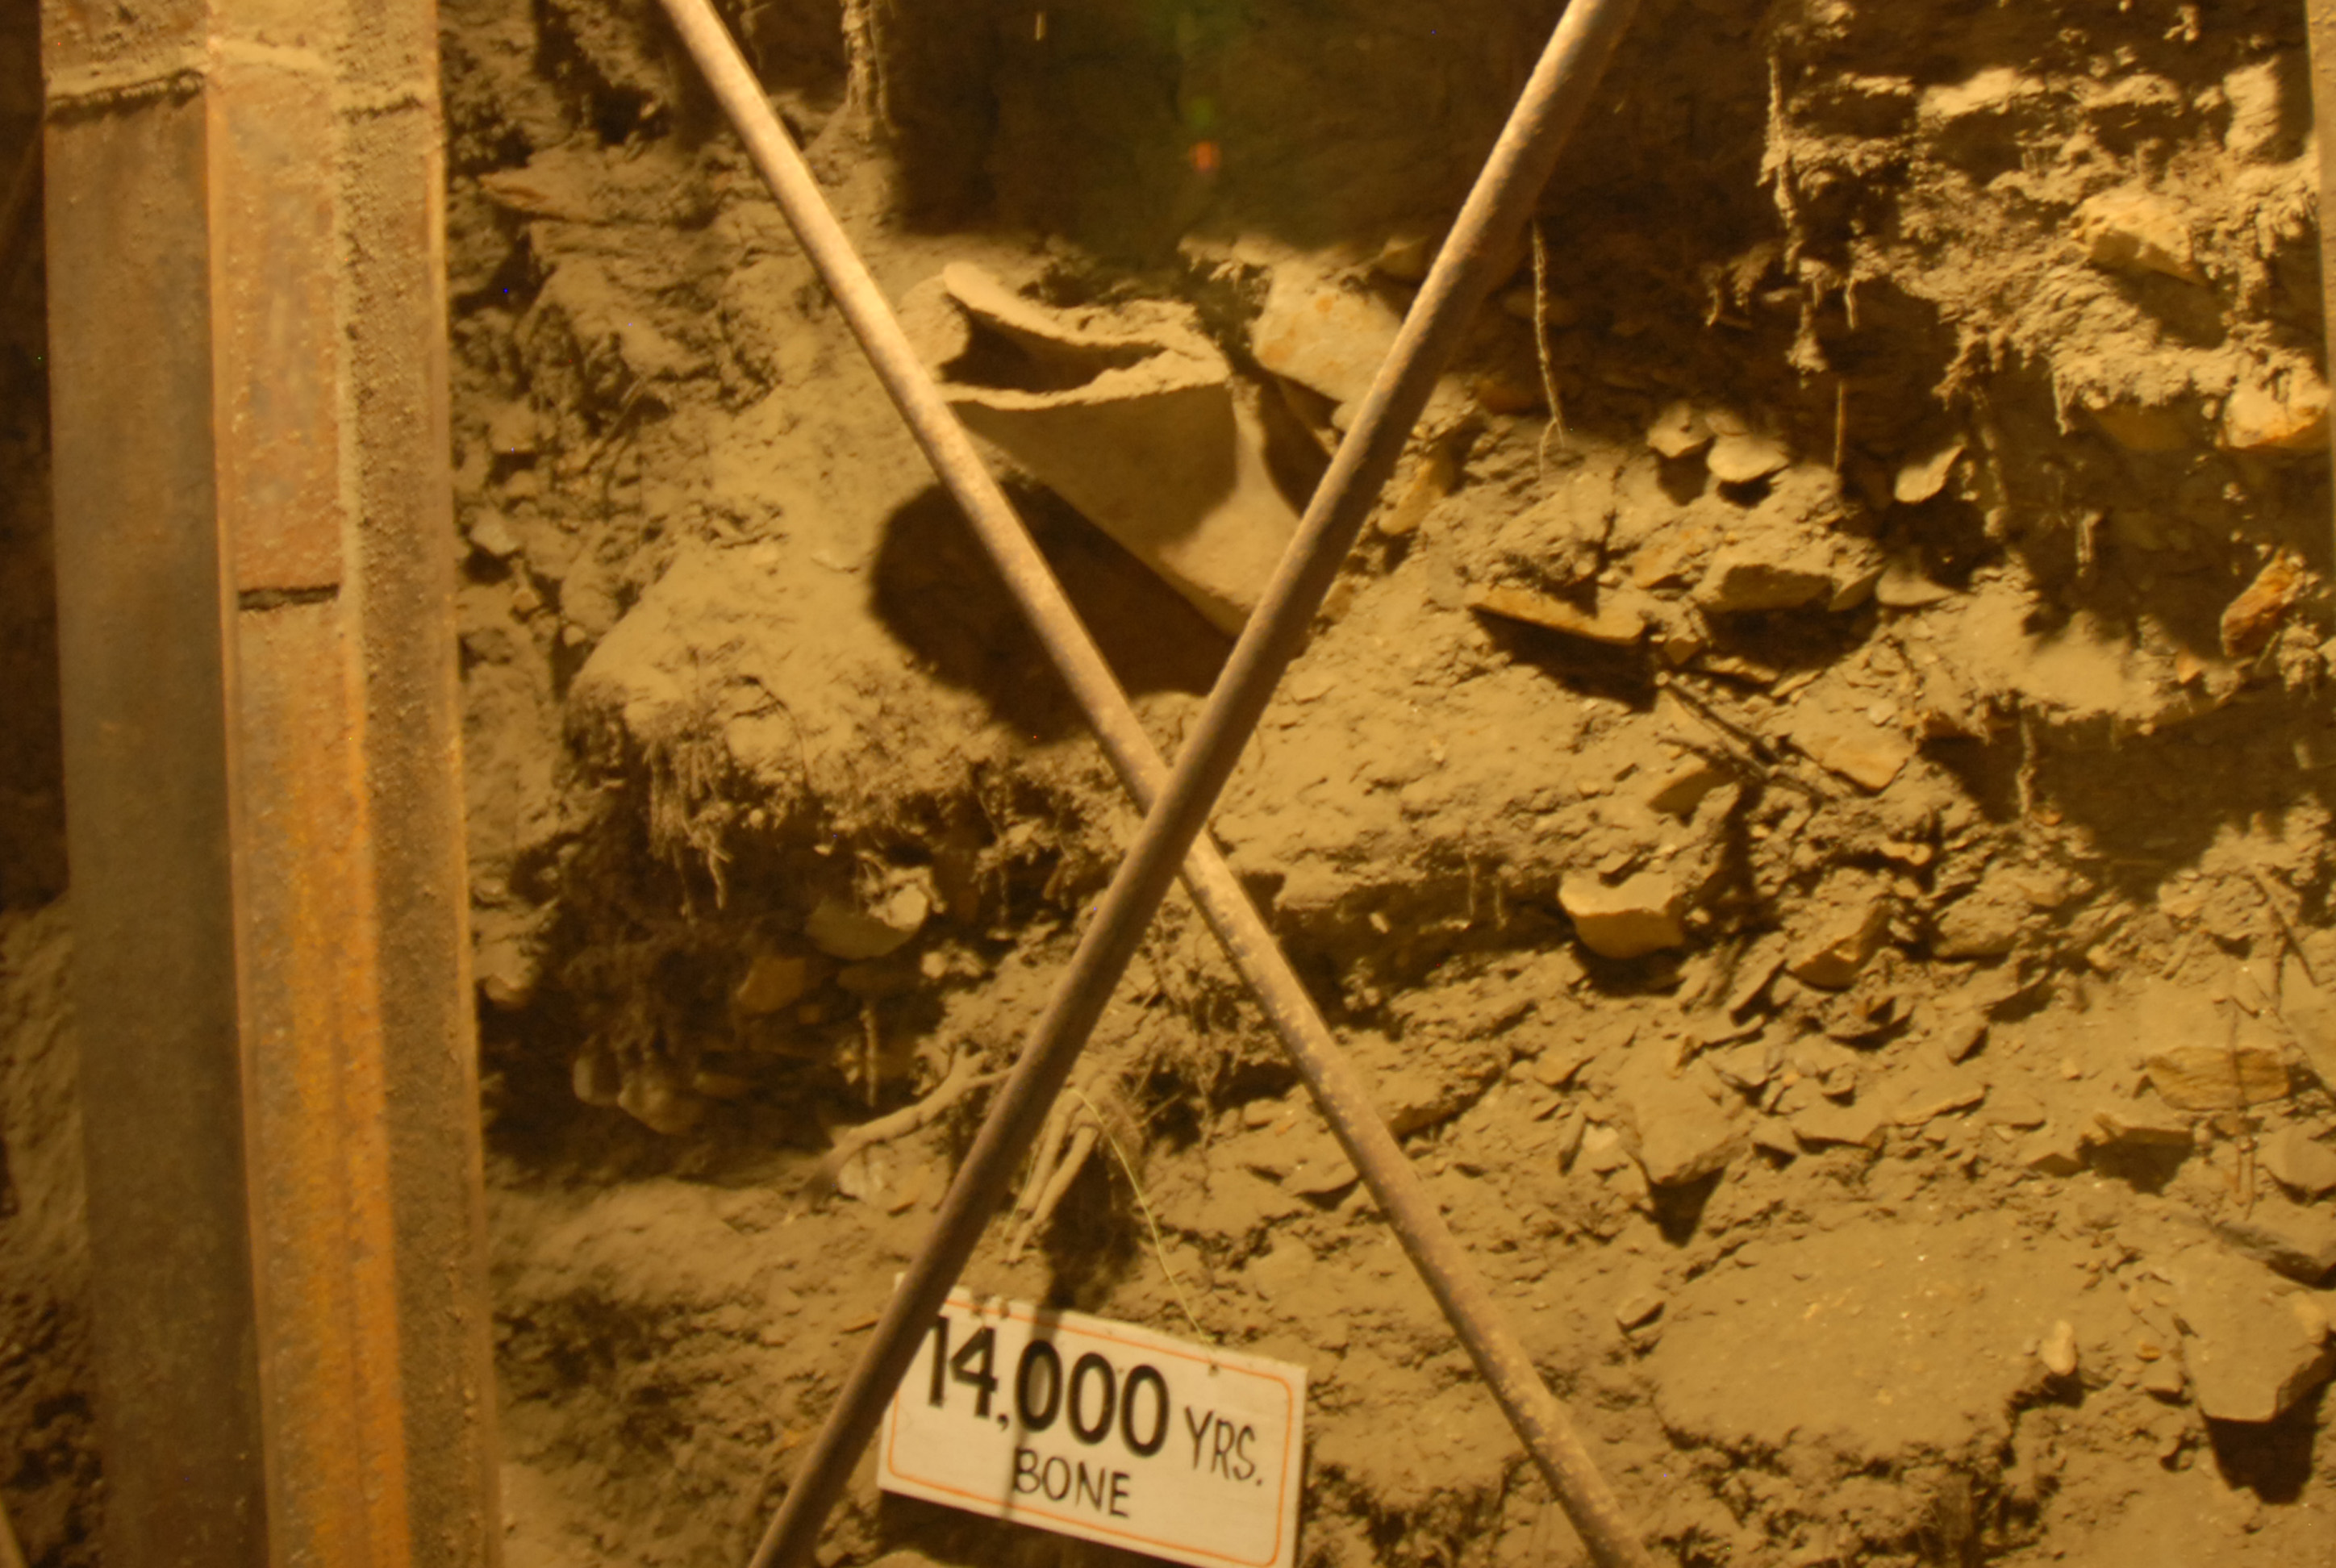
A mammal bone sticks out of the wall of the Permafrost Tunnel. (Credit: Kate Ramsayer/NASA)
Permafrost is ground that stays frozen for more than two years – including the summer months. In cold areas like Central and Northern Alaska, permafrost can build up over millennia, creating a kind of time capsule. In the Permafrost Tunnel, tiny roots of grasses and trees that lived 20,000 to 30,000 years ago drip from the ceiling.
“They’re preserved,” Douglas said. “They tend to be freeze-dried a little bit.” A giant, and surprisingly heavy, mammoth femur was found in the tunnel; horns of bison-like creatures still stick out of the wall. In a wedge of ice cutting through the permafrost, Douglas explained, researchers had melted a sample and found microscopic organisms that hadn’t been previously described.
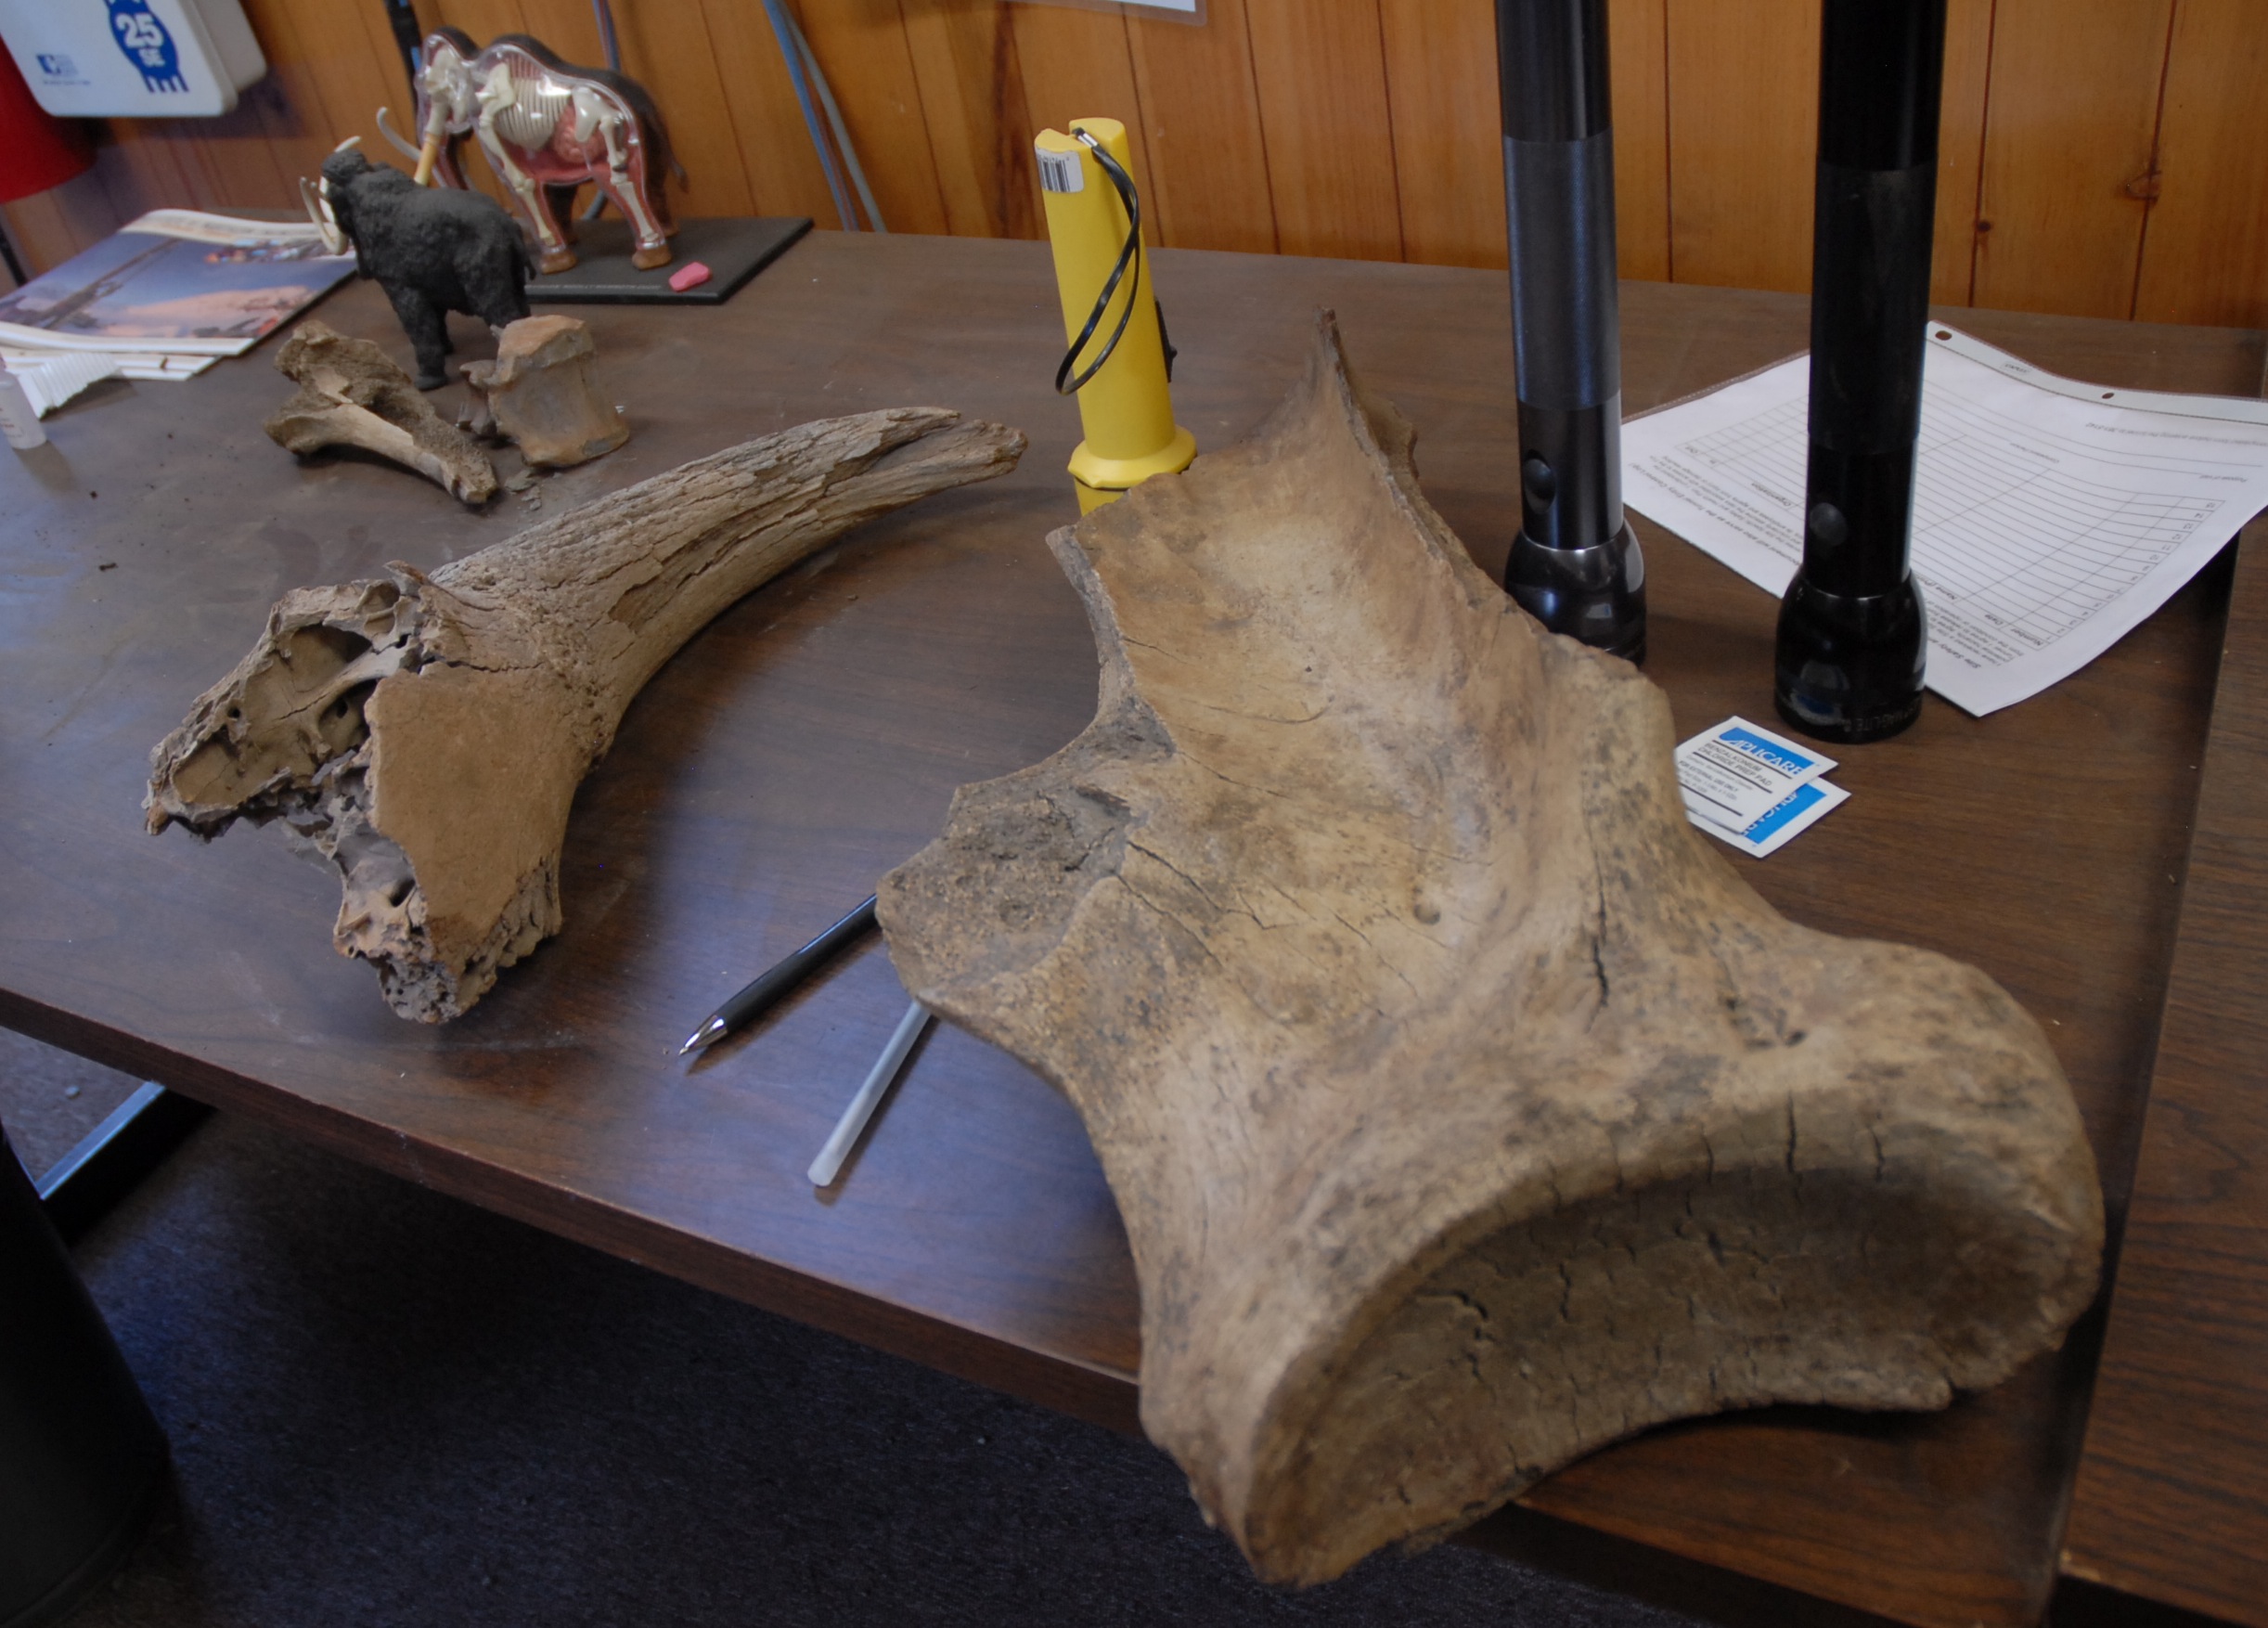
The tunnel turned up a variety of ice-aged mammal bones – including the giant leg bone of a mammoth. (Credit: Kate Ramsayer/NASA)
The ice wedges themselves are some of the tunnel’s most impressive. They’re created when the surface of the ground freezes and contracts in the winter, creating cracks in the ground. When spring comes, meltwater fills in those cracks, freezing when it reaches the permafrost layer. The next winter, when the ground cracks again, it often does so along the weak areas where it cracked before – and then another round of spring meltwater freezes, pushing the ground apart even further. Over the years, a lattice-work of wedges forms.
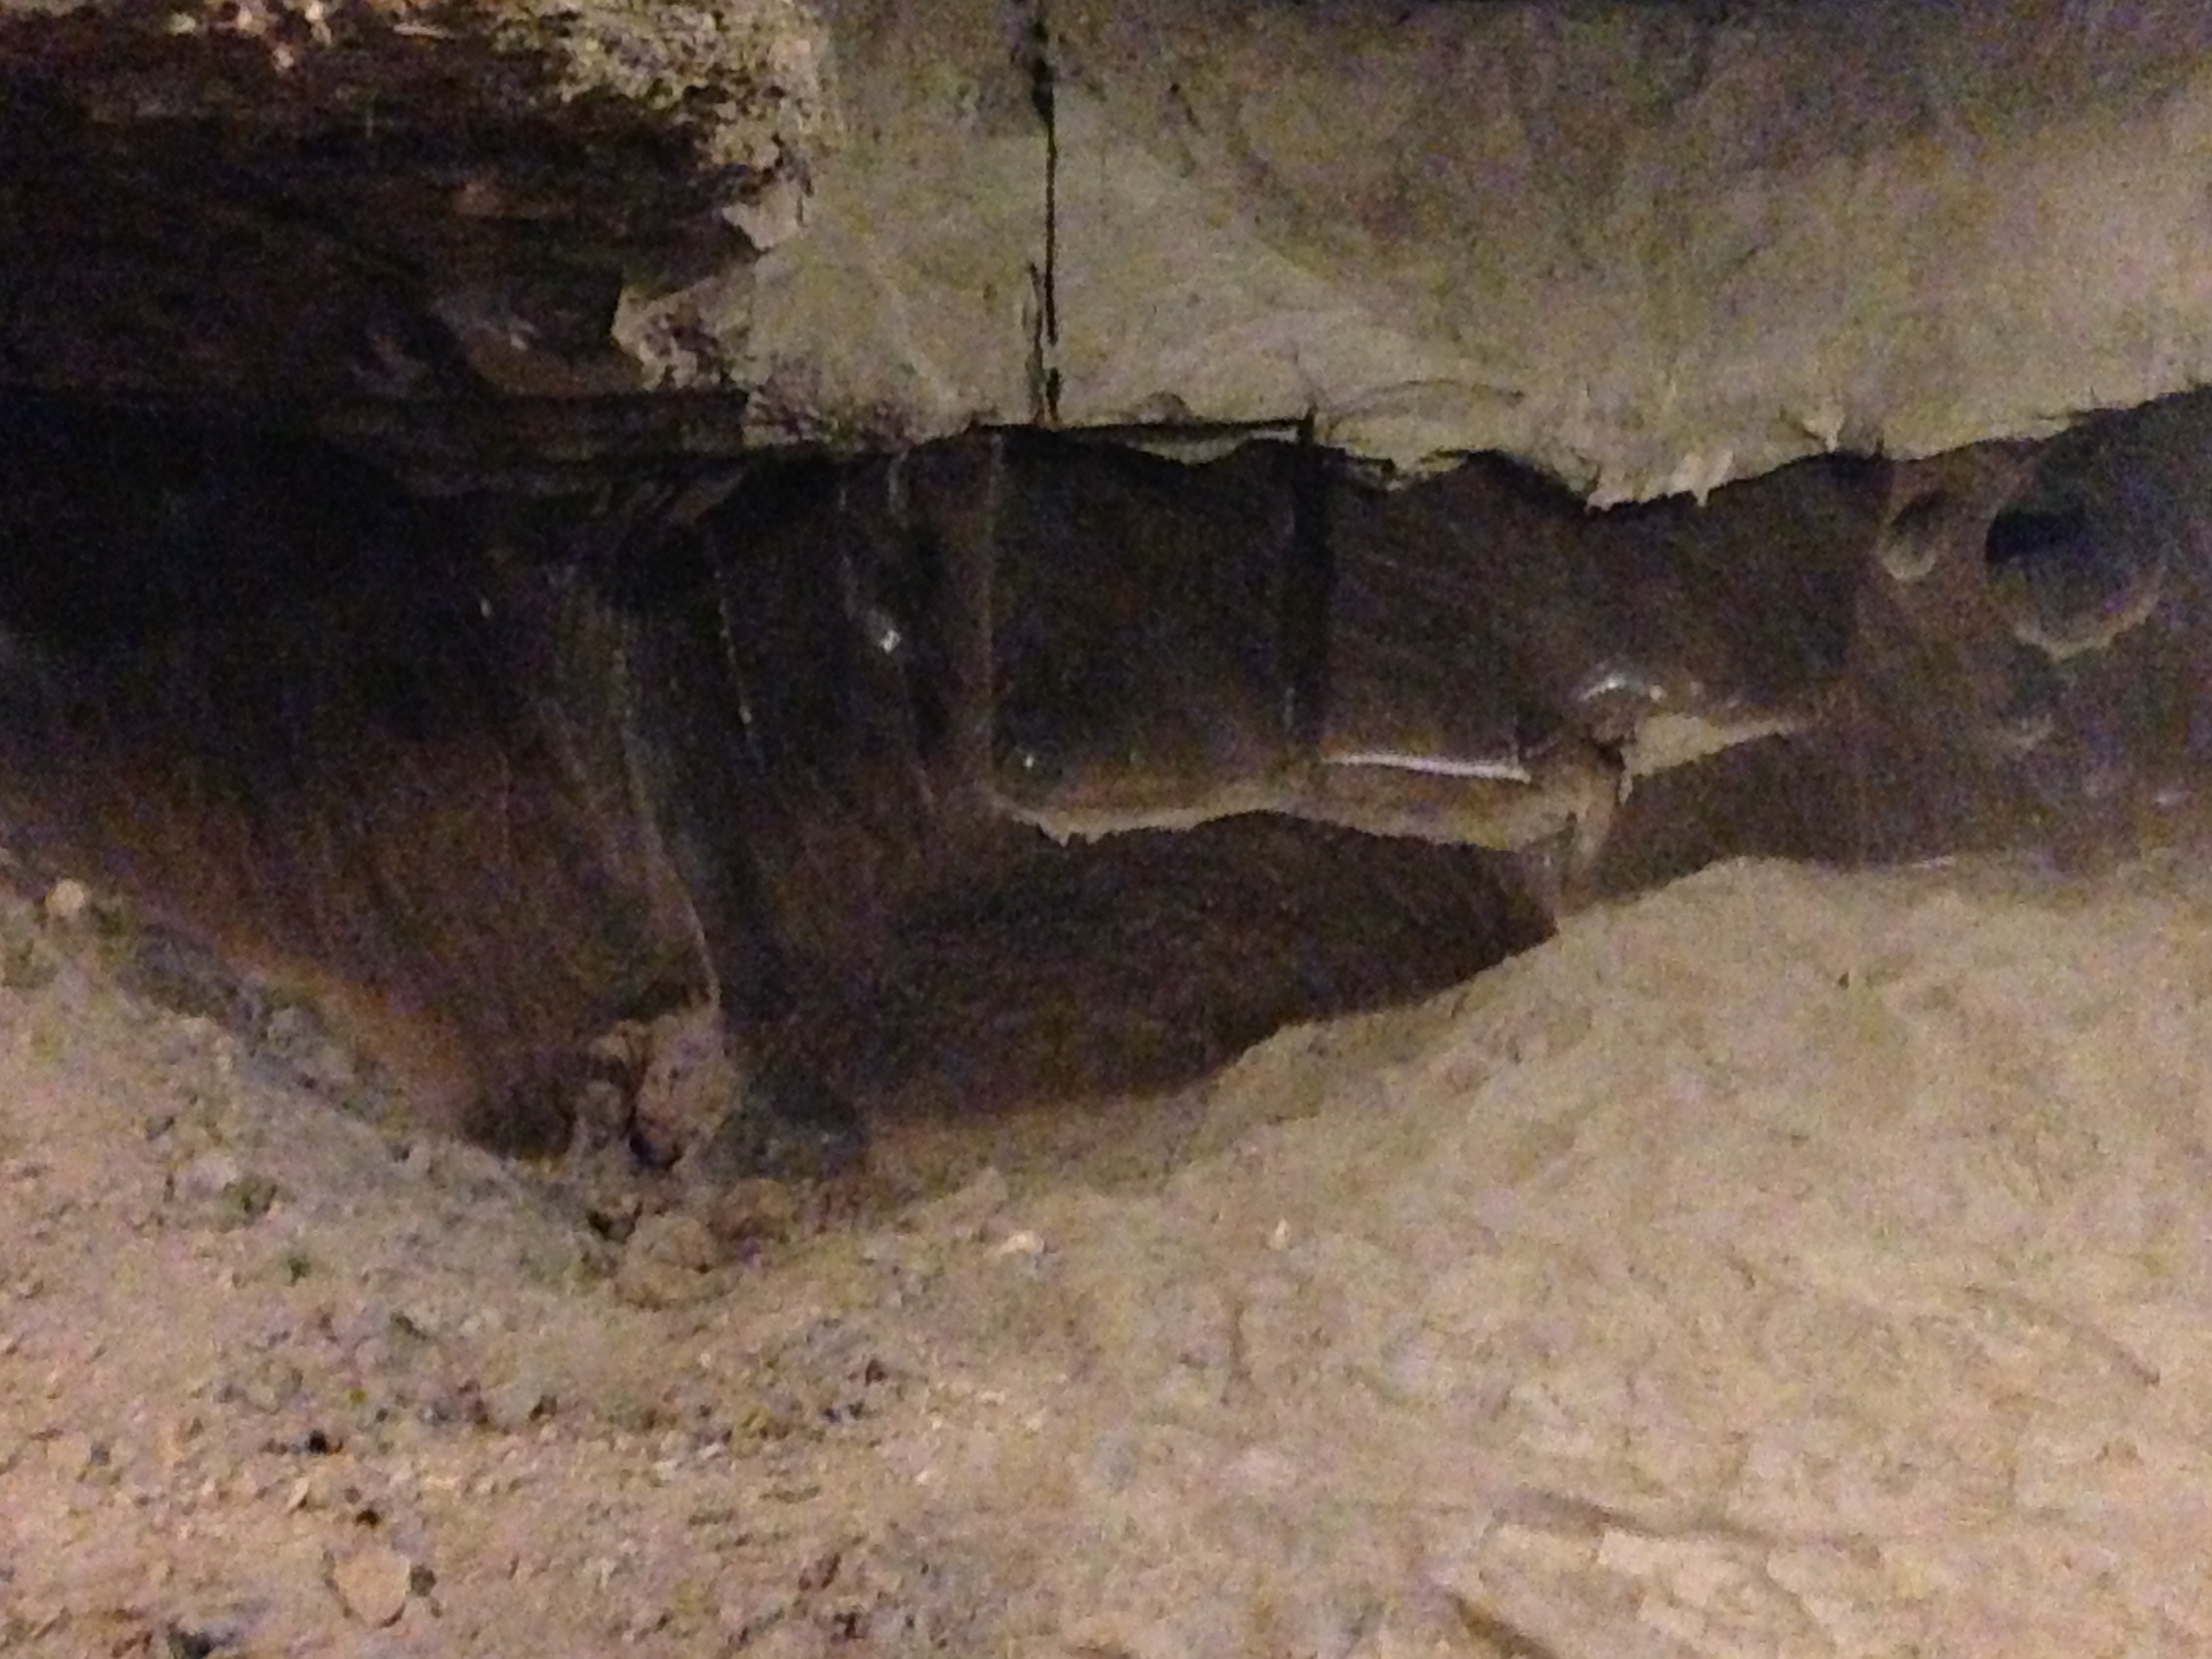
Ice wedges form over centuries, creating polygonal patterns in the permafrost. (Credit: Kate Ramsayer/NASA)
The tunnel was dug in the mid-1960s, Douglas said, and has been used for a variety of research. One question he investigates is how well different radars and surveying equipment can identify underlying permafrost, which is key for building and road construction – you don’t want to build on ground that could thaw.
The necessity for that kind of research was evident on the way back to Fairbanks – the road dips along the hillside, thanks to the dynamic ground underneath.
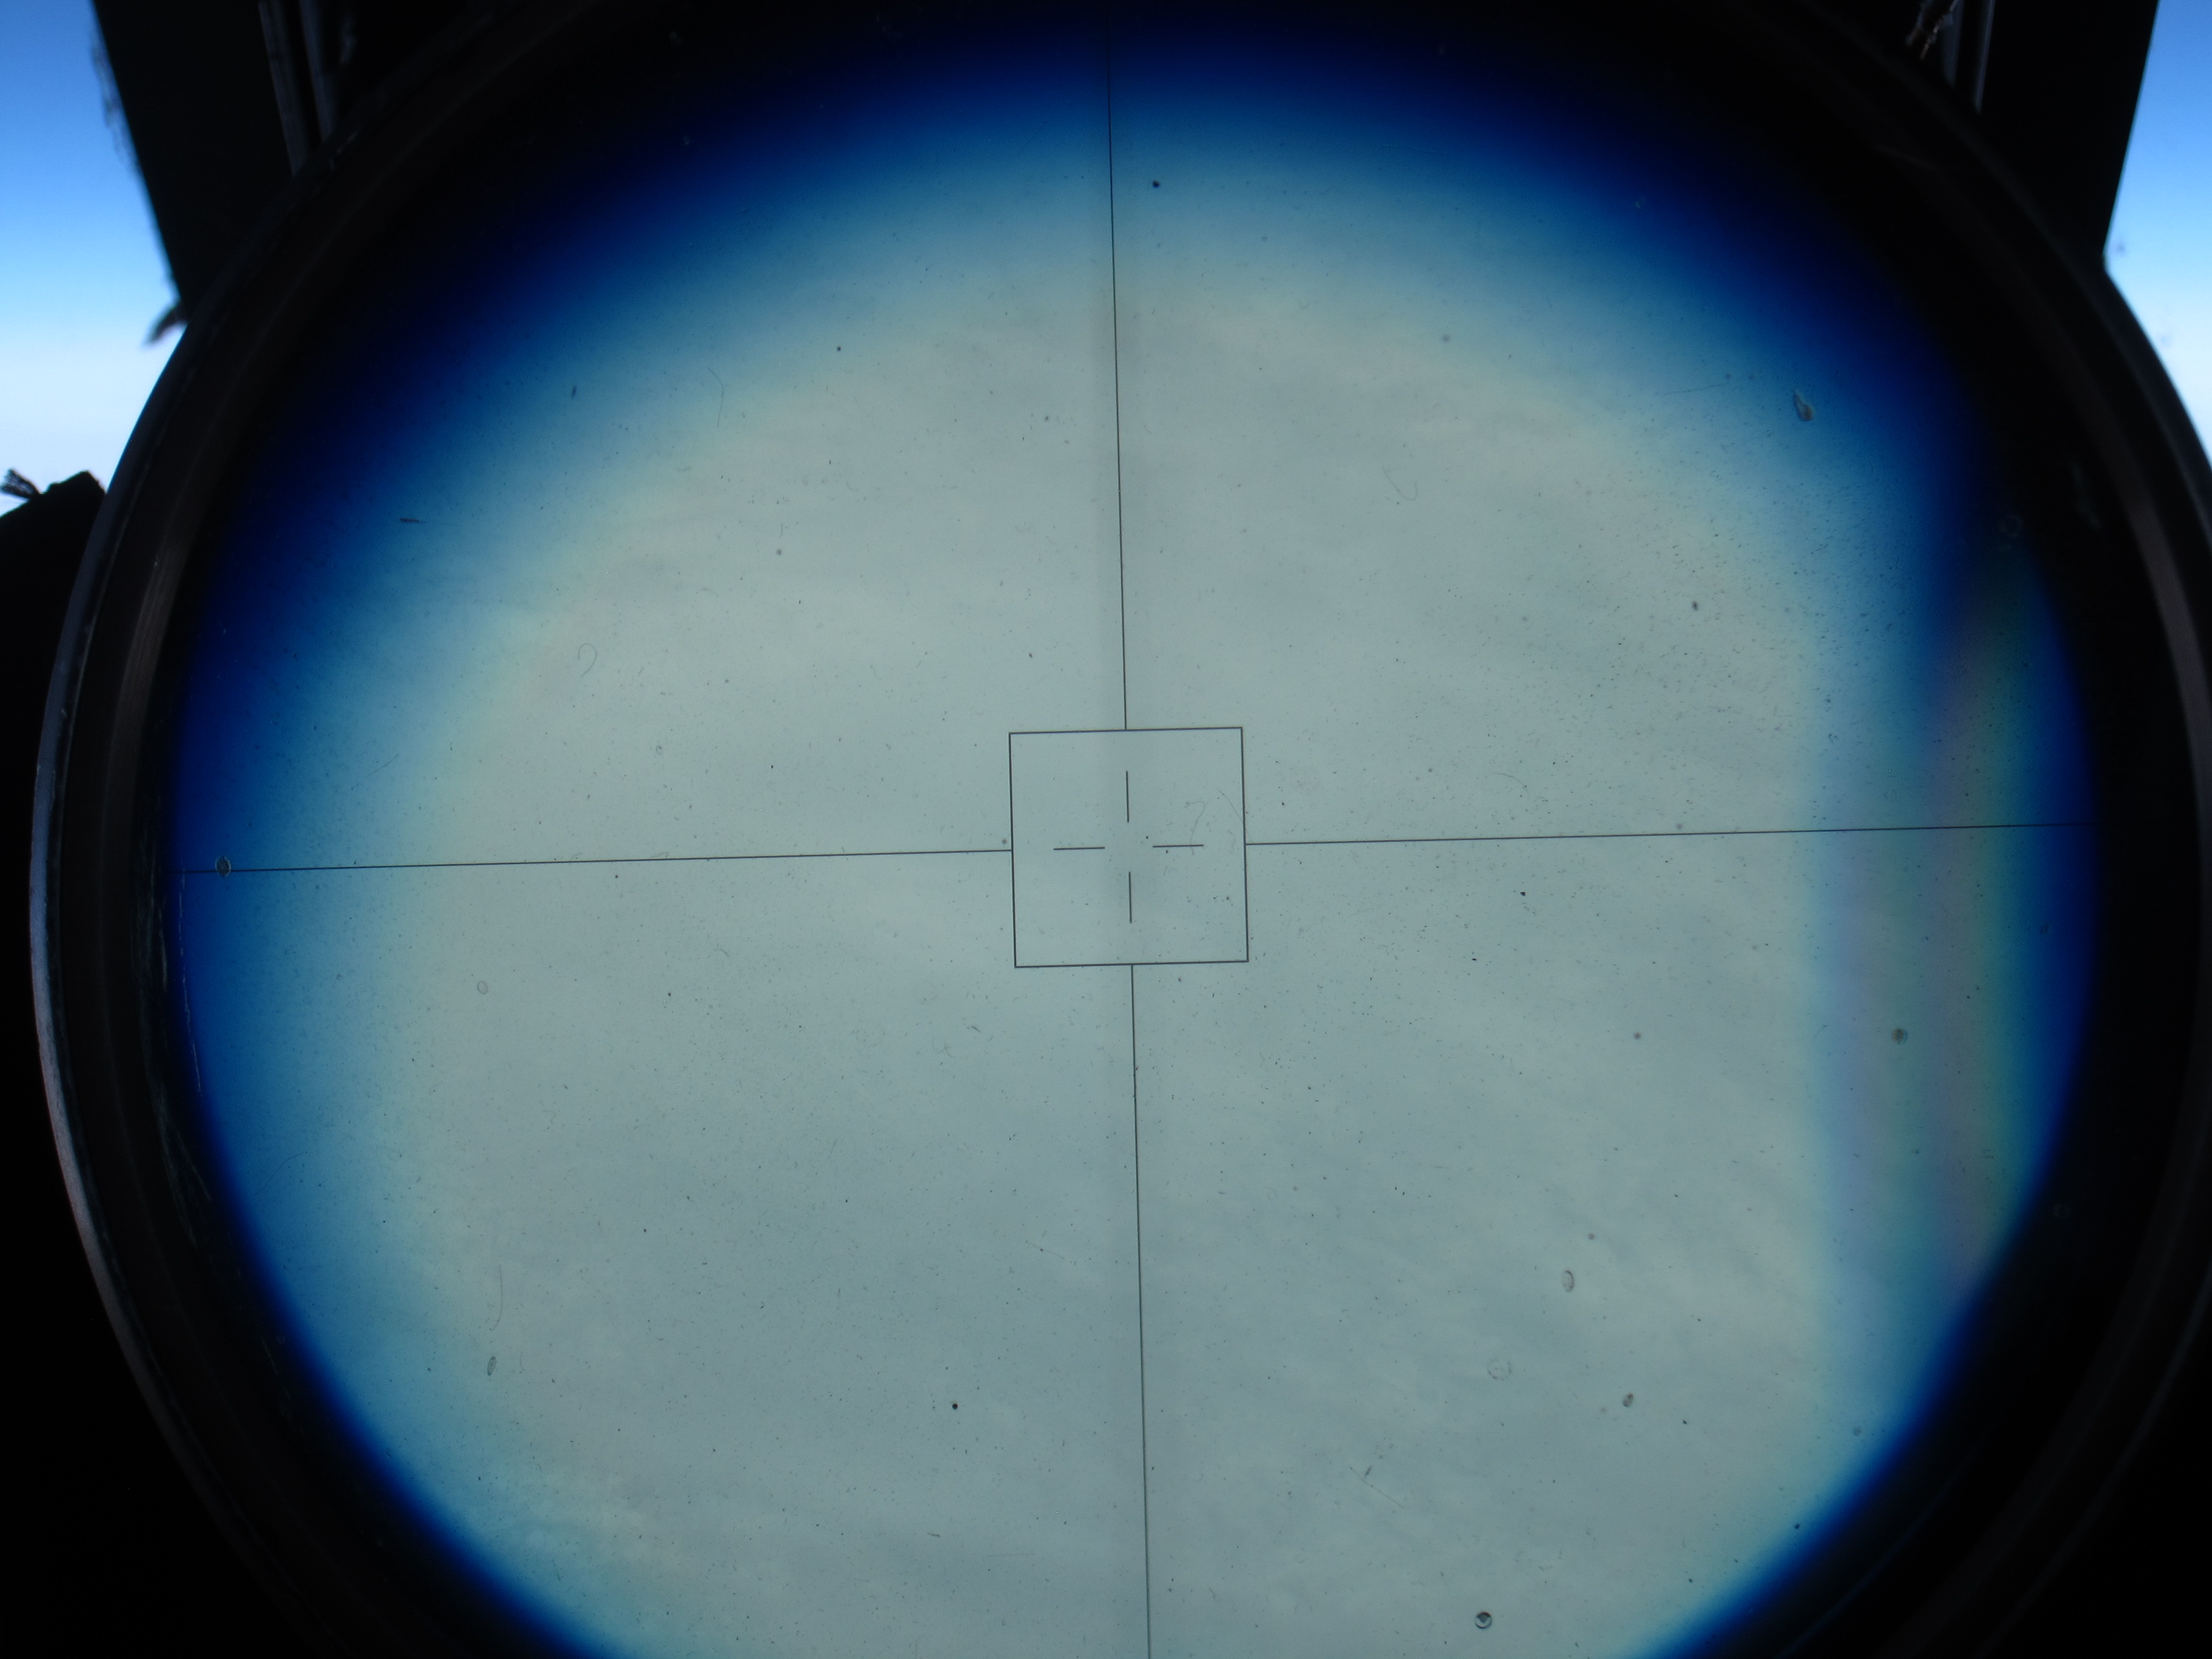
The North Pole! NASA pilot Tim Williams flew over the pole Wednesday afternoon. It was a cloudy day at 90 degrees north, as seen through the ER-2’s viewsight. (Credit: Tim Williams/NASA)
Fly north from Fairbanks and after a while, you’ll be off the map. Literally, as ER-2 pilot Tim Williams found out Thursday when he flew the NASA aircraft on a mission to the North Pole and back.
“At some point, the map’s not there,” he said at a post-flight debrief Thursday evening.
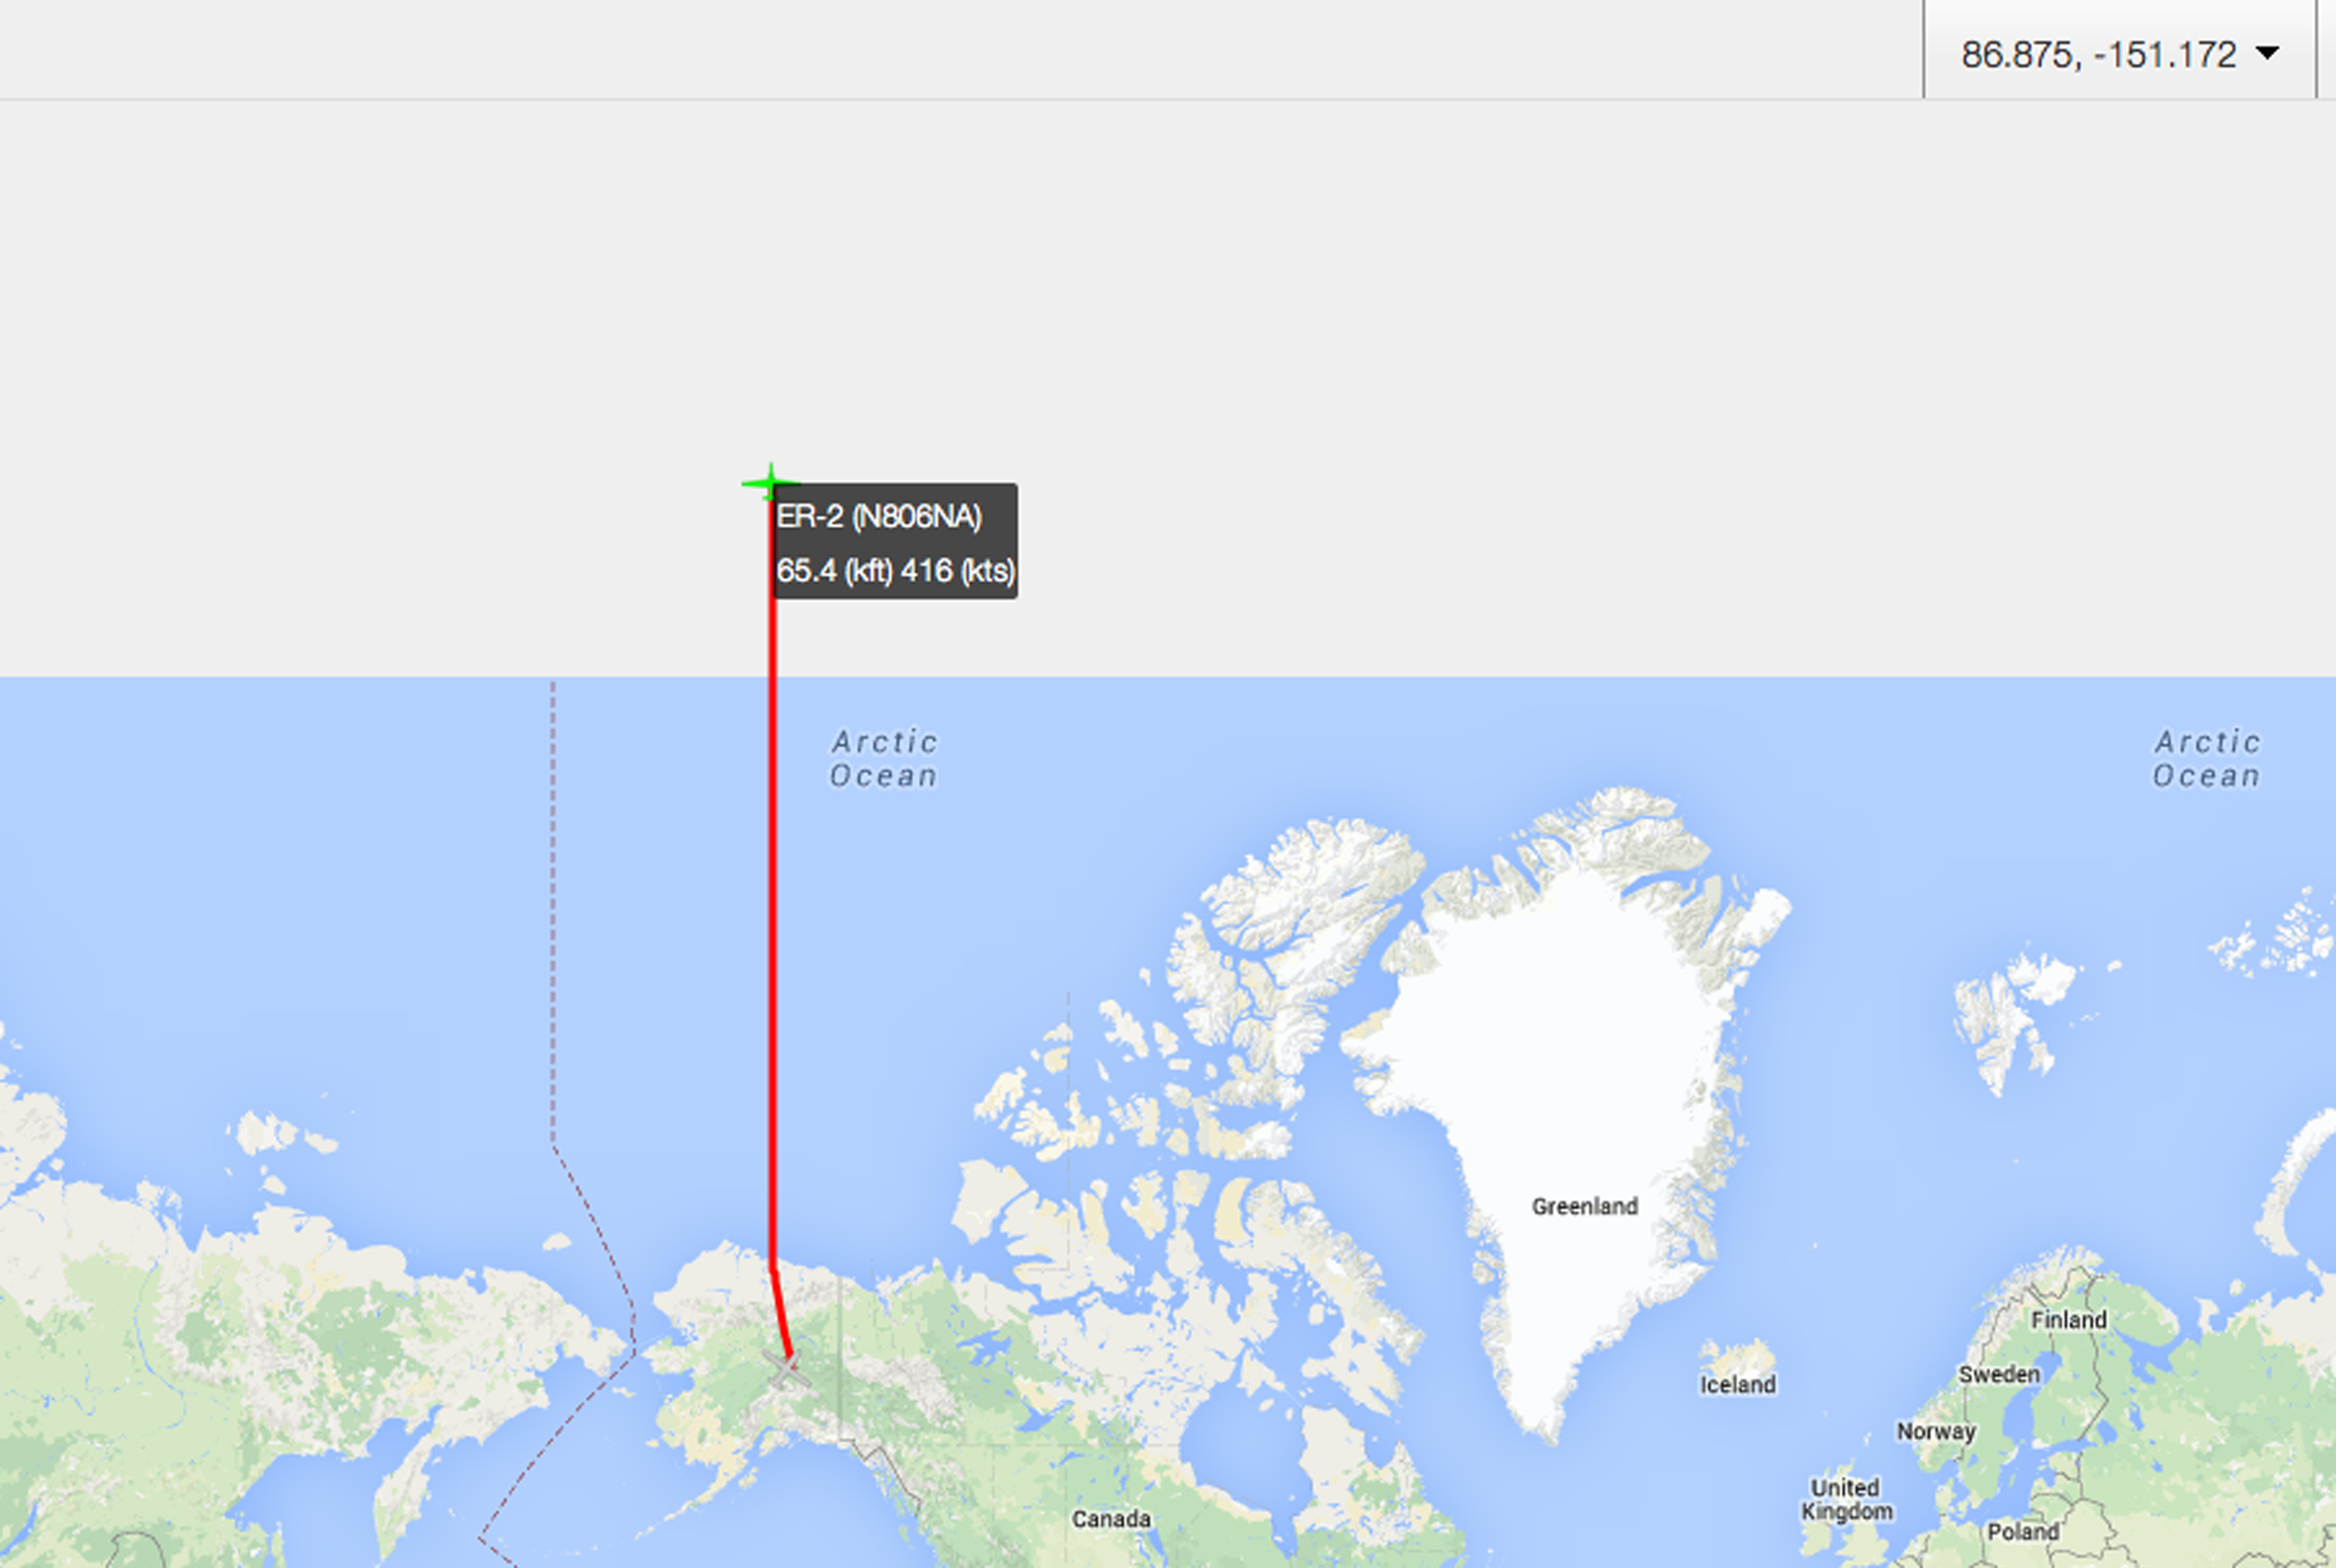
“Here be monsters” – or just map projection issues. Once the ER-2 got above about 89.5 degrees North, the pilot’s map didn’t cover it. Those of us tracking the plane from https://airbornescience.nasa.gov/tracker/ lost the map even earlier.
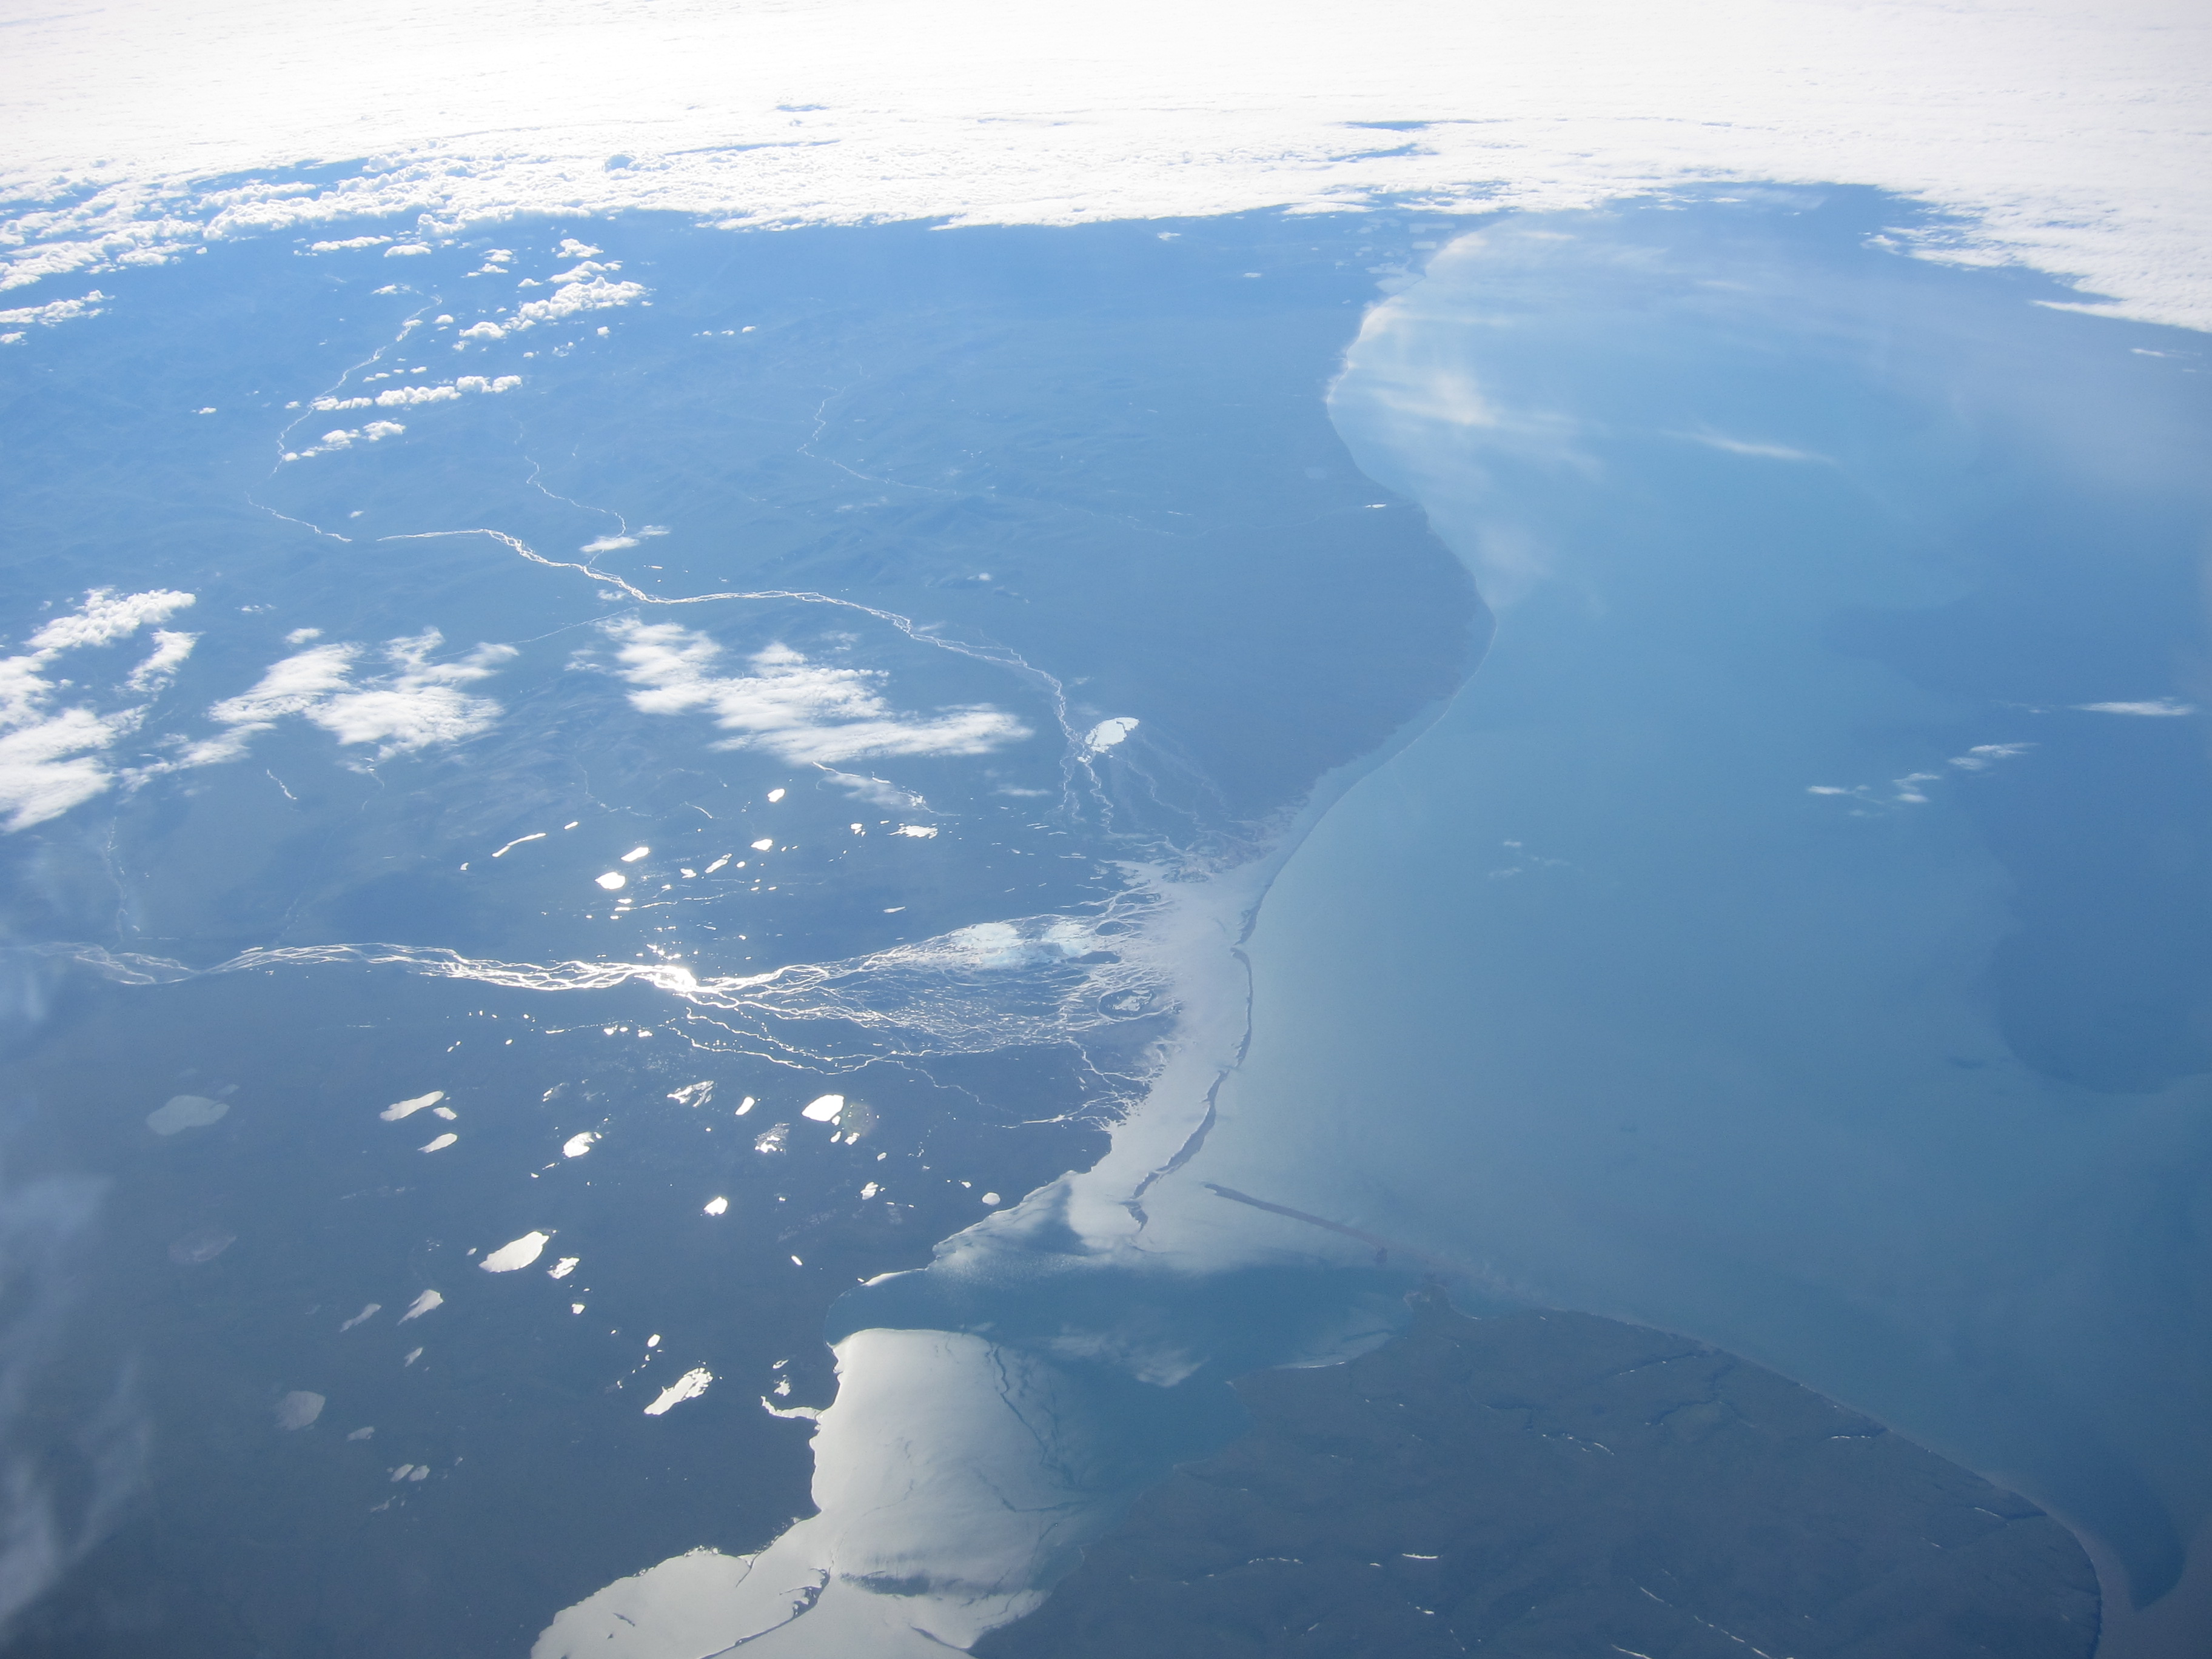
Williams flew due north along the 150 degrees west longitude line, carrying scientific instruments including MABEL, a laser altimeter that scientists are using to develop software for the upcoming ICESat-2 satellite mission. The goal for the pole-bound trip was to gather data over the spectrum of summer ice – from open water, to degrading ice, to thin ice, to multiyear ice, with some melt ponds on the way.
It was a smooth and cloudy trip up, Williams reported, and through breaks in the clouds he could see cracking ice below.
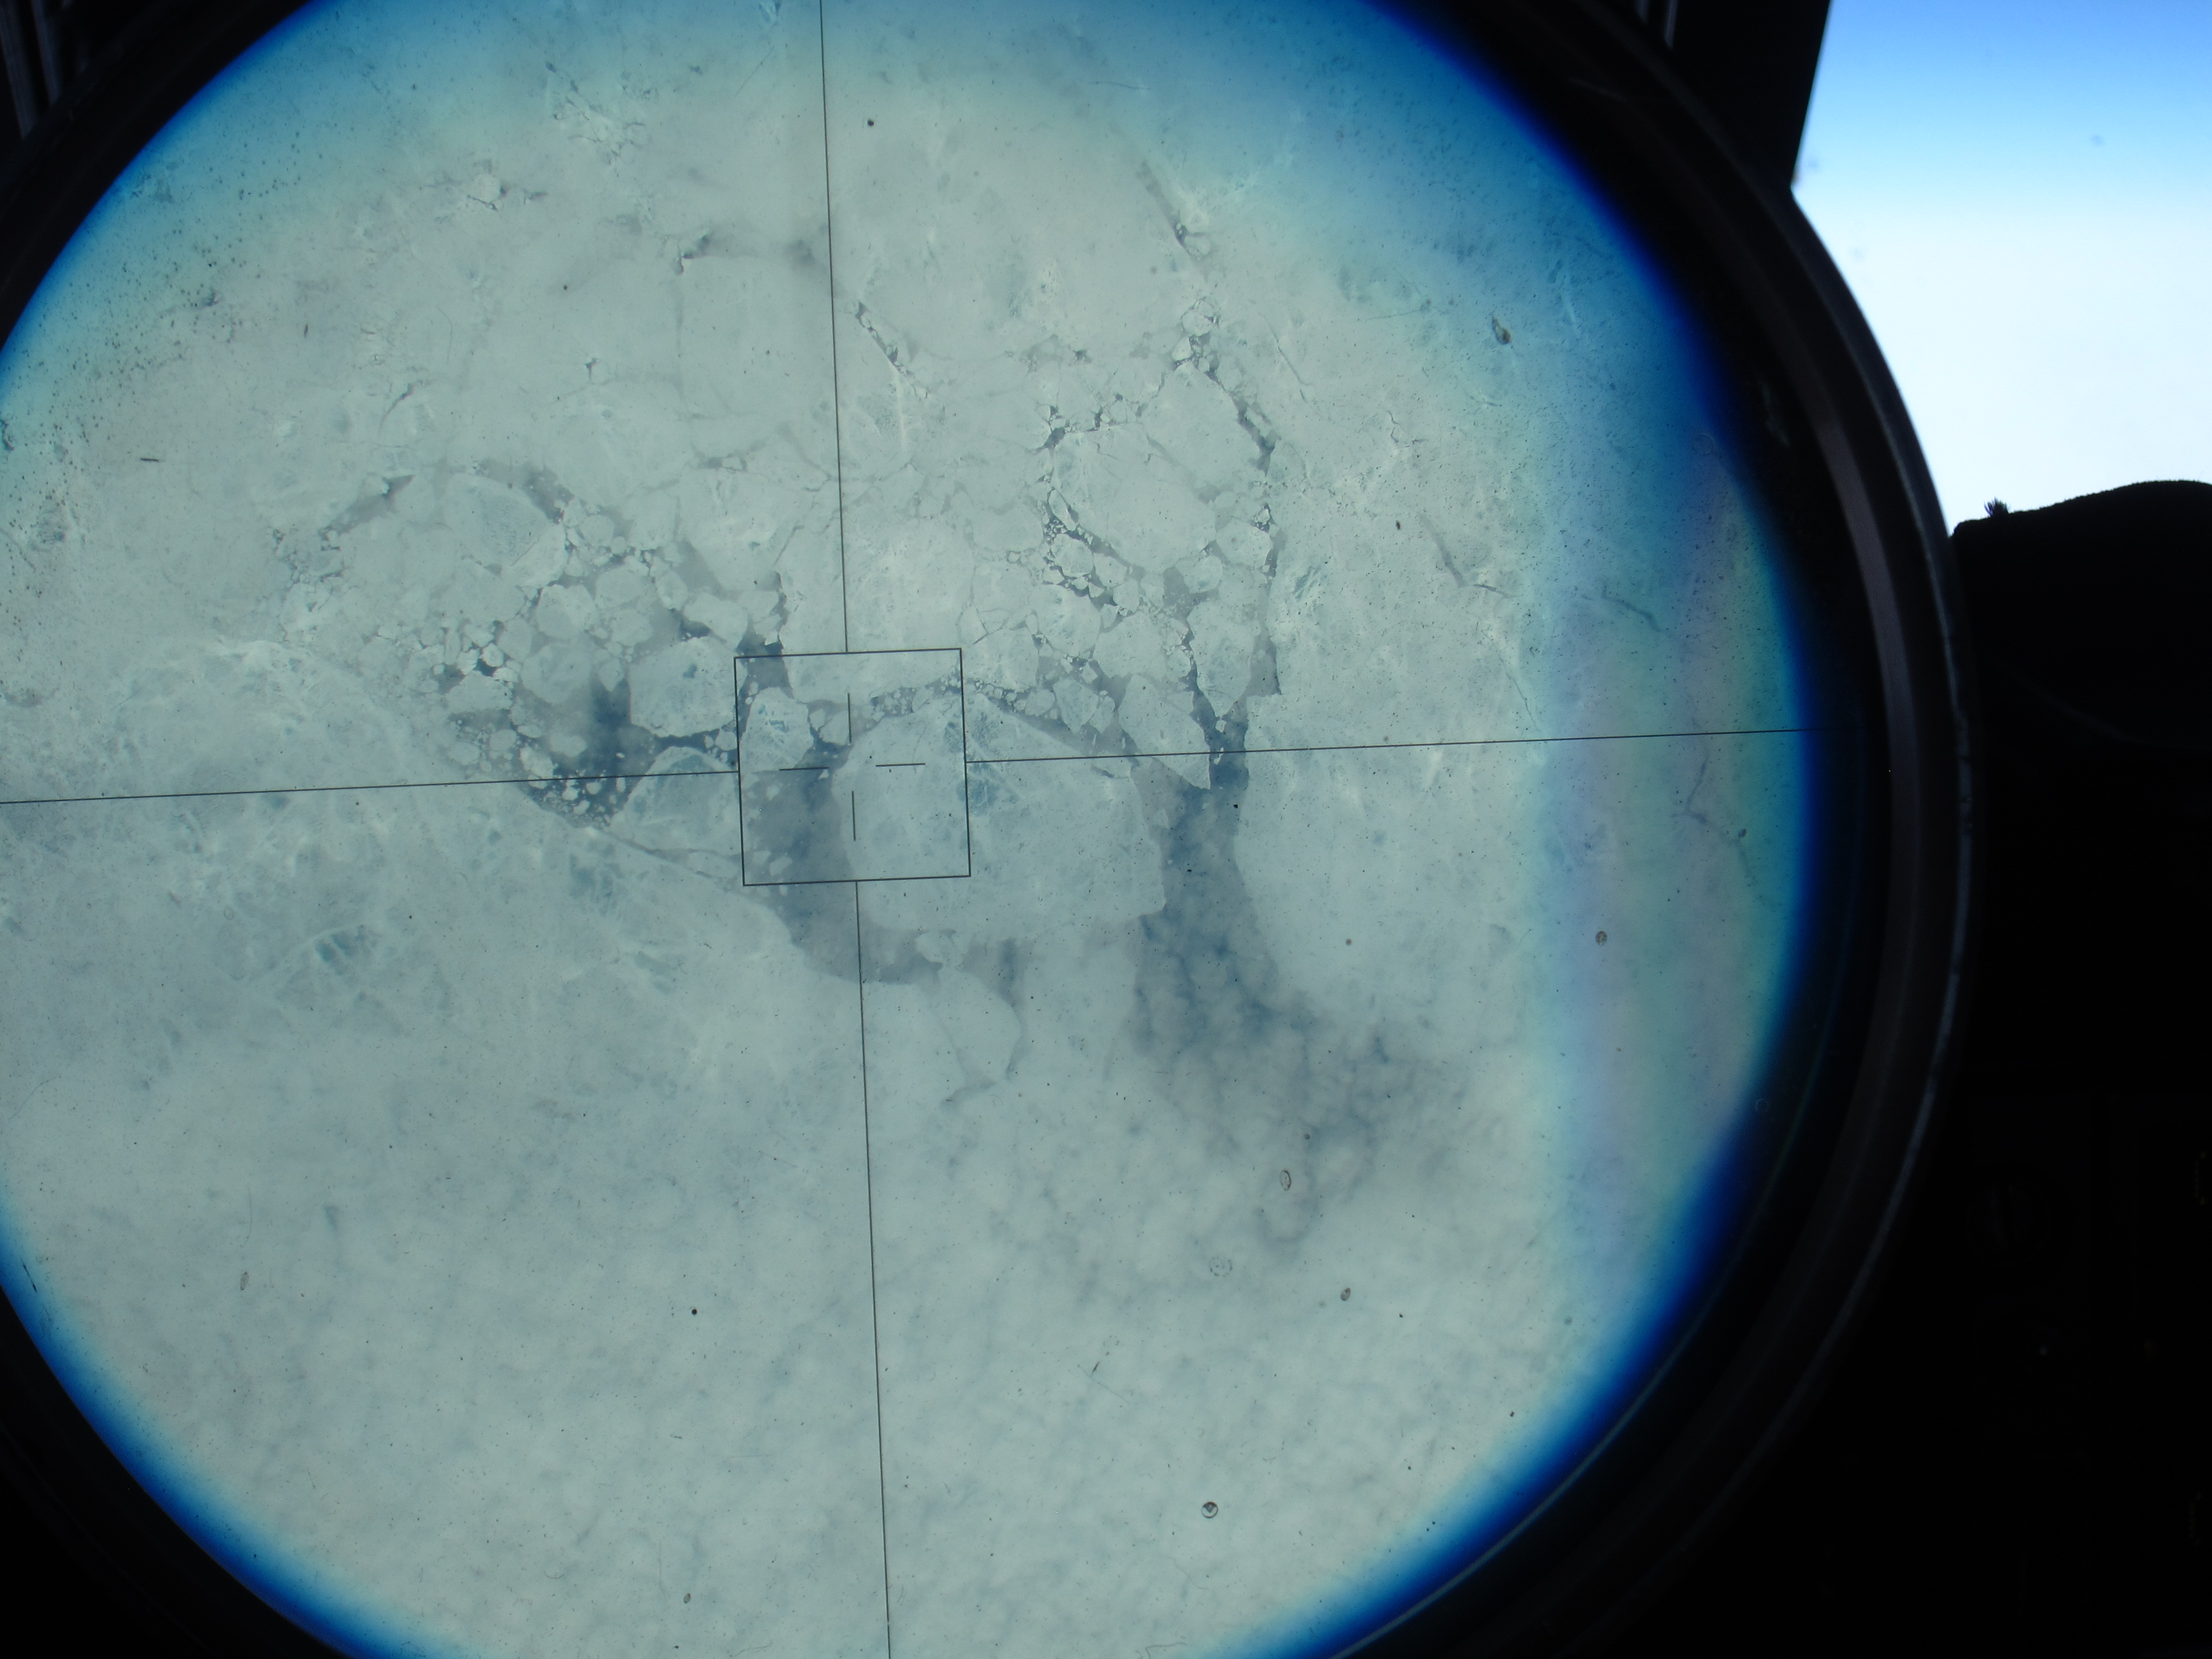
Sea ice, as seen through the ER-2’s viewsight, on the 150 degree latitude line north of Alaska. (Credit: Tim Williams/NASA)
“I expected it to be a lot more solid; it’s not,” he said. “It doesn’t look thick where I could see it.”
After about four hours in the air he reached the pole – 90 degrees latitude. His instincts were to look at the compass onboard, but it was “just a mess, it’s all over the place,” Williams said. At one point, his compass showed 180 degrees opposite from his navigation system.

On top of the world! Tim Williams piloted the ER-2 to the North Pole – it’s all south from here. (Credit: Tim Williams/NASA)
Still, he knew which way to go: “When you hit the pole, everything is to the south. So you just make a turn,” Williams said.
He rolled out, circling from the pole, until his navigation system gave him a heading. He found the 140 degree line, and flew back to Fairbanks – headed south.
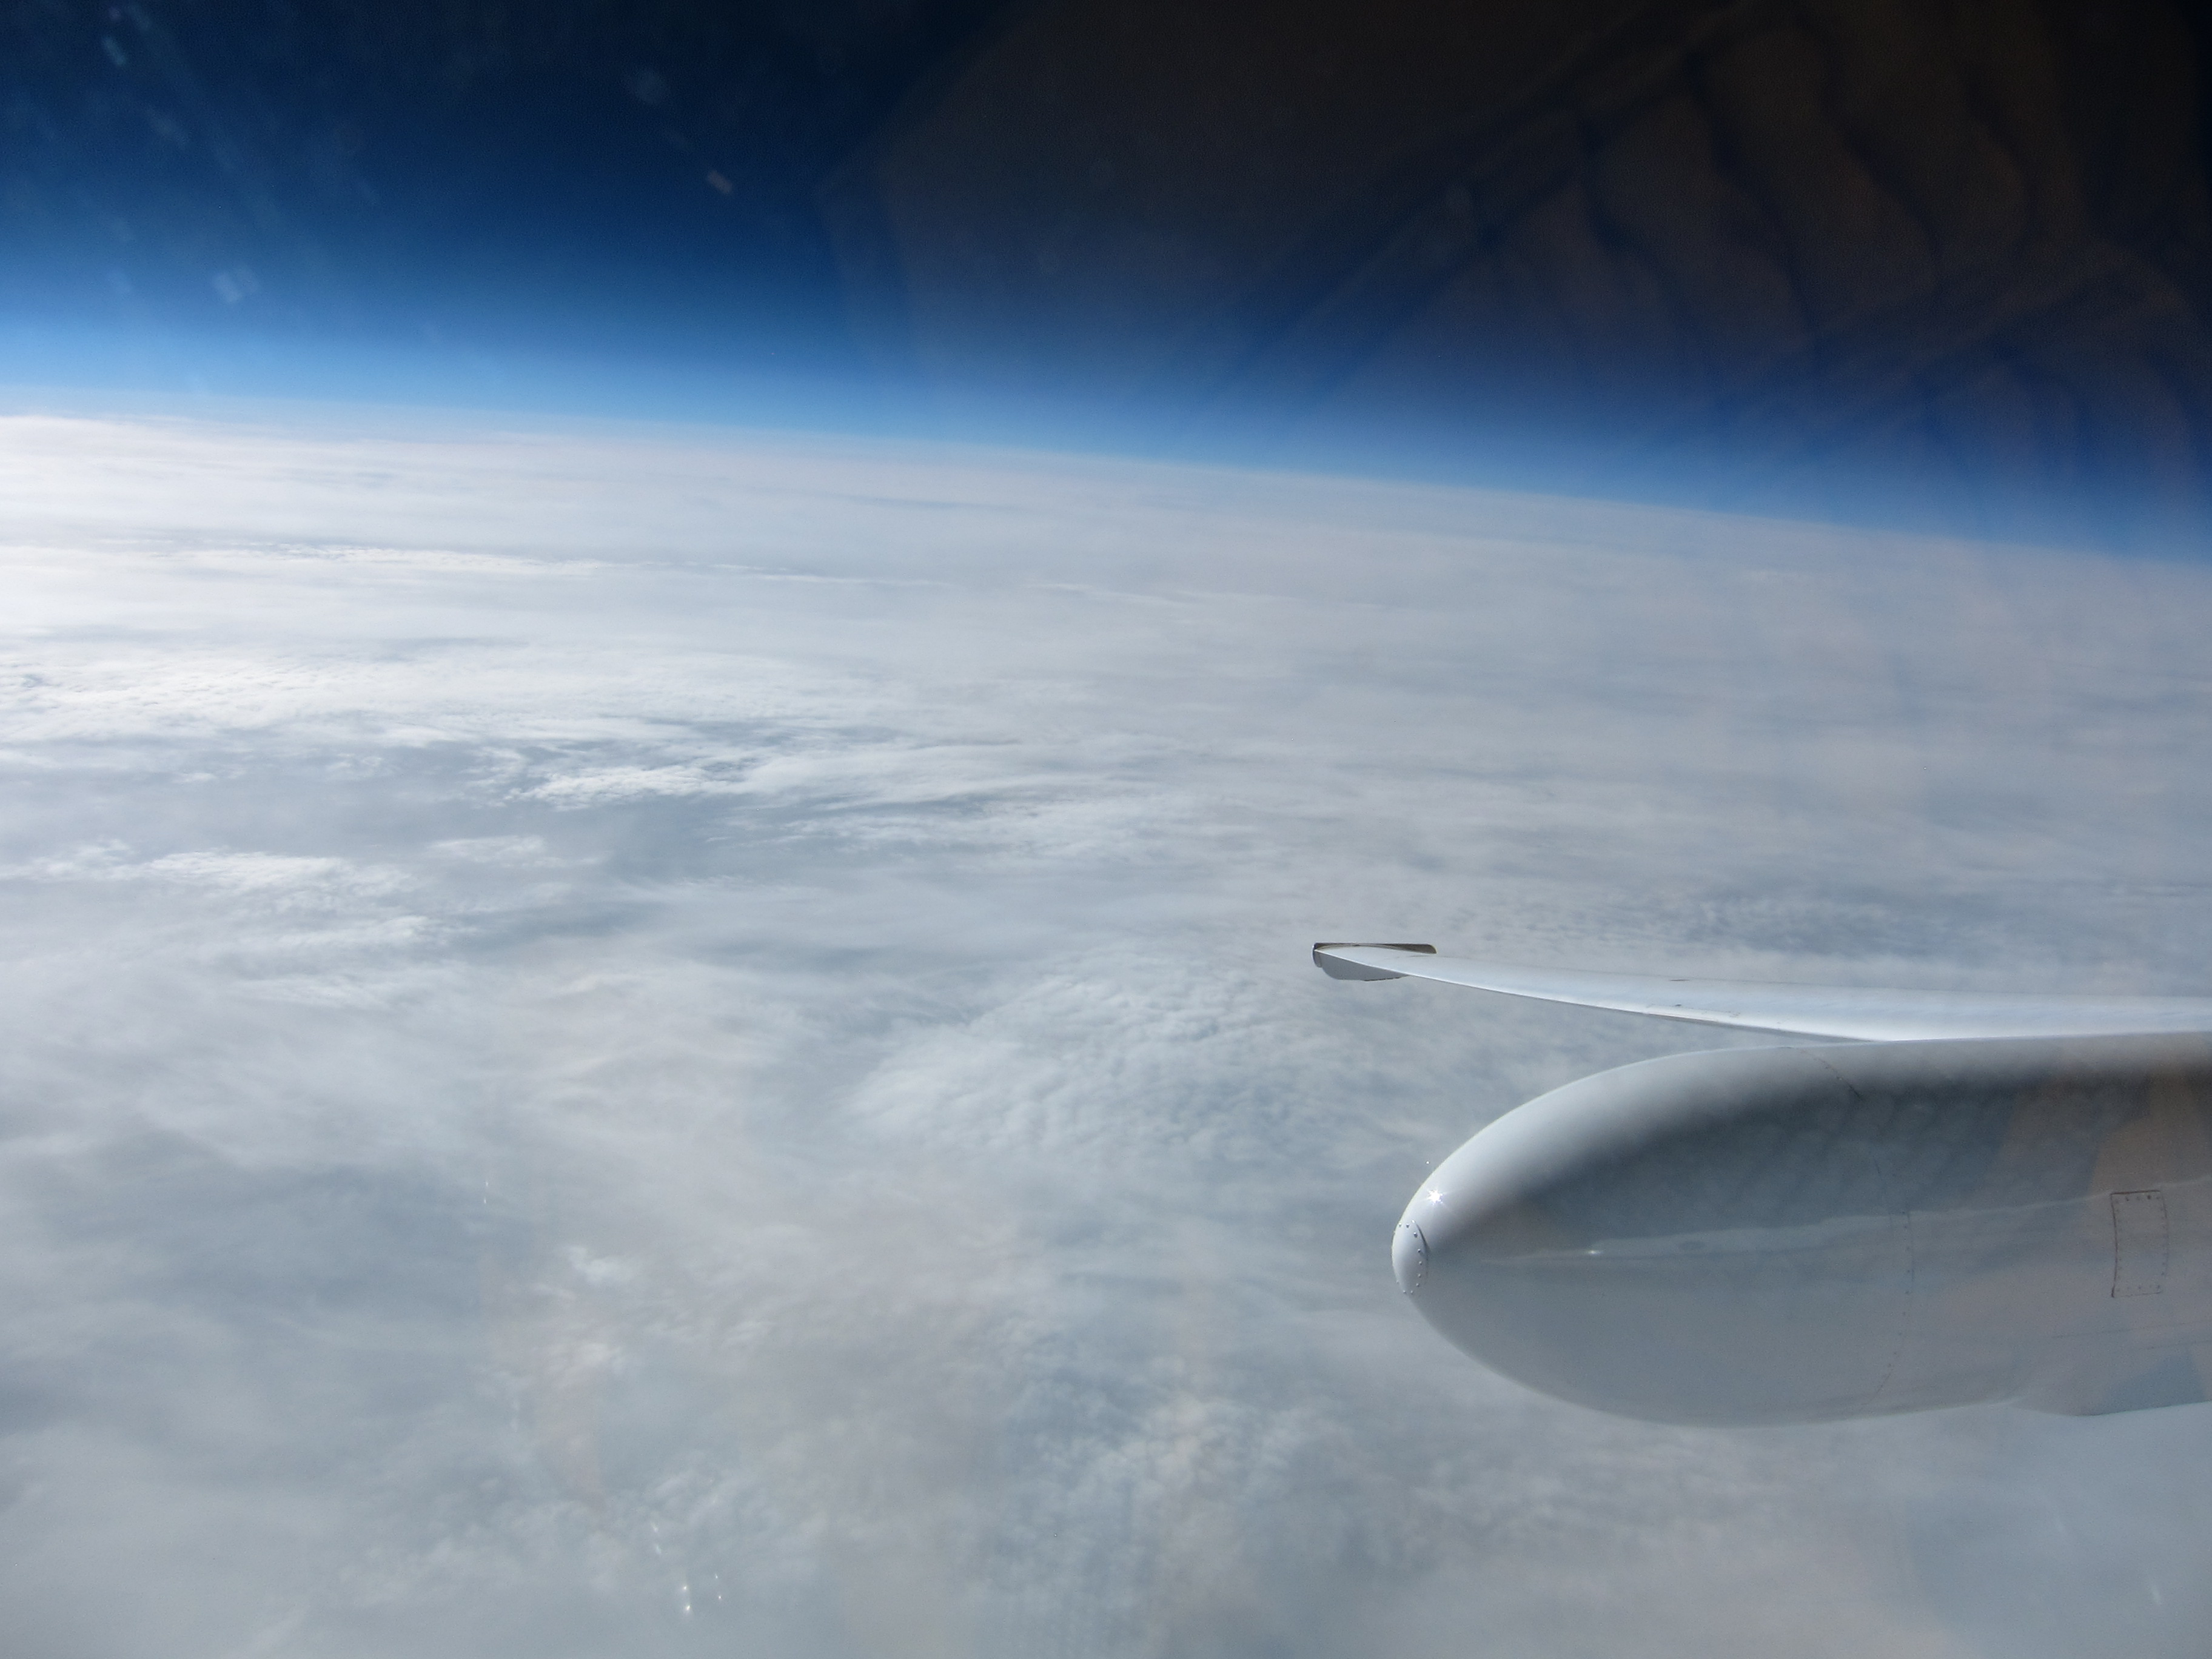
NASA pilot Tim Williams took this picture over the pole, as he was turning to head south . (Credit: Tim Williams/NASA)
The view of Alaska from the cockpit, as the ER-2 returns to Fairbanks. (Credit: Tim Williams/NASA)

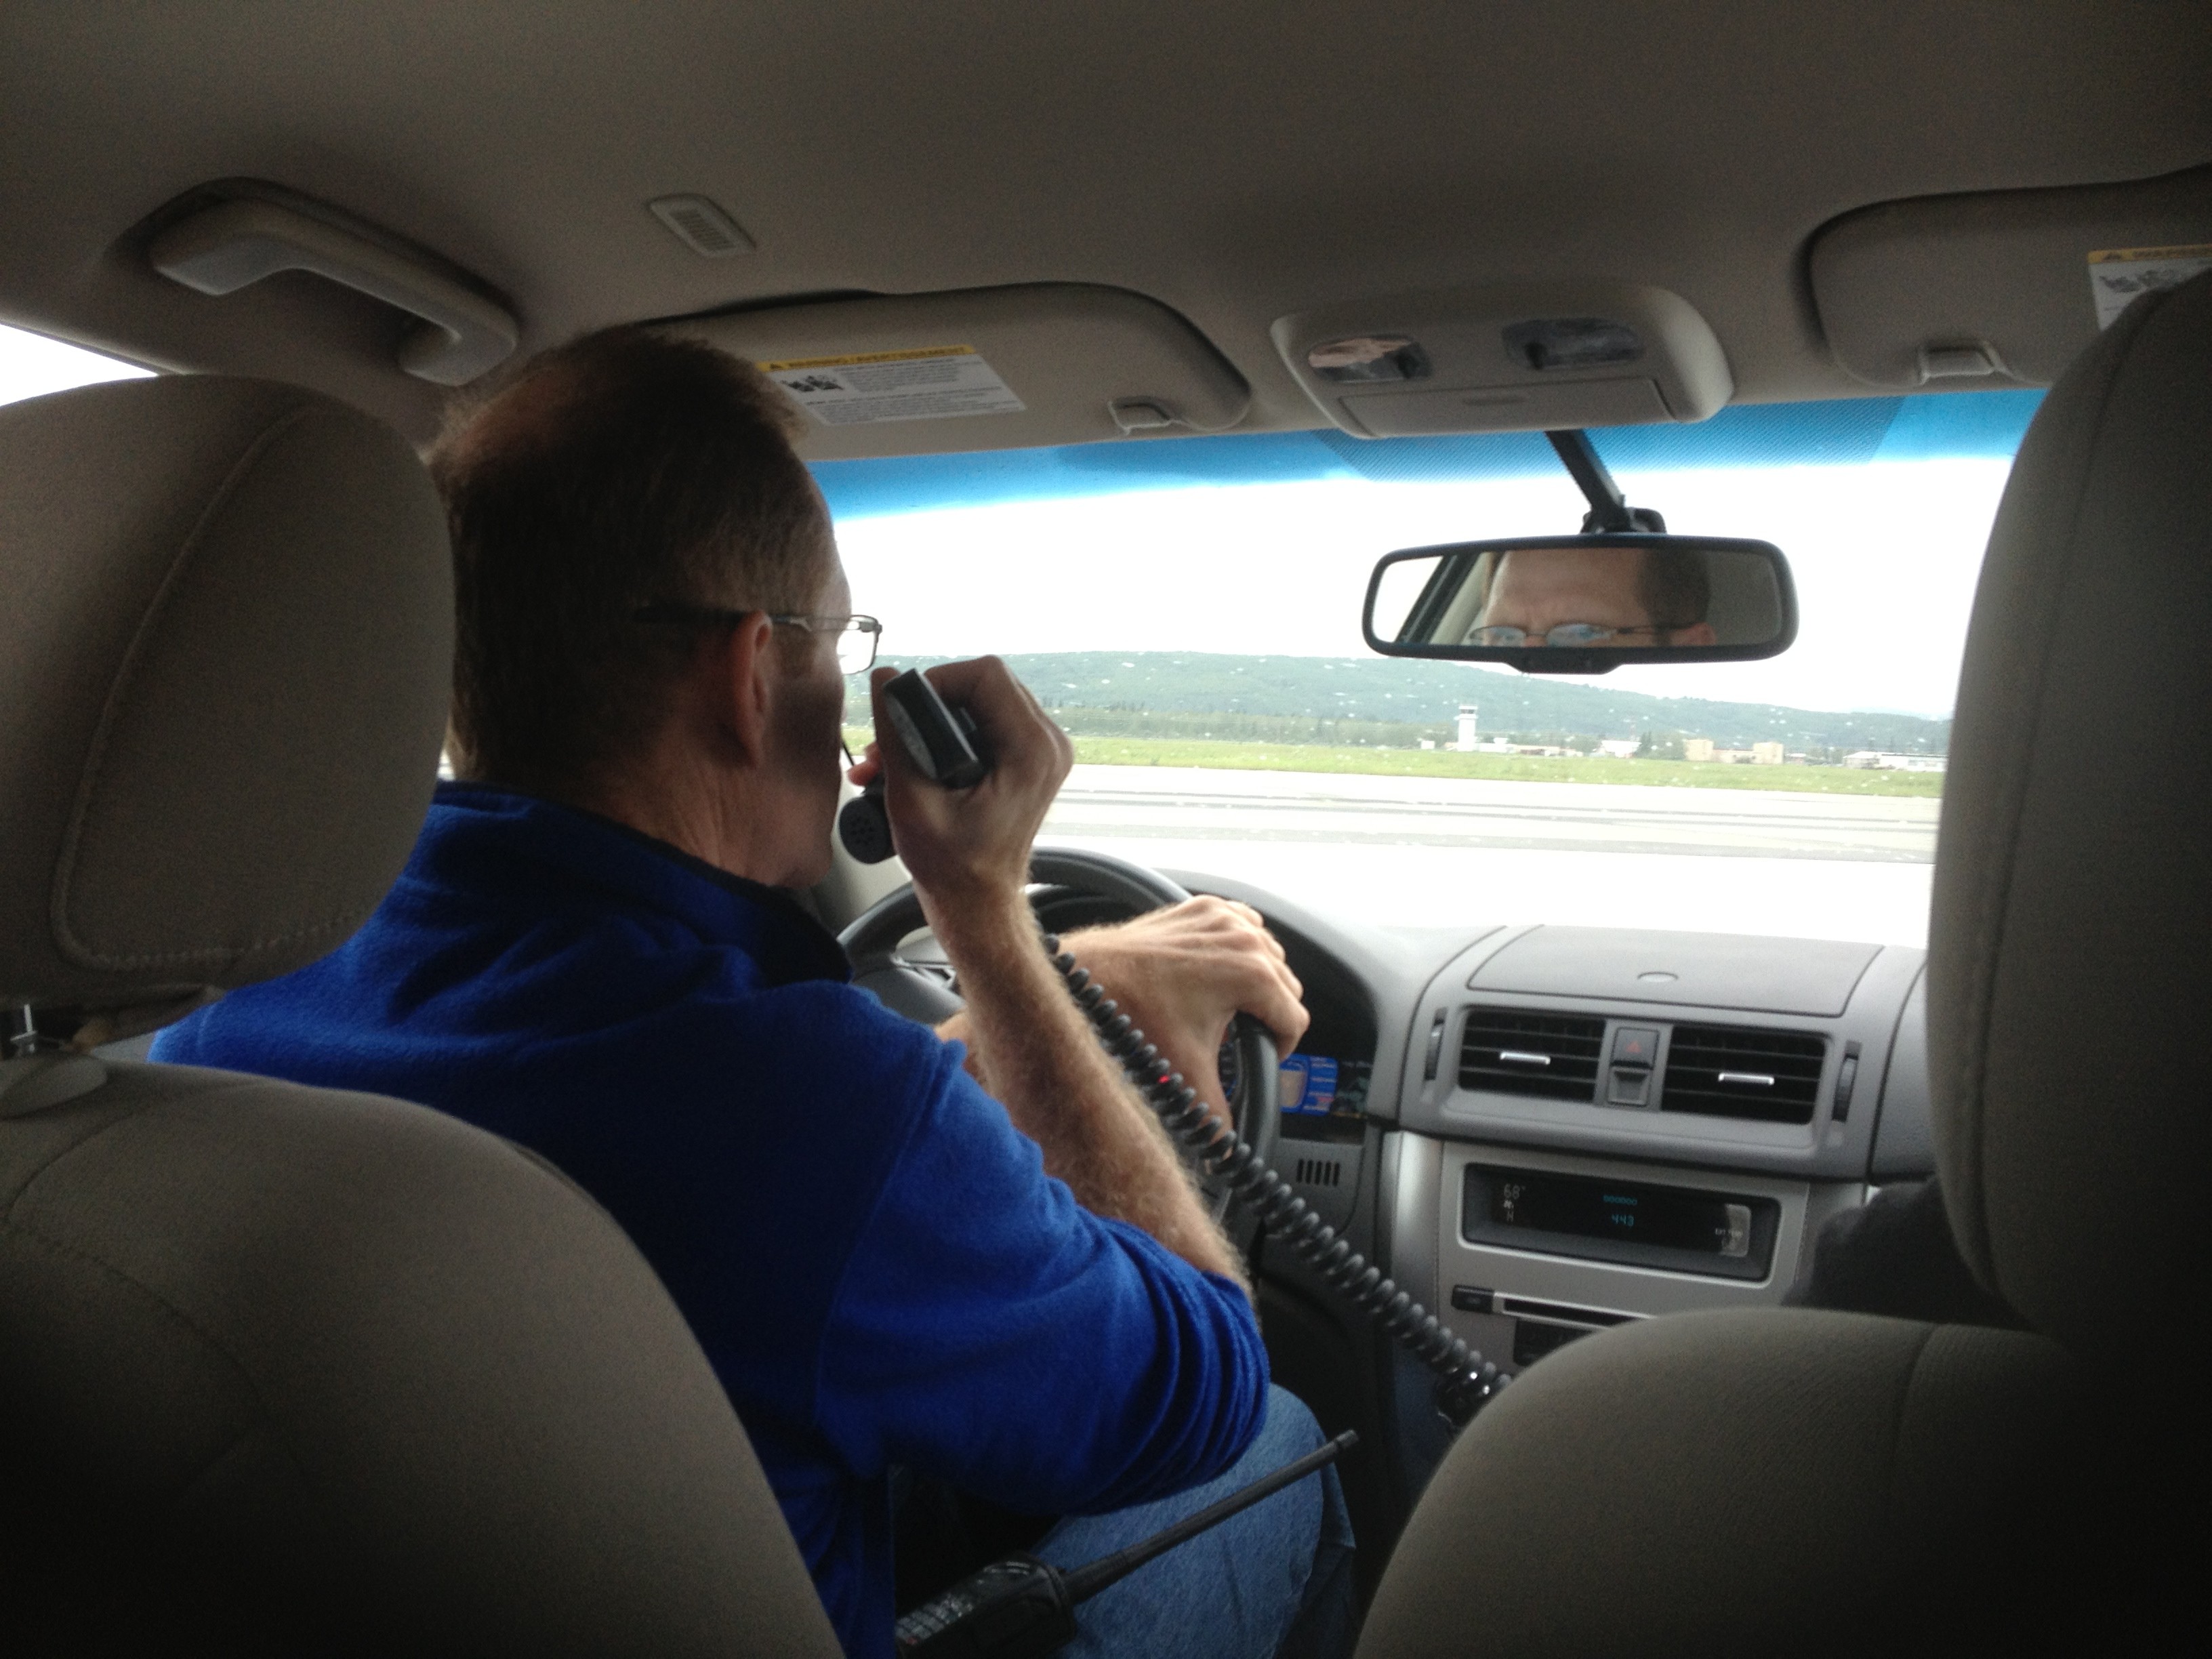
After flying to the North Pole and back, NASA pilot Tim Williams talks with the ER-2 crew about what happens to flight instruments when you reach 90 degrees north. (Credit: Kate Ramsayer/NASA)
Text and photos provided by Doug Morton
NASA’s Goddard Space Flight Center
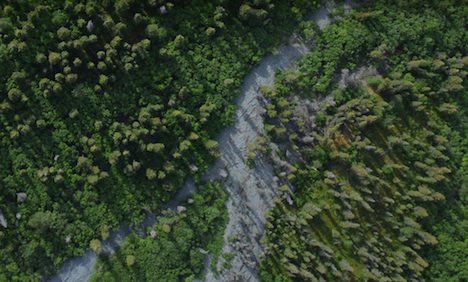
Credit: NASA/Doug Morton
NASA and USDA Forest Service scientists are collaborating on an ambitious project to inventory forest resources in the Tanana Valley of interior Alaska, a region the size of Iowa. The pilot project, funded by the USDA Forest Service Pacific Northwest (PNW) Research Station and NASA’s Carbon Monitoring System (CMS), combines forest inventory plots and airborne remote sensing data from NASA Goddard’s Lidar, Hyperspectral, and Thermal Airborne Imager (G-LiHT). The remote forests of interior Alaska have never been included in national inventories of U.S. forest resources based on the costs and complexity of acquiring field data in remote and difficult terrain.
The partnership between NASA and the Forest Service leverages unique capabilities for airborne remote sensing and ground surveys of forest structure and composition. For NASA, key research questions include the spatial distribution of forest carbon stocks, disturbance and recovery from fire, and data fusion—including the opportunity to characterize forest composition using a combination of lidar, hyperspectral, and thermal data from G-LiHT. G-LiHT data collections will also benchmark conditions across the Tanana Valley, an important part of the research domain for NASA’s Arctic and Boreal Vulnerability Experiment (ABoVE). For the Forest Service, the project will test the tradeoffs between a traditional ground-based surveys of forest resources and a hybrid approach to combine a limited ground sample with extensive coverage using G-LiHT airborne lidar and image data. Both NASA and the Forest Service are interested to track changes in forest cover and composition from wildfires and warming climate in coming decades.
As of July 14, the G-LiHT team had completed 40 percent of the planned flight lines across the Tanana region, totaling 3 TB of raw data and more than 2 billion laser shots fired. The flight crew is currently based out of Tok and Fairbanks, Alaska.
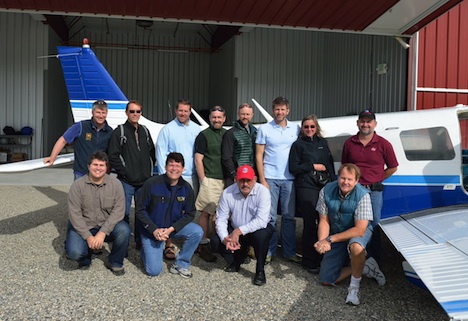
On July 14, 2014, NASA and USFS collaborators in Fairbanks, Alaska, prepare for G-LiHT flights. Top row: Hans Andersen (USFS PI), Tom Wirth (EPA), Grant Domke (USFS), Hobie Perry (USFS), Chris Woodall (USFS), Doug Morton (NASA), Gretchen Nicholas (USFS), Larry Corp (NASA/Sigma Space). Bottom: Matt Fagan (NASA/ORAU), Bruce Cook (NASA), Greg Reams (USFS), Ross Nelson (NASA)

NASA’s ER-2 readies for takeoff. (Credit: Doug Morton/NASA)
I didn’t know a hybrid sedan could take a corner that fast. We were sitting in the car, adjacent to the runway where NASA’s ER-2 high-altitude aircraft was about to land. Tim Williams – an ER-2 pilot who will fly later this campaign – was driving, poised to speed down the runway after the plane, in case his fellow pilot needed help avoiding obstacles and gauging conditions.
And as soon as the sleek ER-2 came into view and descended over the runway, we were off. Williams hit the gas (battery?) on the hybrid and swung onto the runway, sending me and my video camera flailing against the passenger-side door as the aircraft buzzed overhead. We raced down the runway, chasing after the plane as it landed, balanced on its two wheels.
ER-2 pilot Tim Williams watches for the plane to land. (Credit: Valerie Casasanto/NASA)
On board the ER-2 is MABEL – the Multiple Altimeter Beam Experimental Lidar – a laser altimeter that is gathering data for the ICESat-2 mission. Wednesday’s flight was the first science flight of MABEL’s summer campaign to measure summer sea ice, land ice and more in Alaska.
The day started with a crew and weather briefing at 7 a.m., where pilots Denis Steele and Williams reviewed weather conditions and possible routes with ER-2 Mission Manager Tim Moes, NASA Goddard scientists Thorsten Markus and Kelly Brunt, weather forecasters and others.
With cloudy conditions on the way to the North Pole – covering the dynamic melting edge of the sea ice the campaign hopes to document – the team decided to head southeast out of Fairbanks. That route heads down to the Alaska Peninsula to survey volcanoes, then heads east over glaciers and high-elevation ice fields in south central to southeastern Alaska.
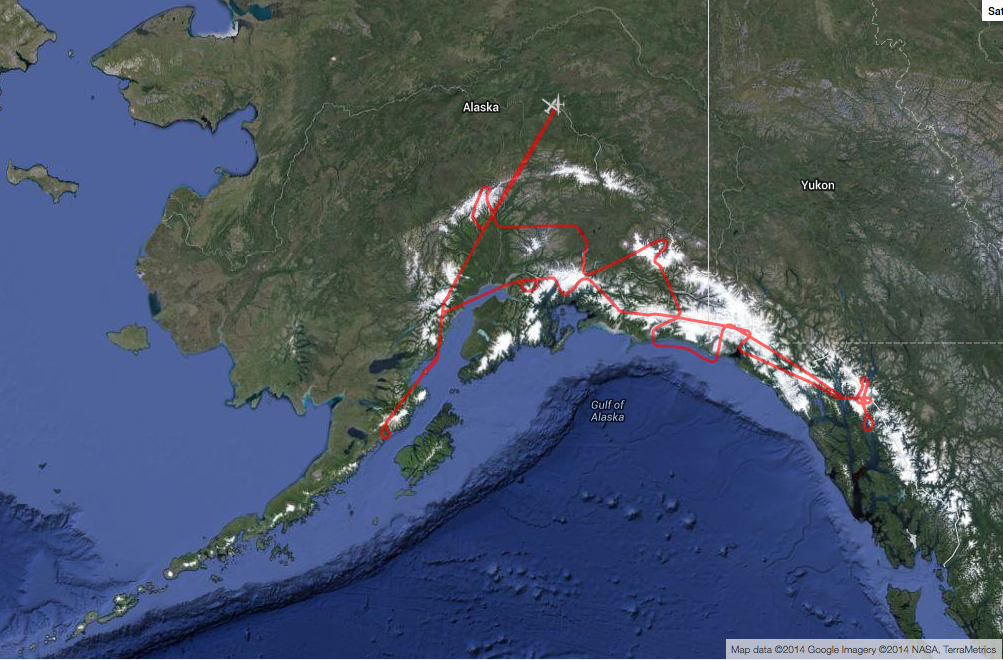
The ER-2, with MABEL on board, flew over volcanoes and glaciers in south central and southeastern Alaska. (http://airbornescience.nasa.gov/tracker/)
With the flight route set, scientists made final checks of the instruments and Steele put on a pressurized suit – necessary for flying at 65,000 feet. He has to “pre-breathe” pure oxygen for an hour before flight, to raise his blood oxygen level.

Ryan Ragsdale, engineering technician, helps ER-2 pilot Denis Steele put on a pressurized suit before the flight, which will take him to 65,000 feet. (Credit: Valerie Casasanto/NASA)
Meanwhile, the plane was slowly towed out of the hangar onto the runway at Fort Wainwright and fueled up. The ER-2 crew and Williams went through the preflight checklist, which would be difficult for Steele as the pressurized suit has big gloves and limited dexterity.

ER-2s Denis Steele, in the cockpit, and Tim Williams, checking notes, get ready for the day’s flight. (Credit: Kate Ramsayer/NASA)
After Steele got in and started the engines, he taxied to the end of the runway accompanied by a maintenance van and a chase car: the van so that the crew could grab the bright orange stabilizing wheels, which fall off during takeoff, and the chase car driven by Williams, who supports Steele as necessary.
The ER-2 takes off amazingly fast. One moment it’s at the end of the runway, the next, the roar of the engine sounds. Then, all of a sudden, the aircraft’s in the air, climbing fast to the clouds. The plane disappeared into the clouds before the sound faded, and then the team went back to check the instruments’ vital signs, transmitted from flight.
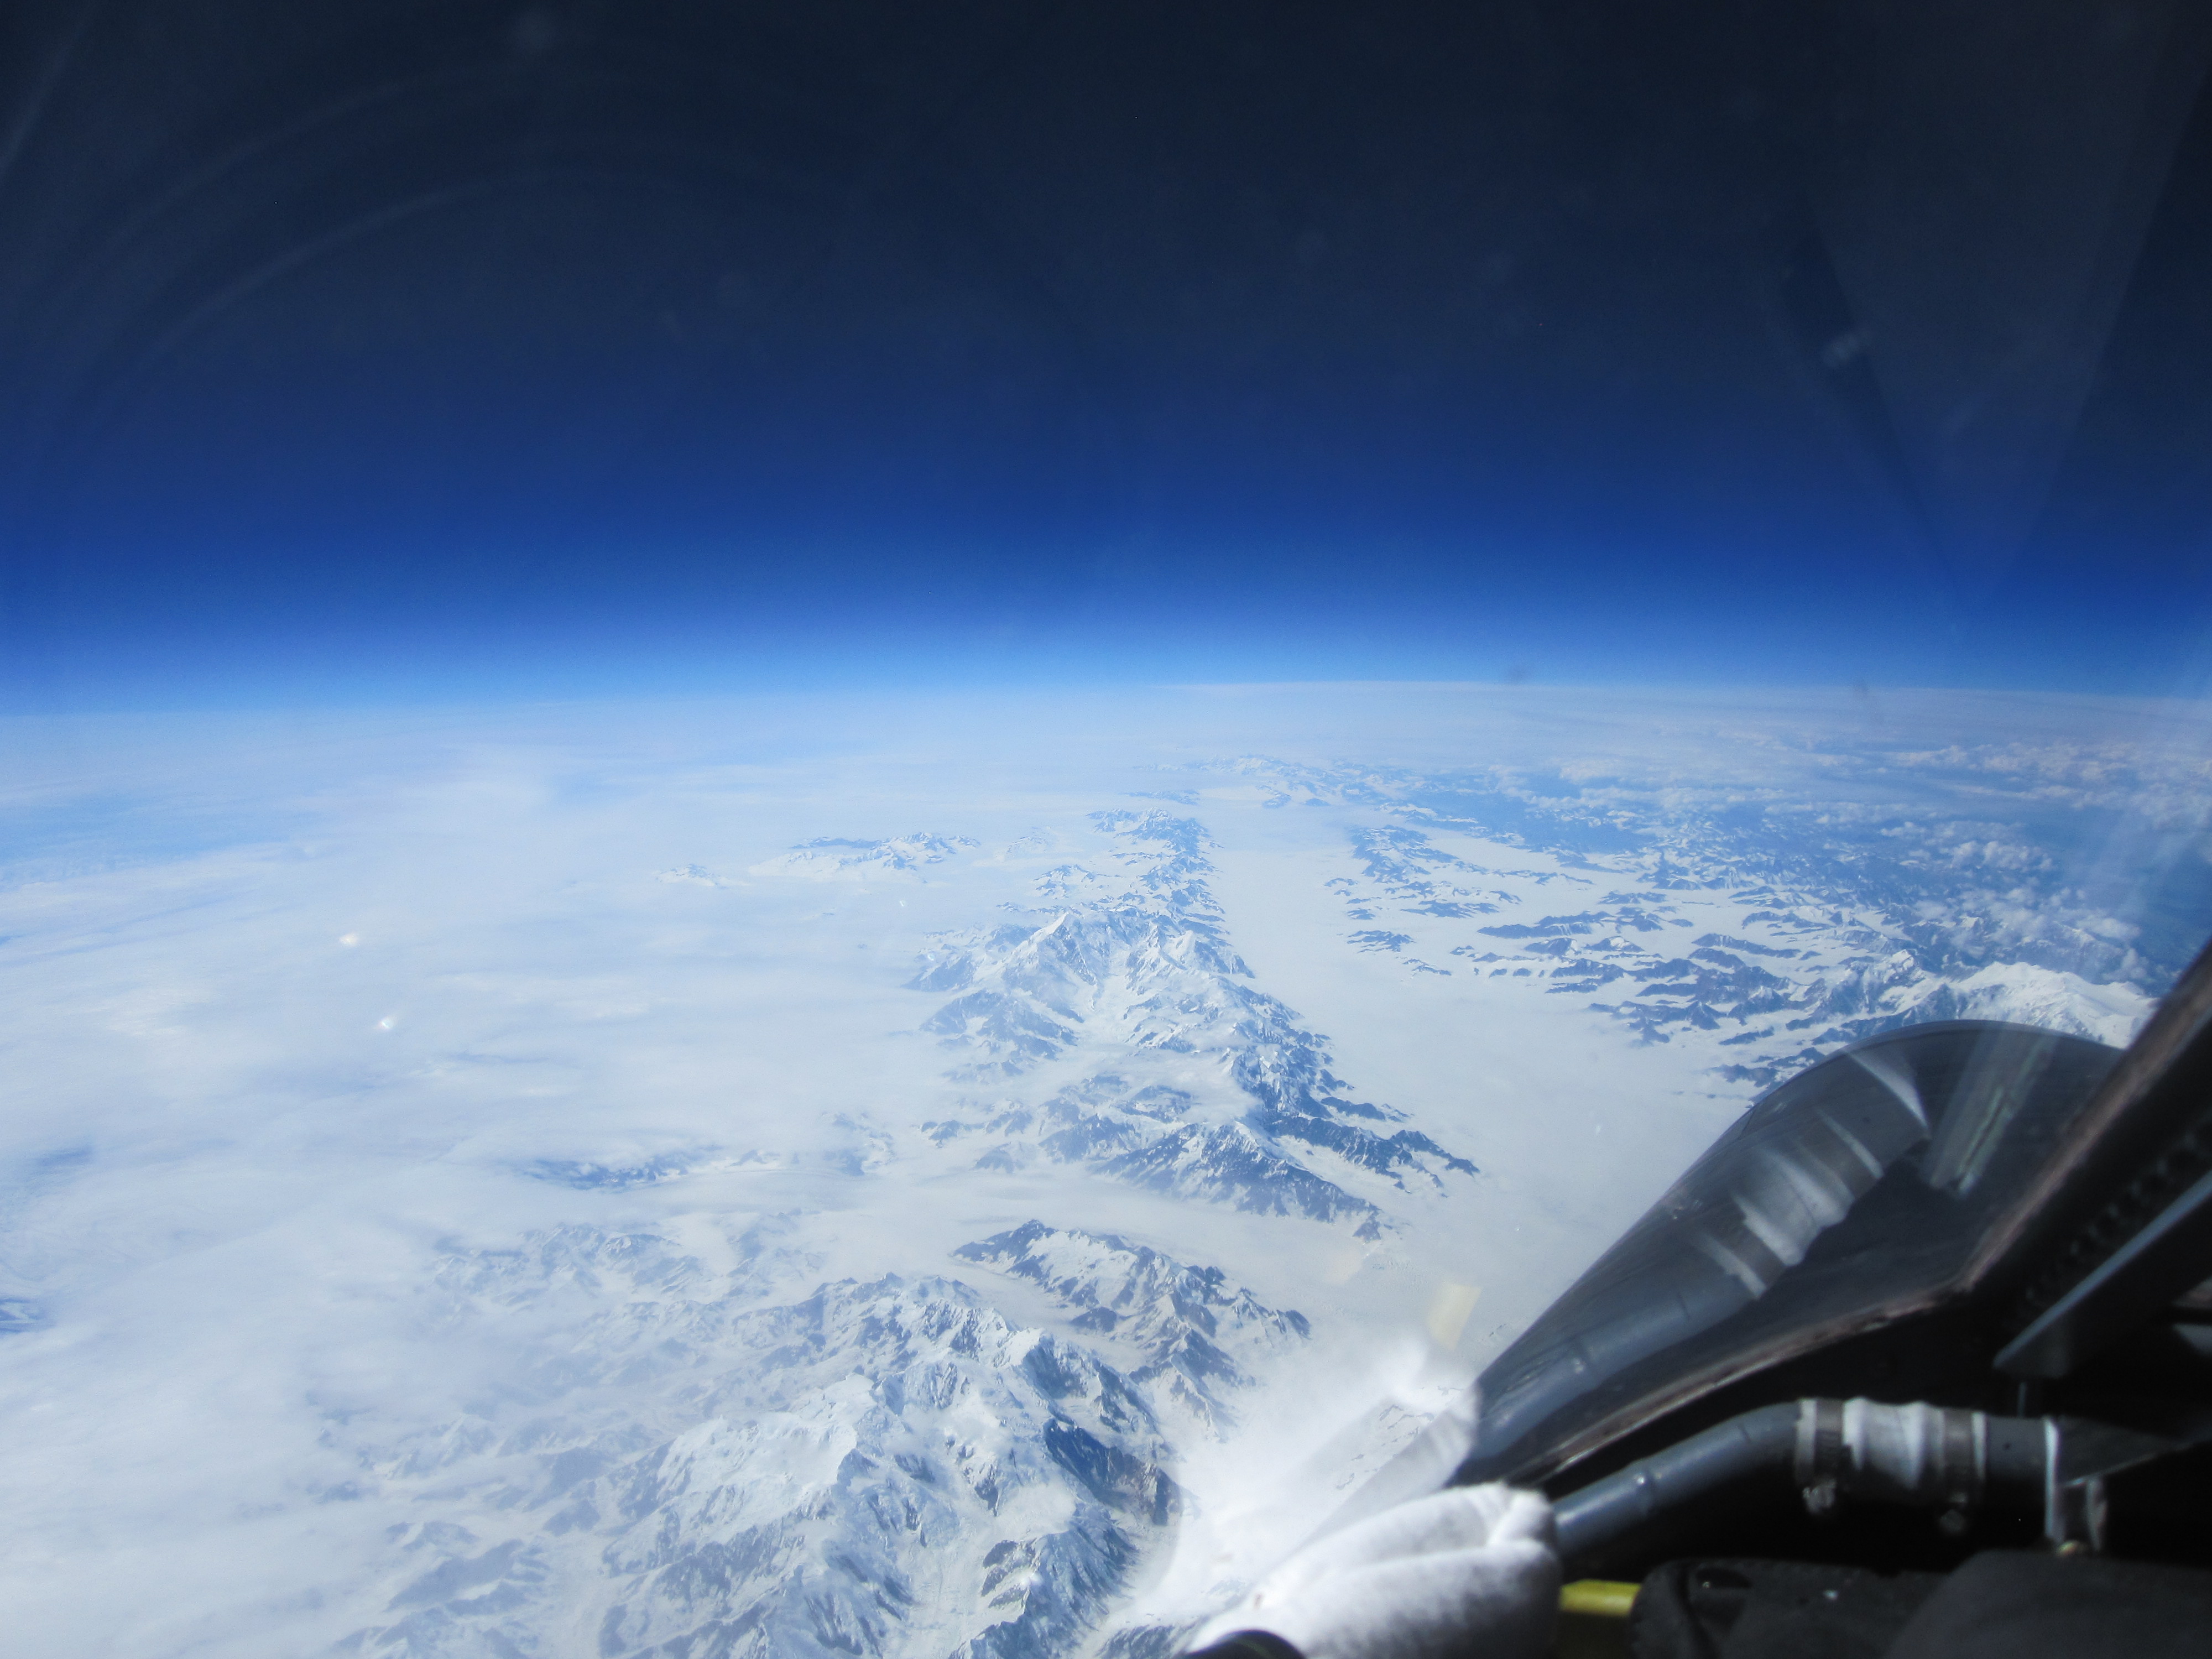
A view of Alaska’s Bagley Ice Field from 65,000 feet. (Credit: Denis Steele/NASA)
Just under seven hours later, after flying over a number of key glacier and volcano points north of the Gulf of Alaska, Steele landed the plane. The crew reattached the bright orange stabilizing wheels, and towed him back to the hangar, where scientists were eager to download and view the data.
Steele reported on highlights of the flight – what was cloudy, what was clear – and Moes ended with a reminder of the next early morning meeting to review weather conditions and determine whether the ER-2 would fly another route over Alaska today.
Starting July 2014, scientists with NASA’s Ship-Aircraft Bio-Optical Research (SABOR) experiment will make observations from ship and aircraft off the U.S. Atlantic Coast aimed at advancing the technology needed to measure microscopic plankton in the ocean from space. For the next three weeks, follow SABOR researchers as they work toward finding out how and why plankton are changing around the planet, and where the carbon associated with plankton goes. Plankton play an important part of the climate system and deliver oxygen to the atmosphere, absorb carbon dioxide, and form the base of the marine food chain.
…
The following post is by Nerissa Fisher
Oregon State University
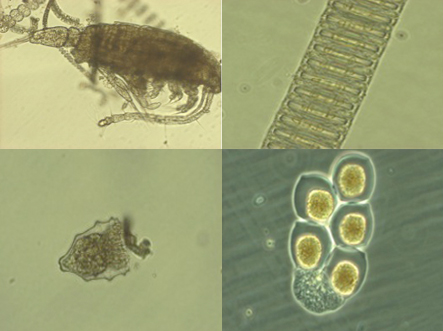
Clockwise from top left: a zooplankton species with a thalssiosira chain in the background; Paralia spp.; a colony of what may be dinoflagellates, and; a ciliate in a protective house — it is most likely that the ciliate ate the phytoplankton that made this outter shell and it now using the shell for protection against zooplankton.
Only three days until the SABOR cruise and I couldn’t be more excited! I have just finished my first year of graduate school in the Microbiology department at Oregon State University where I am pursuing my Master’s degree. I have been on several cruises before, one in the Gulf of Mexico and a couple in Bermuda, but this will be the longest cruise I have ever been on. This is also the first cruise where I have not worked at the research station where the cruise departs, so the entire process of preparing and packing for this cruise that is on the opposite coast has been a much different experience. In past cruises I was not so involved with preparation and my biggest concerns were making sure I had the right clothes and shoes for ship work or the packing list had already been determined and I made sure everything on the list got on the ship. Our research team has had several meetings to discuss the experiments and materials we need to pack. It seems like no matter how far in advance we started packing for this cruise we are still shipping boxes to the east coast. Silly things, like making sure we have beakers to mix solutions in, and all the little knick-knacks that are required for experiments have to be thought of in advance, because once you have left the dock there is no supply closet to run to if materials are missing.
Our research group is measuring how efficiently light energy is converted into phytoplankton biomass. To do this, we are making a number of different measurements simultaneously. Some of these measurements use a state-of-the-art flow cytometer, some use radioisotopes, and some are much simpler and involve filtering seawater and measuring chlorophyll, the pigment that phytoplankton use to absorb light for photosynthesis.
My life in the days leading up to this cruise has been most exhilarating. This past Friday and Saturday were completely booked doing phytoplankton bio-fractionation experiments for my thesis research. I wanted to finish those experiments so that I have data to analyze while on the cruise. Then Sunday, I absolutely HAD to watch the world cup final, which was a fantastic game!! As often as I could pull my attention away from the match, I was also sewing garments that will be used to shade seawater incubation bottles that will allow me to measure primary production at various light intensities.
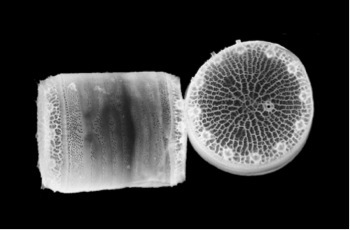
An SEM picture of Thalassiosira pseudonana provided by Alfred Wegener Institute.
Ok, so maybe this doesn’t sound all that exhilarating, but I love phytoplankton ecophysiology, and I could not be more excited to have this opportunity to be at sea for three weeks collecting data that could provide much clearer insights into marine carbon cycling and meet other scientists in the same field. I will have a unique opportunity to apply the measurements I have collected for my research in the laboratory to understand how photosynthetic energy is allocated to different cell compartments, to field samples. This work could potentially be the second chapter of my thesis and broaden my current findings for a single diatom species (Thalassiosira pseudonana, see image above) to natural populations. Without these amazing primary producers of the sea, life on Earth would not exist as we know it and I can’t think of more important work than trying to better understand their physiology, especially in a world that is changing more rapidly than ever before. I am ready to be surrounded by great people, fun, yet exhausting, experiments, and nothing but blue.
