My apologies for the gap between blog posts. My day job has been pretty busy. And even though the NASA folks have already arrived safely to Tahiti as of May 5, 2014, I thought it was fitting to have one last blog post. We have talked a lot about ocean biogeochemical sampling, ocean chemistry, and ocean color radiometry. It is also important to touch on the societal benefits that ocean color radiometry can provide.
In 2007, the International Ocean-Colour Coordinating Group or IOCCG published a report and an additional brochure entitled: “Why Ocean Colour? The Societal Benefits of Ocean-Colour Technology” and “Why Ocean Colour.” I will not go into all of the information detailed in each document here (though feel free to follow the links below at your leisure.)
A number of critical uses for ocean color are of particular importance in today’s society. For instance, detection of high algal biomass can indicate the location of potential fishing zone. Fish that eat algae or fish that eat fish that eat algae (did you get all of that?) will be en masse in these blooms. Inter-annual variation in timing and extent of phytoplankton blooms can also affect the survival of larval fish. Satellite imagery can be used to monitor this variation. Moreover, satellite derived sea surface temperature (SST) and wave height information can help aquaculture developers plan where to establish new fish farms. Satellite imagery can be used to detect and monitor blooms of harmful algae, algae (phytoplankton) that ether produce toxins or can clog the gills of fish and invertebrates because of high biomass.
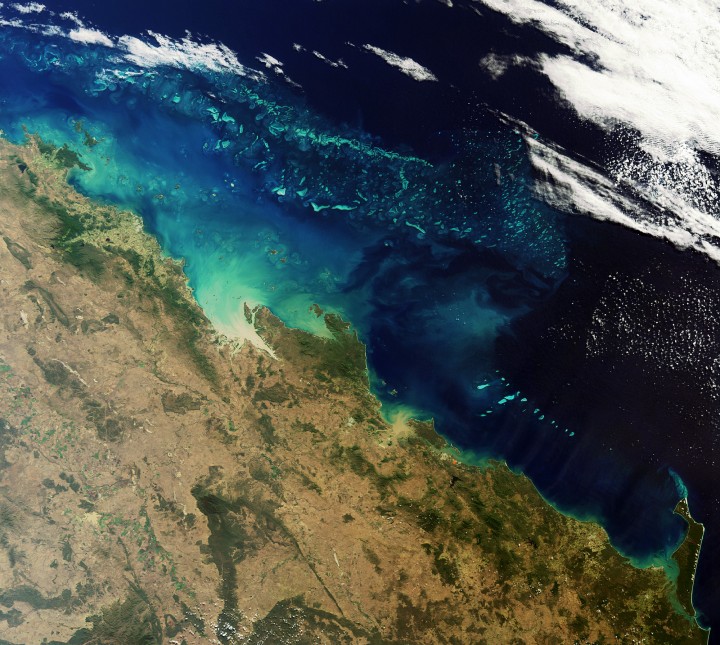
Satellite ocean color imagery is also very important for monitoring delicate ecosystems, particularly in global coastal environments. For example, the European Space Agency (ESA) has developed a program called CoastWatch that helps scientists harness the power of satellite imagery for monitoring water quality in shipping channels and coastal environments. The Medium Resolution Imaging Spectrometer (MERIS) on the Envisat platform (similar to NASA’s MODIS instruments) can be used to monitor sediment deposition onto coral reefs, which can smother the corals. The imagery can also be used to monitor water quality in shipping channels after dredging. Dredging can increase suspended sediments and negatively affect water quality.

MERIS image: sediments flowing onto the Great Barrier reef in Australia
http://www.esa.int/Our_Activities/Observing_the_Earth/ESA_s_sharp_eyes_on_coastal_waters
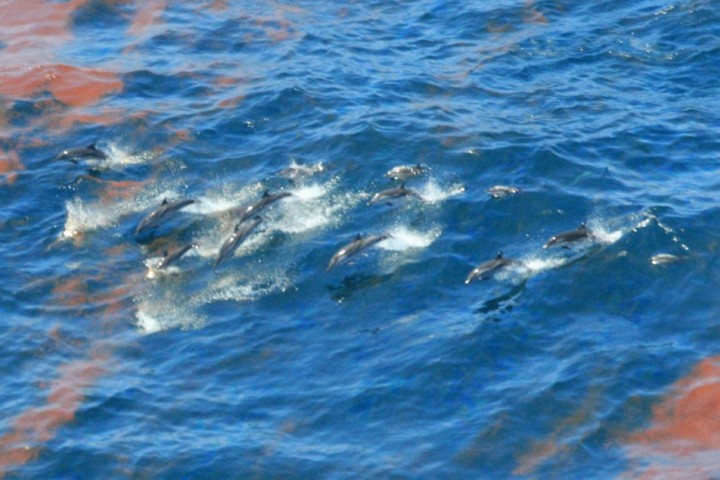
Let’s consider a recent ecological disaster: the Deepwater Horizon oil spill. The Deepwater Horizon oil spill has been called the ‘worst oil spill in U.S. history’. The oil spill resulted from an oil platform explosion that occurred on April 20, 2010, and leaked an estimated 4.9 million barrels of oil by the time it was capped on July 15, 2010. This type of disaster can have long-term impacts on coastal wildlife and fisheries. Immediately following the spill, fishing areas around the Gulf Coast were closed to prevent human exposure to dangerous chemicals, polycyclic aromatic hydrocarbons, found in the oil. These chemicals are known to cause cancer. The fisheries were deemed safe and reopened on April 19, 2011.

Dolphins swimming through the oil patches from the Deepwater Horizon spill
http://ocean.si.edu/gulf-oil-spill
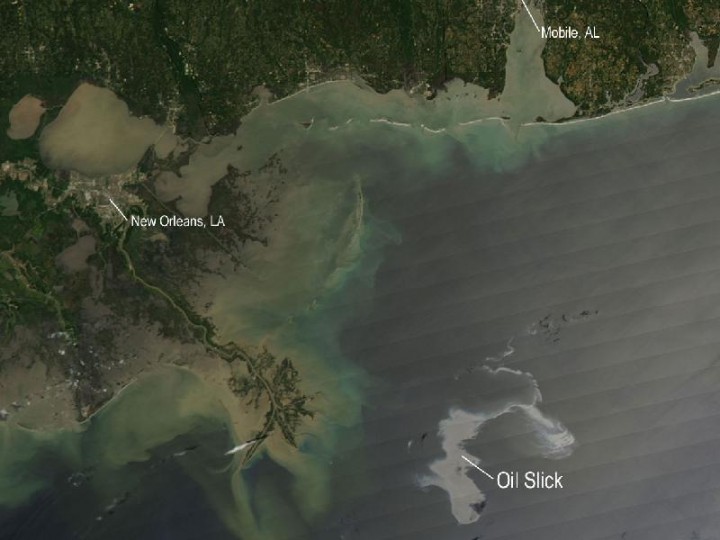
Satellite ocean color imagery can be used to locate and monitor oil spills of this magnitude. Although this type of imagery is complex, the technology is a great asset. The video below, developed by video producers here at NASA Goddard, shows a timeline of NASA MODIS satellite images. Such imagery allowed scientists to follow the track of the oil slicks. These images can help us prepare for the impact of these disasters when we know where it is headed next. You can find satellite images of the oil spill here.

Satellite image of oil slick in the Gulf of Mexico following the sinking of the Deepwater Horizon platform
http://www.nasa.gov/multimedia/imagegallery/image_feature_1649.html
We have truly enjoyed sharing our experiences with all the blog readers. I hope we can do this again very soon. Until next time, make sure you check out all of the NASA field campaigns here at the Earth Observatory website.
http://www.ioccg.org/reports/report7.pdf
http://www.ioccg.org/reports/WOC_brochure.pdf
http://www.esa.int/Our_Activities/Observing_the_Earth/ESA_s_sharp_eyes_on_coastal_waters
http://www.esa.int/Our_Activities/Observing_the_Earth/New_ESA_project_supports_aquaculture
http://ocean.si.edu/gulf-oil-spill
http://www.nasa.gov/topics/earth/features/oil-spill-video.html
http://www.nasa.gov/topics/earth/features/oilspill/index.html
http://oceanservice.noaa.gov/hazards/hab/
Tags: field sampling, NASA, ocean color, oceanography, optics, phytoplankton


Great summary of why Ocean Color measurement are so vital. I’d like to know more about the South Pacific Bio-Optics Cruise 2014. ie. such as what instruments you had in the IOP package (and what you wish you could measure in situ). Also curious practically speaking, what a small airborne UAV or underwater AUV could lend to an ocean color measurements at sea.