
One of the greatest tools used by oceanographers today for measuring ocean processes is the CTD. CTD stands for Conductivity, Temperature and Depth. Conductivity is a measure of ocean salinity. The CTD is used to collect profile data in the ocean. The CTD is typically accompanied by a carousel, or rosette, of large bottles (Niskins) that can hold about 10 liters (2.6 U.S. gallons) of water. Some Niskins are large enough to hold 30 liters. These bottles have spring-loaded caps that can be triggered to close at specified depths. The CTD and other sensors, such as a chlorophyll fluorometer, and an Acoustic Doppler Current Profiler (ADCP) that measures current velocities, and other sensors can also be attached within the rosette package.
The whole package is connected to a very long cable and is mechanically lowered by a winch operator down through the water column, which is called the ‘downcast.’ During the downcast, information about salinity, temperature, depth and data from the other sensors are sent to a computer on board the ship. The computer is connected through the cable that is lowering the package. The downcast is halted once the package reaches close to the ocean floor. When the CTD is raised back to the surface, the ‘upcast’, each of the Niskin bottles is closed at assigned depths, collecting water as it travels back to the surface.
Once the Rosette package is back aboard the ship, the scientists are able to collect water from the bottles for their analyses. The parameters collected and analyzed during CLIVAR campaigns includes but are not limited to: salinity, oxygen, nutrients, chlorofluorocarbons (CFCs), dissolved inorganic carbon (DIC), total alkalinity, pH, dissolved organic carbon (DOC), helium, and tritium.
Certain compounds, such as some radionuclide (tritium, carbon-14, etc.) and CFCs, can be used as ‘tracers’. These tracers are used to follow ocean currents and calculate the age of water parcels. CFCs were prominently used in refrigerators and air conditioning units until the 1970s when they were banned over the concern of ozone depletion. You can learn more about the CFC tracer program here. Through the WOCE and CLIVAR programs CFC concentrations have been measured all over the world.
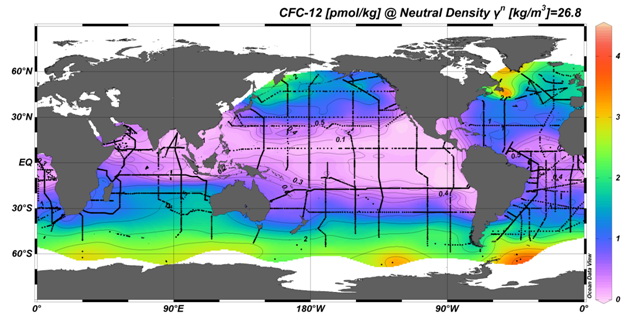
Map of global CFC measurements
http://www.pmel.noaa.gov/cfc/
The measurement of pH, total alkalinity and DIC are important for monitoring ocean acidification. Ocean acidification (OA) is the decrease in ocean pH as a result of an increase in carbon dioxide (CO2) absorption by seawater. OA is a prominent concern in today’s world. CO2 is pumped into the atmosphere from everyday human activities, such as emissions from vehicles and industrial pollution. Each year approximately 25% of the CO2 pumped into the atmosphere is absorbed by the ocean. Although plants can use CO2 for photosynthesis, the increase also has negative implications. As the amount of CO2 absorbed by the increases, the pH is expected to continue decreasing.
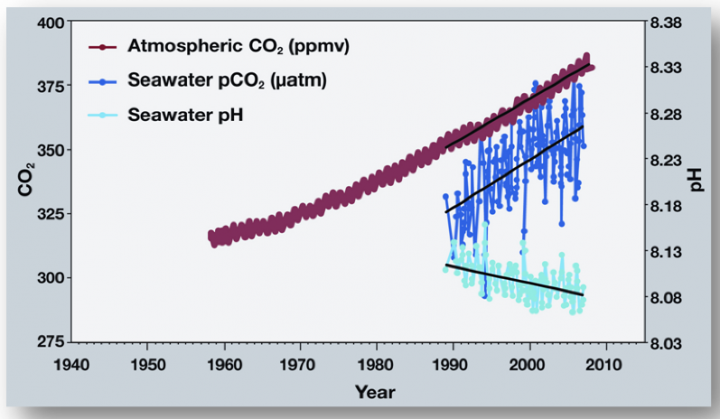
pH time series
http://www.pmel.noaa.gov/co2/story/OA+Observations+and+Data
The pH of the ocean directly affects organisms that form calcium carbonate shells or structures, like corals, oysters, clams and sea urchins. An acidic environment causes the calcium carbonate to dissolve and makes it more difficult for the organisms to make their calcium carbonate skeletons. Therefore, it is important that programs like CLIVAR are monitoring global CO2 concentrations (part of the DIC pool), total alkalinity (the ability for the ocean to neutralize acids) and pH. We know that decreases in ocean pH can negatively impact marine organisms. You can see more about the effect of ocean acidification or marine organisms here.
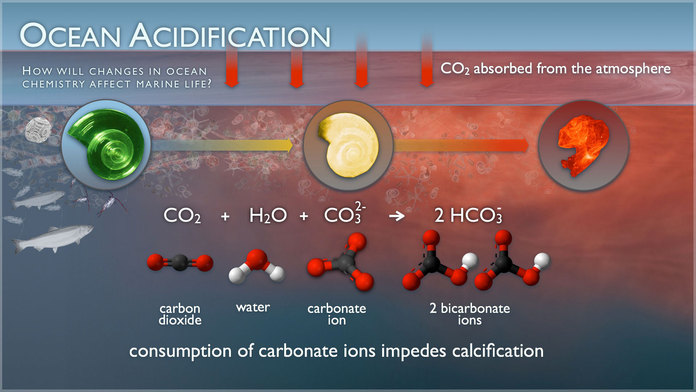
Ocean Acidification
http://www.pmel.noaa.gov/co2/story/What+is+Ocean+Acidification%3F
As I was conducting some research for this blog post I came across this article that was posted at the Earth Observatory in 2008 about the global carbon budget. I thought it was appropriate to bring it back here.
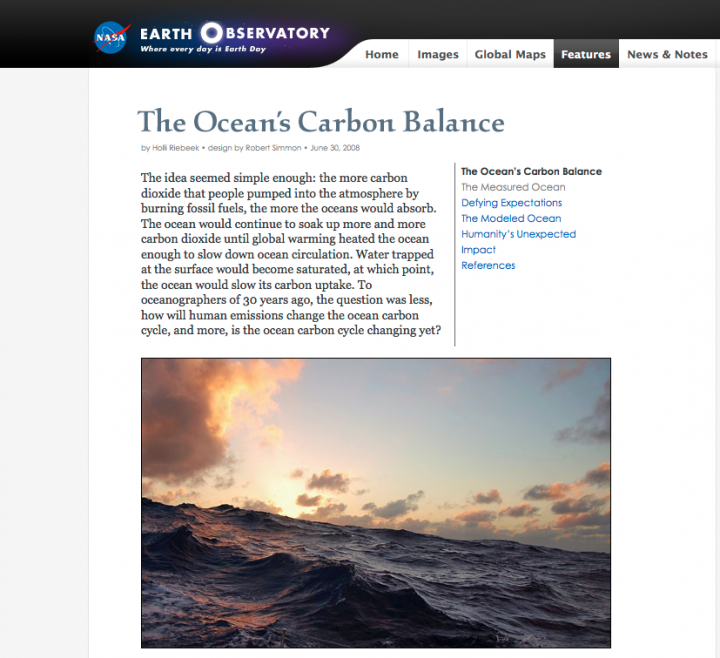
Earth Observatory article from 2008
References:
http://www.whoi.edu/home/oceanus_images/ries/calcification.html
http://www.pmel.noaa.gov/co2/story/What+is+Ocean+Acidification%3F
http://water.me.vccs.edu/exam_prep/alkalinity.html
http://earthobservatory.nasa.gov/Features/OceanCarbon/
http://rspb.royalsocietypublishing.org/content/275/1644/1767.full
ACKNOWLEDGEMENTS: NASA’s Ocean Ecology Laboratory Field Support Group is participating in the US Repeat Hydrography, P16S field campaign under the auspices of the International Global Ocean Ship-Based Hydrographic Investigations Program (GO-SHIP). The US Climate Variability and Predictability Program (CLIVAR), NOAA and the NSF sponsor this campaign.

Tags: carbon, Clivar, field sampling, Go-SHIP, NASA, ocean color, oceanography, optics, phytoplankton, radiometry, South Pacific