
Editor’s Note: This guest post was written by David Wolfe, a remote sensing specialist working with the Global Land Ice Measurements from Space (GLIMS) project, and Jeffrey Kargel, a professor at the University of Arizona and the GLIMS project coordinator. Wolfe wrote his thesis for Alaska Pacific University about glacier-dammed lakes in Alaska and recently authored a book chapter on the same topic. Gregory Leonard, Michael Abrams, and Adam Voiland also contributed information for this post.
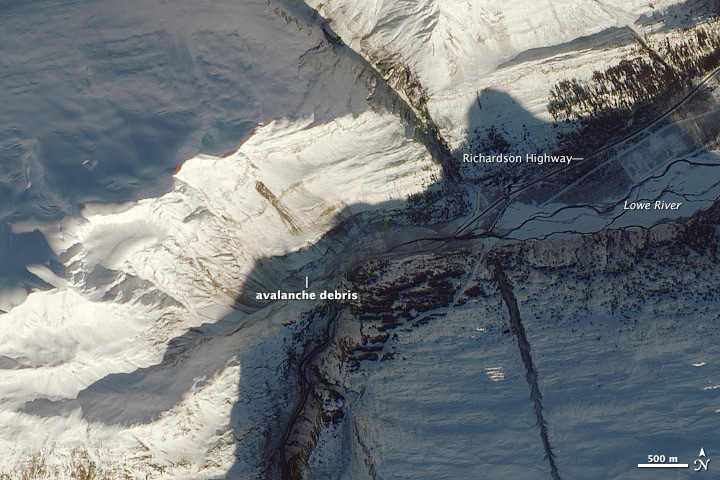
The Advanced Land Imager (ALI) on the Earth Observing-1 satellite captured this scene of an avalanche in Keystone Canyon on January 31, 2014. Notice how debris has obscured sections of both the Richardson Highway and the Lowe River. Image by NASA Earth Observatory.
On January 24, 2014, an exceptionally large avalanche closed the Richardson Highway (Alaska Route 4), the only land link between the ice-free oil port of Valdez and the rest of Alaska. The avalanche was classified as a size 5, the largest category, though no one was hurt. The avalanche impounded the Lowe River, forming a lake. The lake drained within days of its formation, without an outburst flood, due in part to a 100 year-old abandoned railroad tunnel that shunted water around the dam. On February 5, 2014, officials reopen the road.
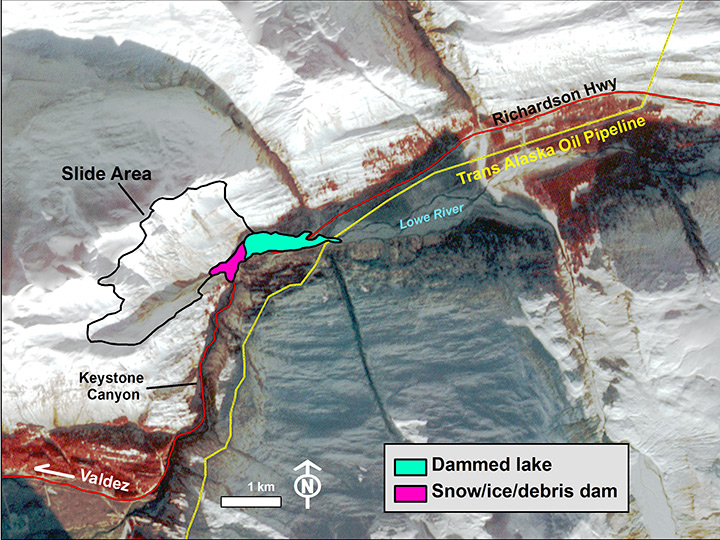
The Advanced Spaceborne Thermal Emission and Reflection Radiometer (ASTER) obtained the image below, on January 29, 2014, upon request by the Global Land Ice Measurements from Space (GLIMS) consortium. The image is an oblique rendering of part of the ASTER image draped over the GDEM2, a global topographic shaded relief map that was produced from a dozen years worth of ASTER images. It is a standard false-color image taken in visible and near infrared wavelengths. Vegetation appears red; snow is white. If clean, water appears black; if slightly sediment laden, it is blue.
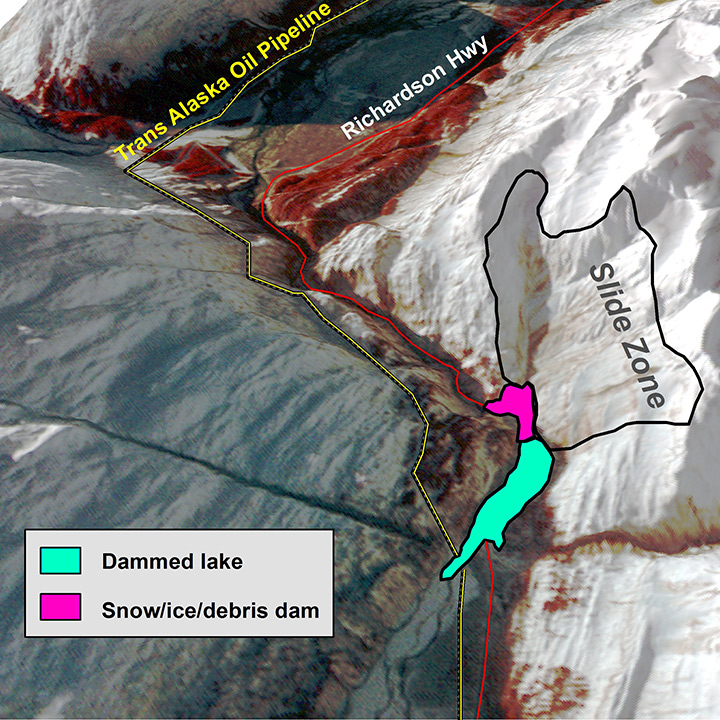
Perspective rendering of an ASTER image on a shaded relief map, showing the location of the avalanche and impoundment lake relative to a portion of the Trans-Alaska Pipeline System and Richardson Highway. The image was acquired on January 29, 2014. Image by Gregory Leonard and Michael Abrams.
The ASTER image above shows the outlines of the avalanche source, the avalanche deposit, the maximum extent of the impoundment lake, and the routes of the Richardson Highway and the Trans Alaska Pipeline System (TAPS). The lake had partially drained when the image was acquired. At maximum extent, the lake apparently barely overlapped part of the route of the pipeline, but in this sector the pipeline is buried and was thus safe. Although the greater potential pipeline disaster was averted, the closure of the highway has been a significant inconvenience for many people in and near Valdez. Ferries into and out of Valdez were increased to assist stranded residents, and roadway commerce as far as Fairbanks must have been affected by the disruptions to the Richardson Highway.
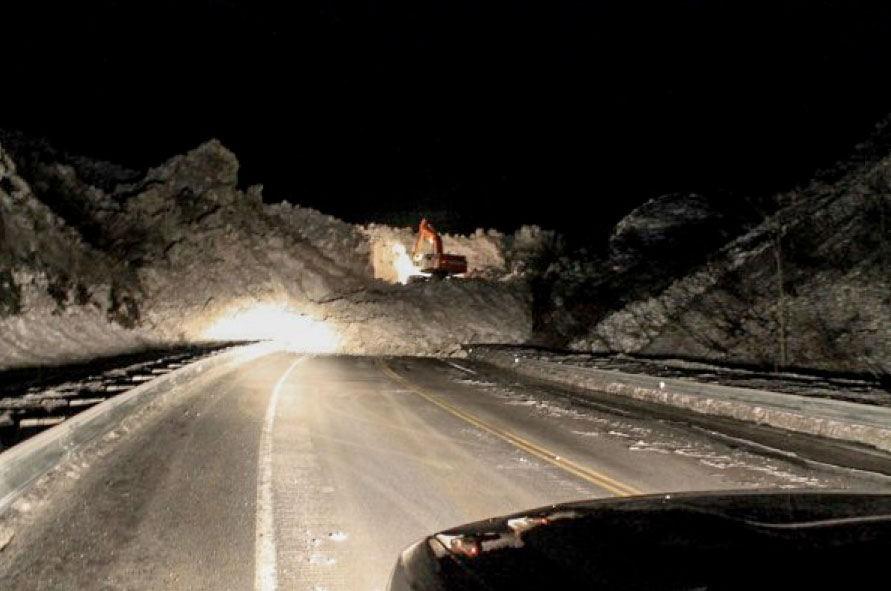
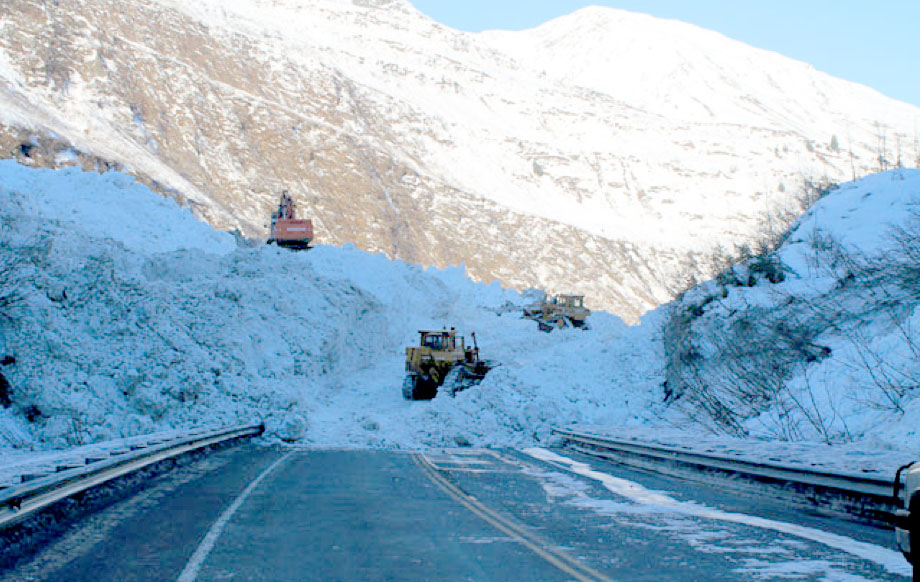
Crews from the Alaska Department of Transportation and Public Facilities (ADOT&PF) mobilized equipment on the south side of the road closure Thursday evening, January 30, 2014, and began 24-hour snow removal operations early Friday. The top photo shows a Hitachi 450 excavator, providing a scale that shows the avalanche to be 40 feet (12 meters) thick at this location. The next photo, just above, shows a daytime view of the night-and-day operations to reopen the highway. Elsewhere, reports have the avalanche approaching 100 feet (30 meters) thick. Photos courtesy of Robert Dunning and staff, Alaska DOT&PF, reproduced by permission.
The 1.35 square mile (3.5 square kilometer) source of the avalanche was estimated from the ASTER and ALI images and from news broadcast video taken from a helicopter by ADOT&PF, Alyeska Pipeline Service Co., the Anchorage Daily News, and Alaska Dispatch staff. The huge avalanche and 0.135 square mile (88-acre, 0.35 square kilometer) impoundment lake reminds us of the remarkable engineering of the Alaskan pipeline (below). The pipeline faces many natural hazards, including earthquakes, landslides, floods, forest fires, avalanches, glacier lake outburst floods, and thawing permafrost. In 2002, it survived the magnitude 7.9 Denali earthquake without rupture—though just barely. Several key design tolerances were closely approached or exceeded, according to a report published in Earthquake Spectra. That earthquake and the 2014 avalanche did not cause a disaster because of the pipeline’s careful engineering, including the use of many novel technologies and special routing. Just about 1.9 miles (3 kilometers) upstream of the Lowe River crossing, the highway and pipeline traverses a creek that has been inundated by periodic outburst floods, some destructive, from a series of glacier-dammed lakes high in the mountains. TAPS was routed underground through the flood impact zone and over the Chugach Mountains. The specific routing averted the extent of the avalanche and lake with no room to spare, suggesting an element of good luck.
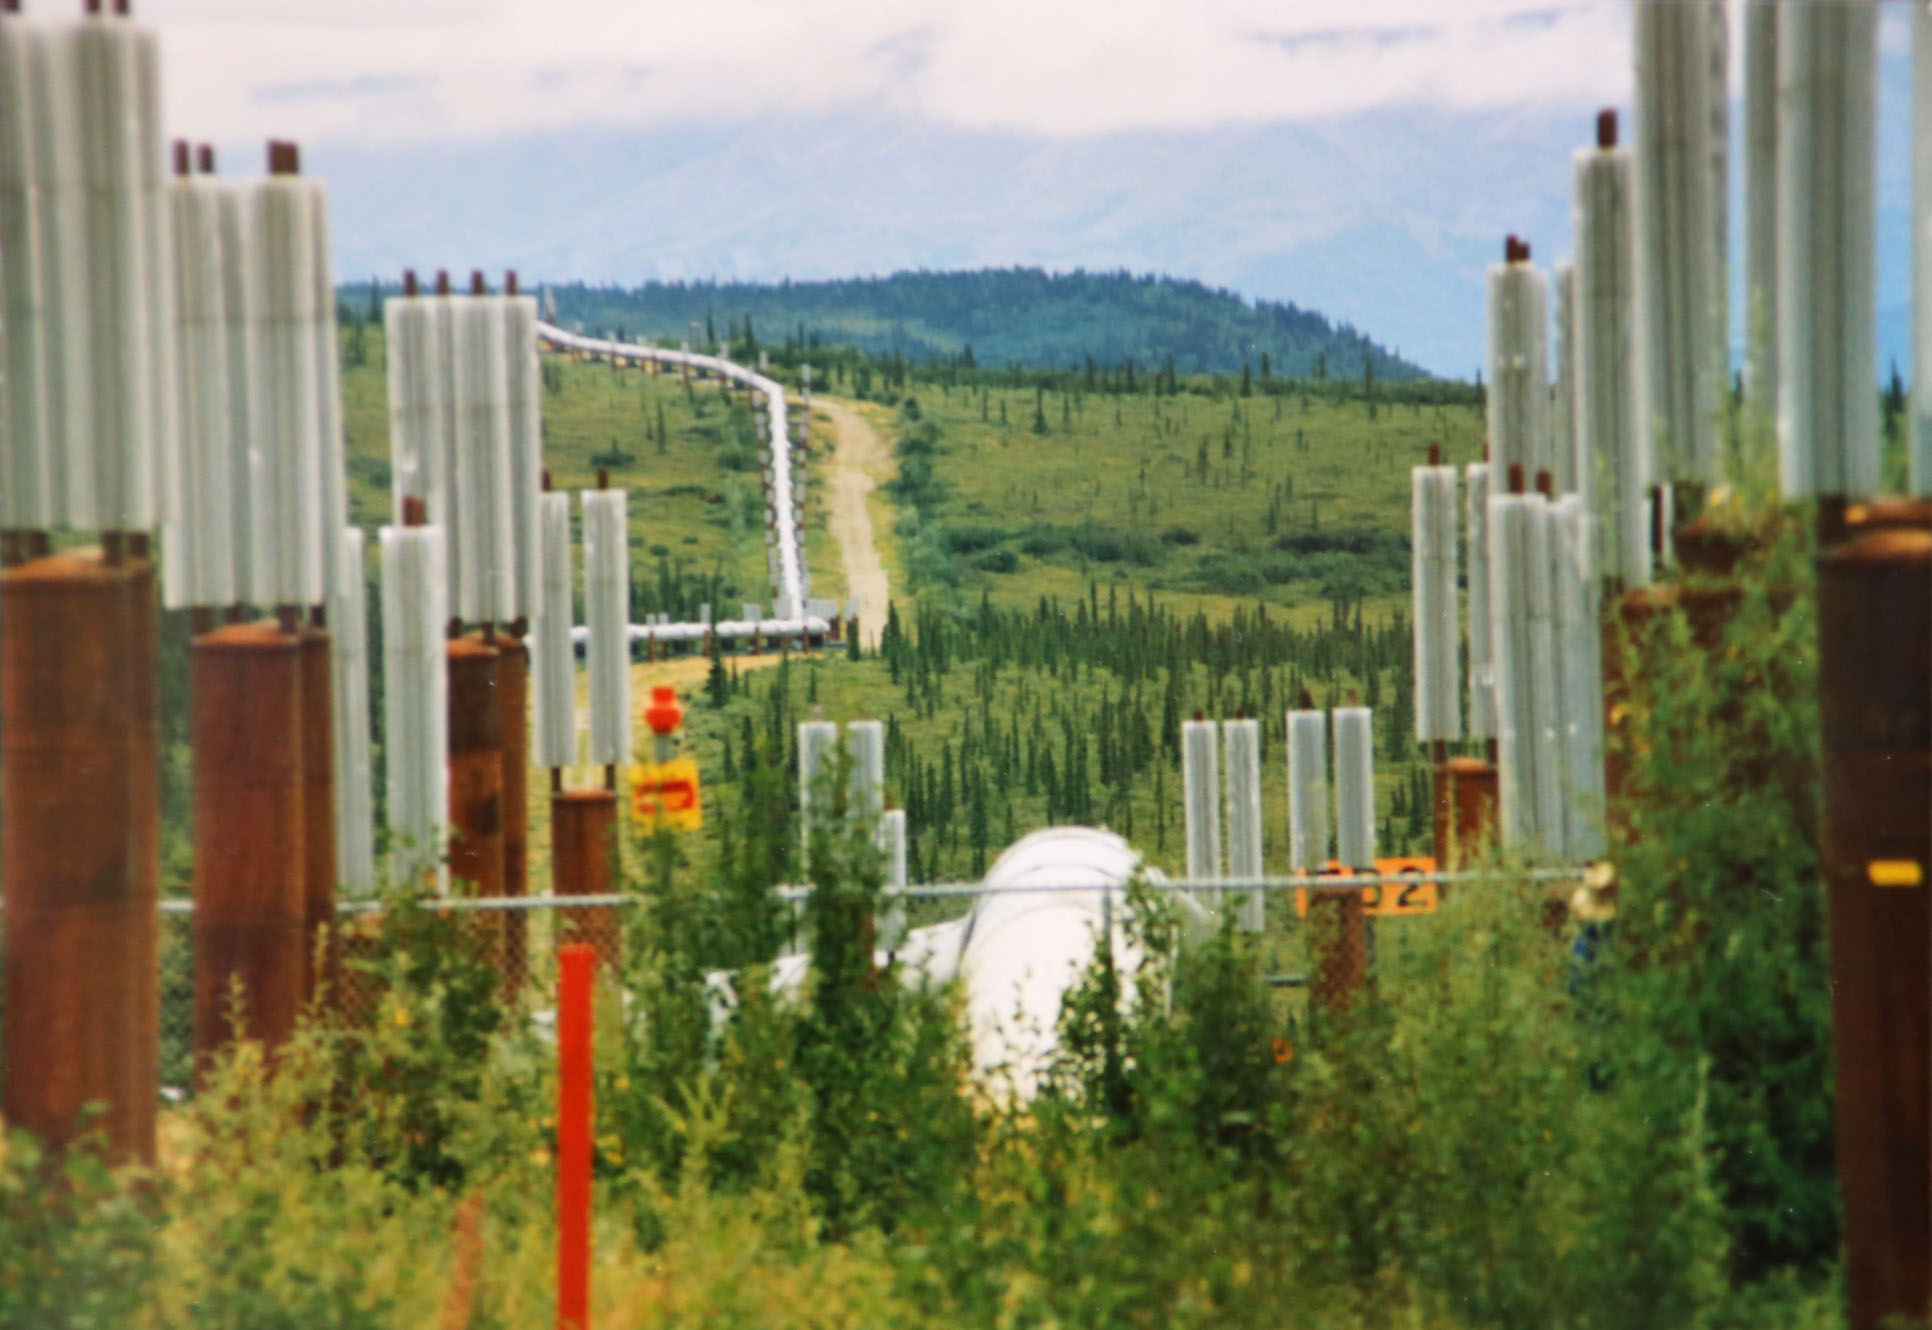
Figure 4. TAPS south of the Alaska Range, highlighting several innovative design features of the TAPS, including the burial of the pipeline in some sectors (such as here, where the pipeline goes underground), the elevation of the pipeline in other sectors, passive ammonia cooling system to maintain the frozen permafrost, and the zig-zag pattern designed to absorb earthquake-caused deformation. Photo courtesy of Jeffrey Kargel.
A larger view of the full ASTER image acquisition is shown. Note the presence of unfrozen sediment-laden glacier meltwater of the glacial lake (cyan) north of the oil port and east of the city of Valdez. The unfrozen state of the lake in mid-winter is a testament to the unusually warm January in Alaska.
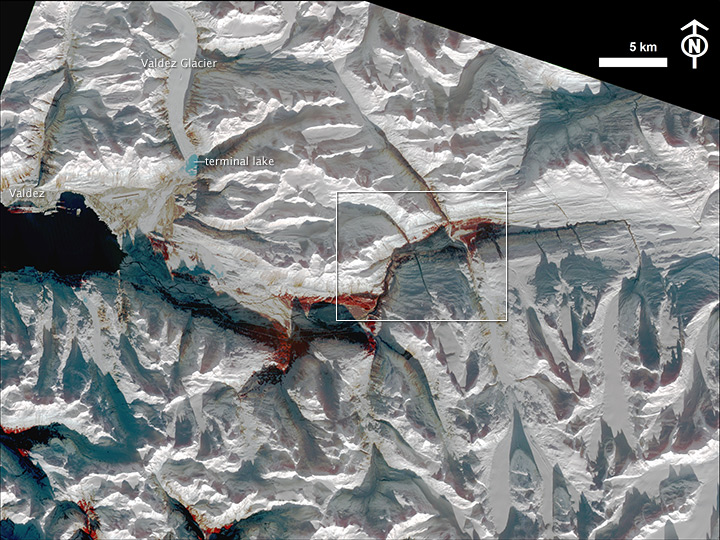
The upper image is an ASTER RGB false-color composite image draped onto the GDEM2 shaded relief map that shows the broader area. The town of Valdez is visible along the eastern arm of the Valdez Arm. Valdez Glacier, with its terminal lake (cyan), is visible northeast of the city. The lower image is an inset that shows the site of the avalanche in more detail.
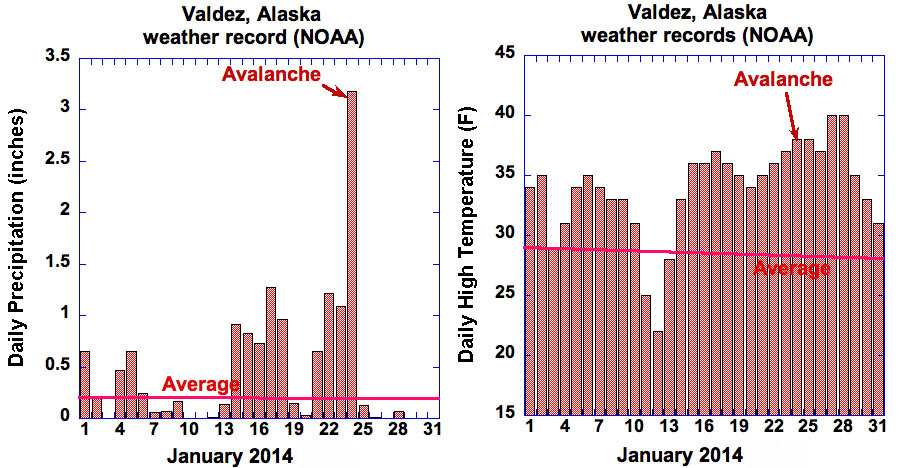
This winter has been extremely mild in Alaska, enough for the record books, and the weather data point to the likely trigger of the avalanche. National Oceanic and Atmospheric Administration (NOAA) records indicate the January 2014 snowpack for the Valdez recording station was far below normal, while the amount of precipitation (rain or snow-water equivalent) received was more than double the January normal since 1972. The huge avalanche was conditioned by three consecutive days of record high or record high minimum temperatures and then triggered by days of record anomalous rainfall.
-
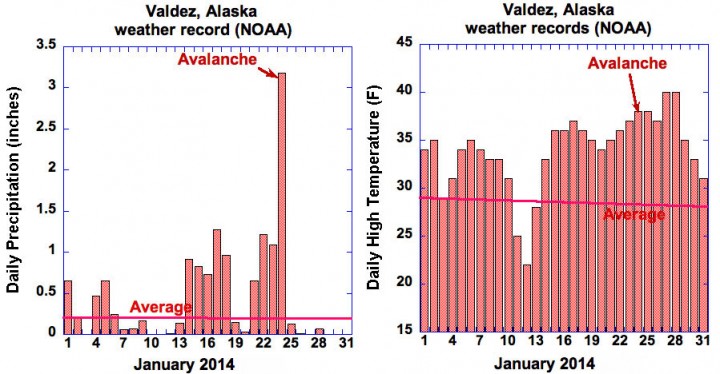
January 2014 temperature records for the Valdez recording station. The almost horizontal lines are the averages for those dates (“normals”) over the period 1972-2014. January 2014 was twice as wet as normal, and about 6°F (3.3 °C) warmer than normal, but the day of the disaster and three preceding days broke multiple weather records in several parameters. Daily low temperatures (not shown) were also exceptional, with no freezing conditions in Valdez for the three nights prior to the avalanche, whereas normal lows are about 19 degrees for those dates.
A sequence of exceptional weather anomalies extend back to October. That conditioning set the stage for the rainfall trigger to release the huge avalanche. The warm weather across most of Alaska—including an Arctic January in Kotzebue that experienced winter temperatures more typical of those in Portland, Oregon, is the other side of the coin that dealt the U.S. East, Midwest, and South a severe deep freeze. Such extreme oscillations of weather are related to a deeply dipping jet stream and establishment of a days-long flow of saturated tropical air into the Valdez area. These conditions, particularly the strong meridional flow of air masses and “stuck” jet streams that resulted in prolonged extreme weather patterns, are thought to be increasing in frequency due to global warming, according to climate modeling by Jennifer Francis (Rutgers University) and colleagues. The Arctic is warming more rapidly than the Tropics, which may be forcing changes in global circulation and weather patterns.
However, decadal variability caused by atmospheric and oceanographic “teleconnections” to the rest of the planet (El Niño/La Niña being the most famous example, and the Pacific Decadal Oscillation being the one most relevant to southern Alaska) are always causing climatic oscillations and sometimes extreme weather, so we cannot yet point definitively to climate change, as opposed to these oscillations, as the underlying cause of this event. These climatic oscillations affect everything from the salmon fisheries to snowfall and rain patterns, so climatologists will have to look deeply at global warming, disappearing sea ice in the Arctic, and climate oscillations to find the ultimate answer to why Alaska’s weather has been so weird (and indirectly, why this mega-avalanche occurred), and how that relates to what is happening around the globe.

GOES-15 satellite image at 6.5 microns (a region of the thermal infrared that is absorbed by water vapor), portrayed as the temperature at the top of the water-vapor emitting region (clouds or humid air). Reds and yellows portray a very dry atmosphere, where emission of thermal infrared arises very deep in the atmosphere at high temperatures. Blues indicate a moister atmosphere, and white and green an extremely moist atmosphere extending to very high altitudes having very low temperatures. The image was acquired 3:00 PM (local Alaska Time Zone) on January 23, 2014, the afternoon before the giant avalanche. A stream of extremely moist air arising in the northern Tropics—sometimes called the Pineapple Express—had been slamming into the Valdez and Keystone Canyon area (red square) for several days, thoroughly soaking the area. Valdez received over 11 inches of rain in the 12 days preceding the avalanche. Image rendered and made available by the Cooperative Institute for Meteorological Satellite Studies (CIMSS), University of Wisconsin – Madison, USA.
The avalanche in Alaska cannot be blamed squarely on climate change, but it is another reminder that as climate changes, extreme weather may also be changing, and this impacts the well-being of people and critical infrastructure. Climate change and effects on natural hazards and disasters represents a moving target that must be re-examined by those planning the future, whether it is construction of major infrastructure or planning for disaster recovery. Climate change is not just a matter for the distant future, but it is ongoing now.
We thank the NASA Cryosphere Program, which funds our glacier and cryosphere related research, and the U.S.-Japan ASTER project, which provided the ASTER imagery.
This is an excellent analysis. I have been following the events and record heat in Alaska. I live in the mid-west in Iowa. Your heat is our cold. We are ready for a more normal flow of the jet, too.
Thank you for this story.
Jim, not only is Alaska’s heat your cold, but Alaska’s heat and rain is Tucson’s heat and drought. We are 60% of the way through our winter rainy season, and we (at our house) have had 0.6 inches total rainfall since Dec.1, compared to a normal about 5-6 times that. We have had serious drought for many years. Our normally resilient Sonoran Desert is having a seriously tough time coping, though on the positive and hopeful side, it evolved through climatic pressures as we are experiencing. Stay warm!
To this interesting analysis there are two minor corrections. The tunnel which partially drained the temporary lake was the road tunnel used prior to the road improvements for the construction of the pipeline. The railway tunnel was never completed and is an interesting story in itself.
Also, since the entire area of the mountain depicted to have avalanched was not a single avalanche but a culmination of many avalanches over many days between January 14 and 30, the size 5 rating is not accurate.
There are two rating systems for sizing avalanches. The relative area and mass system doesn’t fit a size 5 not only for the reason above, but that most of the snowpack still remains on the mountain. The majority of the debris at the valley floor came from the lower half of the mountain where the snowpack is thinner.
Applying the destructive size system, a rating of size 5 may be more accurate considering both the typical mass, 1 million tonnes, and typical path length, 3000 meters. It may have been met if it was a single avalanche. However, I submit it doesn’t really fit the description of being the largest snow avalanche known, which could destroy a village or forest area of approximately 40 hectares.
The upper end of a real destructive size 5 occurred in 1970 in Yungay, Peru.
I submit the largest of the series of avalanches off Snowslide blocking the RIchardson highway and Lowe river was artificially triggered January 25 and is a size 4.5 on the destructive scale. On the relative scale it is a size 2 based on mass and area, which shows a limitation of that scale.
We all get relative size 5 avalanches off our roofs all the time, but if Snowslide had released all of its mass over all of its area all at once, the resulting avalanche and damage would have been considerably greater. After all, not long back the pipeline company’s bridge made of one inch thick steel I-beams was lifted off its footing in a much smaller destructive size 4 event. Another steel bridge of the same design and materials was put across the runout of Snowslide Gulch as a foot bridge along the historic road, and the site of two avalanche fatalities before WW1. That bridge was demolished its first winter. Both bridges discussed are of the same stuff as the highway bridges.
Information on this event is posted in the avalanche bulletins posted by the Valdez Avalanche Center.
Thanks for the notes, Pete!
As you may have noticed, we have now linked the reference to the railroad tunnel to a news coverage on the subject of the role it played here.
Other sources I looked into showed photos of and described a child standing in the tunnel, indicating that it was not passable by vehicle traffic as recently as the pipeline construction era, and, as you noted was never completed for rail use. There was no indication of its use, period, as it was not completed following the railroad battles of a century ago.
But the point for our write-up here was its fortuitous existence. Were it not for that tunnel, there is a strong chance the lake would have released catastrophically.
There are a few glacier-related lakes that engineers have tunneled into in order to prevent such a release elsewhere across the cryosphere.
I also suspect that the second main avalanche, that was brought down by controlled efforts, was the bigger of the two primary slides, and was also fortuitous in holding the dam together until drainages were established. Thanks for the rating details.
Pete, I echo Dave’s “thank you” for clarifying and correcting the matter of the avalanche rating. Readers should defer to your guidance on that matter.
As for Yungay, in my opinion that was a very different kind of event, not clearly or simply a snow avalanche, considering how much rock debris came down. For rock avalanches, the 5-tiered rating system does not make much sense, since there can be vastly larger events, and the dynamics often are different from snow avalanches.