By Clément Miège
Hi there! Today I will give you some background on the radar measurements we collected in southeast Greenland. The radar we deployed is sensitive to snow density changes and to wet snow. The main goal of the radar measurements was to provide information about the spatial variations of the top of the aquifer (a water layer trapped within firn, or old snow).
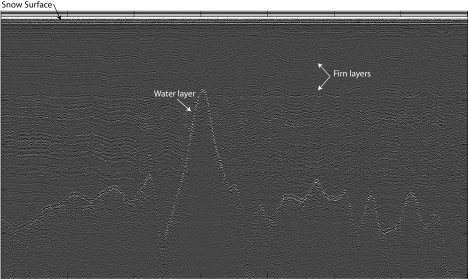
The radar we used is made by GSSI, a company specialized into geophysical measurements, and it has a center frequency of 400 MHz. In snow and firn, the electromagnetic waves sent by this ground-penetrating radar can image approximately the first 50 meters of a dry snowpack. The layers that we observe in radar measurements show the snowpack stratigraphy (density changes). If there is water within the snow and firn, we observe a really strong radar echo in the radar profile. Then, by dragging the radar around, we are able to see how this water layer evolves spatially.

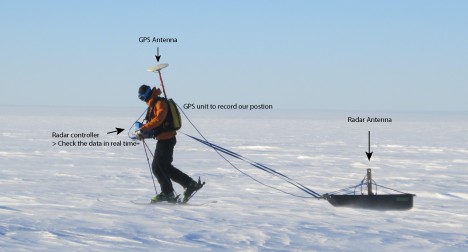
Here is the radar system in action, with Ludo pulling the sled. It can be a pretty tiring job with the wind and the cold. The balaclava was an absolute must to protect your face from the freezing temperatures.
Mostly to lighten our helicopter loads, but also to exercise a bit, we decided to pull the radar sled with skis. But it ended up not being an easy job at times: some of our field days were really windy and cold, so we needed to be warmly dressed and have our face well-protected. In addition, we carried a backpack with the GPS unit and a battery – they became pretty heavy after an hour of pulling the radar. Ludo and I set up the rule of not doing more than 2 hours of survey at a time, which corresponded to about 5 km total.
Once on the ice sheet, as soon as the helicopter took off, we turned on the radar. Indeed, we wanted to make sure that we had been dropped over water and then find the best location for our drilling site. By looking at the radar profile, we identified the water layer (great!) and we converted its depth from electromagnetic wave two way travel time to meters. We observed that over a 2-km transect, the top of the aquifer varied up to 10 meters. By knowing this variation, we were able to pick the site location at a depth that fitted our science needs.

An example of the radar profile observed: the bright reflector represents the top of the water layer. Other internal reflections can be seen — they are linked to previous summer layers, which are denser.
The advantage of doing this preliminary radar survey is that we then knew before drilling at which depth the drill would encounter water and penetrate into the aquifer. And the good thing was that the radar picked the right water depth in both drilling sites! The radar ended up being a really good tool to extend spatially the localized information obtained by the firn cores.
For the radar survey, we were doing some elevation transects, to see how the water layer changed with the local topography, and some grids and bowties to extent spatially the core site stratigraphy. We stayed within a radius of 2 km from our camp.
Overall, doing the radar surveys was a great experience. It’s incredible to think that we were skiing with liquid water right below us, while surface temperatures averaging -15C.
Finally, concerning the radar setup, we have already some improvements in mind for the next time. For example, the GPS unit and its antenna need to be in the sled, maybe mounting the GPS antenna on a corner of the radar sled, trying to keep the all setup stable. That will allow us to drag the radar longer. We will work on that for our next radar adventure!
Tags: Arctic, glaciology, Greenland, ice core, NASA, radar, sea level rise


Thanks for the science reports. They are very interesting.
– just a memo for the researchers, should it reach their attention:
— might i suggest that a sail-driven ice-sled might be a better means to drag around the ground radar, hmmm…?
Doctor Static
Keep writing, I really enjoy reading about your work, conditions, results. Just reading about & seeing all the snow & ice makes me feel cooler being that we’ve had temps at 93F recently.
We enjoy reading your reports. We keep track of what is happening to the detail. Teamwork is essential for the investigation for it is a significant extraneous factor that can alter the results. We look forward to your postings. The world is watching! Great Job !
This is really neat.
Please keep us posted and some close up pictures would be very much appreciated.
Bob AF2Q