By Lora Koenig
Byrd Station (Antarctica), 9 December — Today was a huge day. First off we figured out the problem with the radars: One of the USB ports on the computer was not functioning properly. When we changed the USB port, the problem went away. I was relieved there was such a simple solution to the problem and so was Clem, who had had a rough night’s sleep worrying about the radars.
At around 9 AM we headed out to drill our first ice core of the season. We drilled at a site about 3 kilometers (1.86 miles) away from camp. This site was chosen because a previous ITASE core was drilled there in 2002. Our core will update this core and we will compare the overlapping years of ours with ITASE’s to understand any differences. Last year we also drilled at a site of a previous ITASE ice core and got similar results that give confidence in the measurements and methods from both cores.
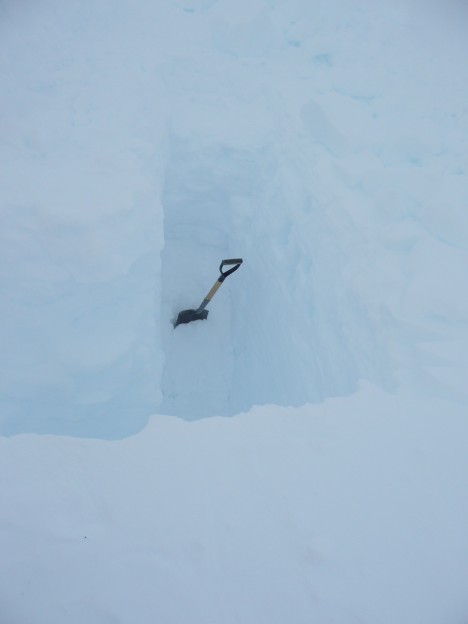
Clem ran the radar out to the drill site to image the layering while Ludo drove the snowmobile. Once at the site, Ludo immediately started digging the snow pit to sample the snow in the top 2 meters (6.56 feet) of the ice sheet. The snow at the very surface of the ice sheet is very similar to the hard wind-packed snow that you would encounter in the high mountains in the U.S. and it’s not bonded well enough for us to ship cores of it back to the U.S. in one piece, so instead we took samples of the snow in the pit for lab analysis. The cores have to stay in one piece, or we would lose our chronological record. Additionally, we took other measurements in the snow pit that are important for modeling how the microwave radiation, from both the satellites in space and radars on the ground, interacts. Snow grains of different sizes and shape can actually be detected by satellites in space! As the snow grain size changes, the signals in space change.

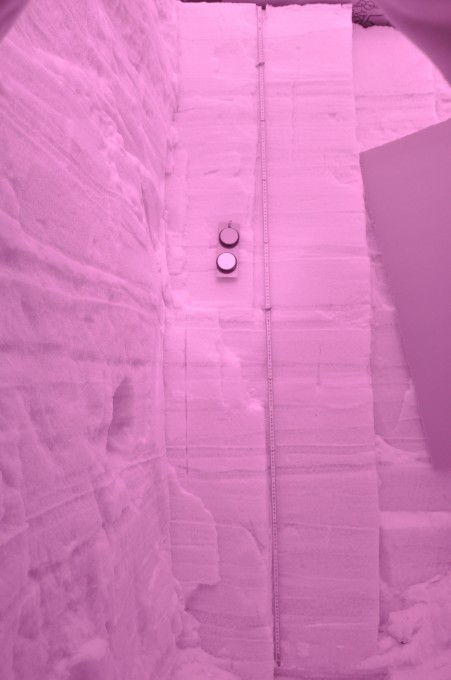
Ludo spent all day in the pit. We think he may hold the record for the most time in one pit, about nine hours from digging to fill in. He took infrared photographs of the snow. Here is one from the pit:

These photographs are used to calculate the grain size given the different reflectance levels of the infrared radiation. The photos are pink because they are taken in the infrared wavelength, not visible light like most cameras do. They are also very pretty to look at and you can see all of the layers of snow. Each storm puts down a new layer of snow. There was a new layer approximately every 6 cm (2.36 in) in this pit. There were more layers than I have ever seen before in a pit, which made the pit measurements take such a long time.
At about a third of the way down the picture the snow becomes firn, which is snow that had persisted through at least one melt season. We cannot tell from the snow pit exactly how old the firn in the pit is (we need the isotopes for that), but we know that there are at least three years of records in the pit, so the firn at the bottom could be from 2009.
After the infrared photos, Ludo recorded the stratigraphy of the pit (snow grain size and type) using a macroscope, cut snow samples for isotopic analysis, and measured the thermal conductivity of the snow, which is the snow’s ability to transfer heat. Heat conducts through the ice lattice more than through the air in the pore spaces, so thermal conductivity is also a measure of how bonded the snow is. Because I was helping Ludo in the pit there are not any photos of this process. Often while we are actually doing the science we don’t have many photos because we are all working.
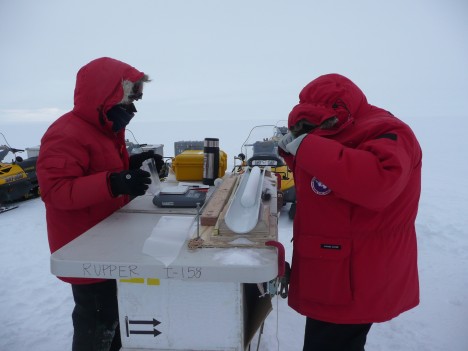
As Ludo was working in the snow pit, Randy started drilling the ice core. He would drill the core and Jessica and Michelle would process it. The core is weighed and measured to calculate its density. The length of the core and the depth of the drill hole are recorded, and the electrical conductivity of the core is measured to detect changes in snow chemistry. The core is then put in a bag, a tube and a box for shipping back to the lab for isotopic analysis. The final depth of the core was 16.8 m (55.1 ft), which will correspond to about 40 years of snow accumulation history.

Tags: Antarctica, Byrd Station, ice core


Nice work!
Hmm is anyone else experiencing problems with the images on this weblog loading? I’m trying to uncover out if its a issue on my end or if it’s the weblog. Any feed-back would be greatly appreciated.