The American West is in the grip of an exceptional drought. Following one of the planet’s hottest years on record — and with rainfall and snowfall in the western U.S. well below average — water managers, policymakers, government agencies, and scientists are facing strapped water supplies and anticipating potentially devastating wildfires.
Using its satellites, aircraft, and computer models, NASA is helping water managers respond. NASA’s drought resource page details how the agency is helping farmers, reservoir managers, and decision makers track and monitor the ongoing drought, predict how much water will be available, and help improve how we use the water we have. The site will be updated throughout the year.
Underpinning all of this is NASA’s expertise in water science, our partnerships with water managers across the country, and our leadership in space and remote-sensing technology.
Learn more at the drought resource page.

After Hurricane Matthew ripped through Haiti, it blew through the Southeast. From above, NASA satellites, aircraft, and astronauts kept watch on the storm. The Earth Observatory published several images of the destructive storm (thumbnails above). The below includes a sampling of other notable images and maps related to the storm.
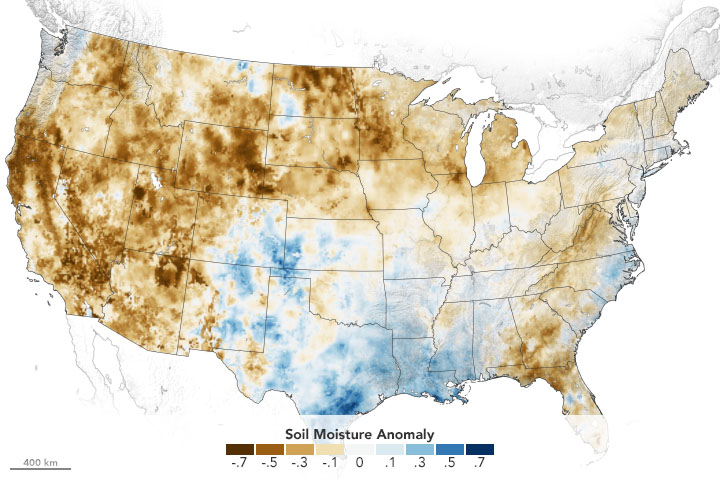
Soil Moisture
Matthew drenched the Carolinas, breaking records for single day rainfall in six places, The Washington Post reported. The Southeast received a total of 13.6 trillion gallons of water—that’s three-fourths the volume of the Chesapeake Bay. Hard-hit areas of North Carolina received 15 inches (38 centimeters) of rain.
That downpour saturated the area, causing values for soil moisture to increase substantially. The North American Land Data Assimilation System (NLDAS) mapped these values for October 1, 2016.
Even before the storm arrived, the ground in many areas was saturated. Eastern North Carolina and northeastern South Carolina have localized areas over the 98th percentile. That means that on October 1, the soil was wetter than it was on that date in 98 percent of previous years. The already-wet soils and heavy precipitation from Matthew led to significant flooding in these areas.

Image: NASA
Temperature and Precipitation
The Jet Propulsion Laboratory (JPL) HAMSR instrument flew above Hurricane Matthew on October 7, 2016, aboard a NASA Global Hawk aircraft. The image below shows atmospheric temperatures overlaid atop ground-based radar and satellite visible images, according to a JPL release. Reds tones show a lack of clouds, whereas blue tones show ice and heavy precipitation. At the top left is an image taken from the Global Hawk.

Image: JPL/NASA
Clouds Swirling from Above
Expedition 49 astronaut Kate Rubins took the photograph below from the International Space Station at 21:05 Universal Time, on October 4, 2016, as the hurricane approached the Florida coast. Hurricane clouds fill the shot, which includes the station’s solar arrays.

Photo: NASA/Kate Rubins
