Three thick layers of cake and frosting sat atop Jeff Schmaltz’s kitchen counter. The programmer had completed a 3-D model of a GIBS tile pyramid; it was his entry into a collegial science bake-off at NASA’s Goddard Space Flight Center. But there was more to this cake than flour and eggs and sugar.

This tile pyramid cake shows a view of the world with Antarctica represented as the largest continent on the map. Credit: Susan Schmaltz.
If you have ever browsed Earth science imagery and data using the online tool Worldview, then you have also used GIBS, Global Imagery Browse Services. GIBS is like a gear behind a clock face, a mechanism that keeps the hands moving. Schmaltz and his colleagues rely on it daily as they assemble images of our dynamic planet. (Worldview is a free and publicly available Earth science browser used by scientists and non-scientists, including the NASA Earth Observatory team.)
How It Works
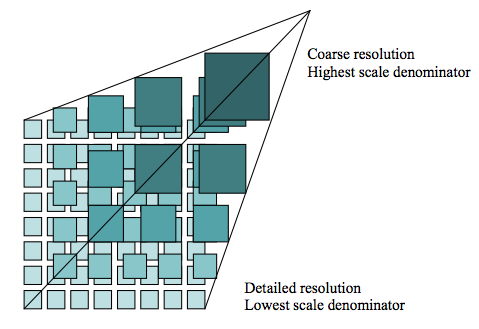
GIBS ingests and organizes satellite data to create a global mosaic. Then, it chops down the data into digestible bits—like that image tile pyramid that Schmaltz recreated with cake—so that users can quickly view Earth as seen from space.
Zoomed out in a broad view, you see just the top tile, the whole Earth in low resolution (like the top layer of the cake). Zoomed in, you see one tile covering a smaller region of the earth but in more detail (like a square from the bottom layer of the cake). On an interface like Worldview, which allows users to scroll and view daily images from the entire surface of Earth, an architecture like GIBS is necessary to keep the site running quickly.
“It’s very fast, and there’s not a lot of computing going on,” Schmaltz said. GIBS does the same thing that Google Maps does: it summons only the data the user requests. By dealing in tiles, the program can serve many people at once without getting bogged down.
GIBS uses tiles (512 x 512 pixels) to speed up data processing. Credit: The Open Geospatial Consortium (OGC).
Way Back When
Not long after NASA launched the Terra satellite in late 1999, the U.S. experienced a record fire season: A record 8.4 million acres burned in the year 2000. At the time, it could take weeks for data from Terra’s MODIS instrument to be processed into images. Scientists hoped that a quicker turnaround might translate into a more informed response to fires. As result, NASA created a near-real time fire pixel product.
Seventeen years later, scientists can visit Worldview to see roughly 150 near-real time data sets from different satellites and sensors as the clouds and snow cover change each day. Air pollution, vegetation cover, dust, smoke are just a few of the data layers users can view.

Credit: NASA.
P.S. To make Jeff’s satellite cake, follow his grandmother’s recipe below:
Ingredients:
Directions:
Mix dry ingredients together. Measure oil, water, egg yolks, and vanilla into a measuring cup and mix; then add to dry ingredients and beat until smooth.
Beat 2 egg whites + ¼ tsp. cream of tartar until stiff. Fold into batter. Slowly mix in grated chocolate.
Bake in ungreased 8×8 pan at 350 degrees for 20-25 minutes. Check with toothpick when done. Cool on a rack. Goes best with chocolate frosting. (Schmaltz uses the recipe on the side of a Hershey’s can.) Alternately, you can top the cake with an edible print of a satellite image.

Credit: Adam Voiland.
One of the wonderful things about working for the Earth Observatory is that we often get first crack at examining imagery from satellites new and old. It’s been especially exciting to look at data from Landsat 8, a joint U.S. Geological Survey and NASA mission launched in February 2013.
But with new things comes new challenges. We’ve had some odd problems with the very intense memory demands of Landsat 8 imagery, for example. And when I saw the image below, I thought for sure I had stumbled on a processing error.
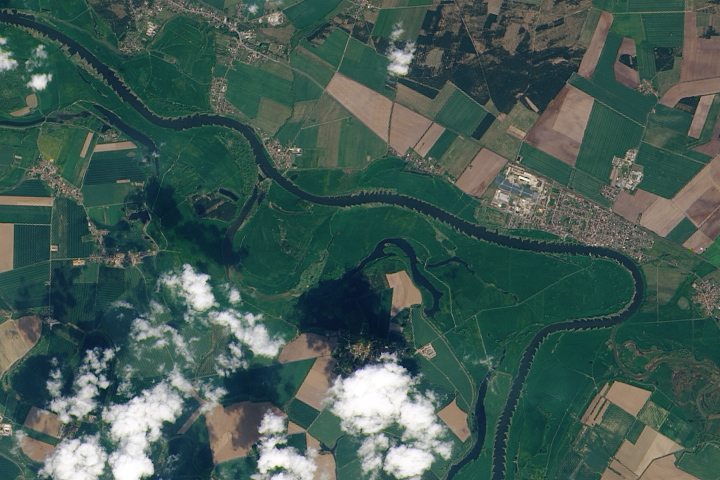
This is a natural-color, pan-sharpened image of the Elbe River near Wittenberg, Germany, obtained by Landsat 8 on May 6, 2013. I had obtained this to compare to a new acquisition from June 7, 2013, which showed major flooding in the Elbe.
Oh dear. Look at that ripple pattern along the river banks. Superficially, it looks a lot like a software processing error. New code I wrote: my error, right? In fact, at first glance, it looked a lot like Landsat data of a decade or so ago when the source files were being distributed with nearest-neighbor resampling–a technique used in remapping and resizing data which limits interactions between adjacent measures, something often useful in science measurements, but which causes jagged-looking edges. Since this was not the first time my code had done something unexpected, it was the obvious first place to look for the cause. The software failed me! Again!
However, a quick glance through the data files showed that, whatever was going on, it was coming from the source data: the same rippling showed up in all the bands. Ha! Someone else’s software had failed!
Because Landsat 8 is so new, it is easy to assume maybe I was not the only one having occasional processing problems with old software on new data. There was one more check I should have done before contacting customer service at USGS, but…
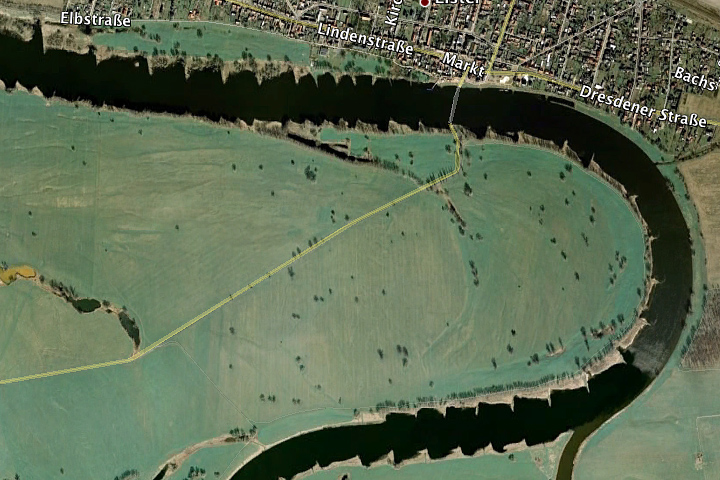
…I didn’t think of it. If you see something odd in imagery, it is always good to check reality. In this case, a quick zoomed-in view in Google Earth (as shown here) would have informed me that the jagged edges along the banks of the river in the imagery are real jagged edges along the banks of the river.
In hindsight, there were other clues. Notice that the jagged features are present in some places and not others. And notice that the rippled pattern along the banks bends and curves with the flow of the river. A processing artifact might only show up on very strongly contrasting features (the boundary between land and water here, for example), but would most likely be aligned consistently through the image. It wouldn’t appear and disappear like it does here, and it would probably be more regular. It would probably distort in the same direction every time it happened.
In the end, it turns out that all the new systems were working just fine and there really is a very oddly shaped series of features along the banks of the Elbe River near Wittenberg, presumably to stablize the banks of the river and control sediment flow.
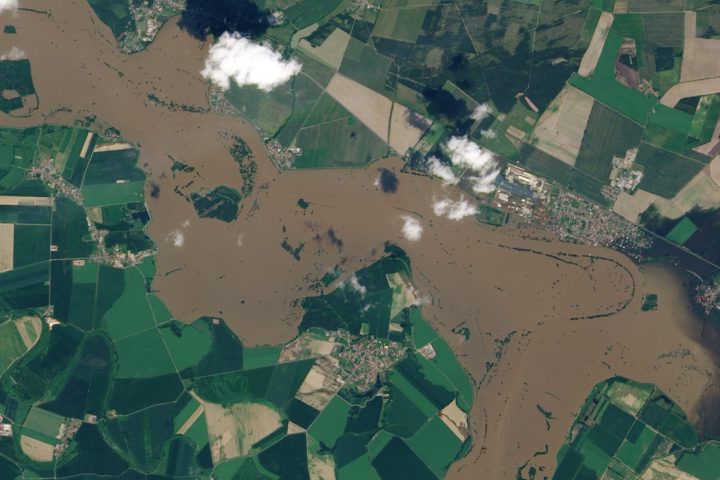
But there’s not much they can do in the face of severe flooding.
