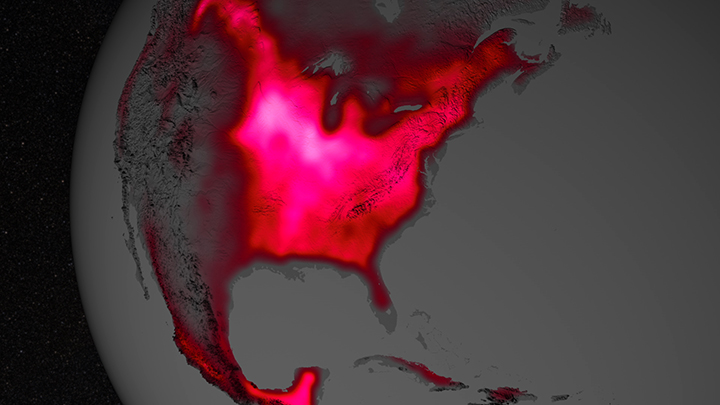
The magnitude of fluorescence portrayed in this visualization prompted researchers to take a closer look at the productivity of the U.S. Corn Belt. The glow represents fluorescence measured from land plants in early July, over a period from 2007 to 2011.
Editor’s Note: This is an excerpt from the NASA Science in the News column published in the May/June issue of the Earth Observer. You can download the current issue of the newsletter here.
Under the Summer Sun, the Corn Belt Is the Most Biologically Productive Place on Earth, Smithsonian Magazine. Rainforests, whether in the Amazon, Southeast Asia, or Central America, are hotspots of organic productivity. Fueled by abundant rain and a reliable stream of nutrients, the Amazon blooms year-round. For a brief period each summer, however, the ingenuity of humankind trumps even the mighty rainforests at biological production. A group of researchers, including Christian Frankenberg and Joanna Joiner have determined that during peak growing season, the Midwest U.S. Corn Belt is the most productive land on Earth. In other words, there’s more photosynthesis going on here than in the Amazon. When plant cells photosynthesize, part of the energy they produce is emitted as fluorescent light. By measuring the strength of this fluorescence from space, scientists can get a measure of plant productivity.
Arctic Melting Is Lasting Longer and Affecting More Ice, UniverseToday.com. The Arctic melt season is averaging five days longer with each passing decade, a new study by NASA and the National Snow and Ice Data Center reveals. More ice-free days mean the water (which is darker than the surrounding ice) is exposed longer and can absorb more of the Sun’s heat, further increasing the melting rate and extent. The study shows that thickness of the Arctic ice cap has shrunk by as much as 1.2 meters (4 feet). By the end of this century, scientists believe the Arctic Ocean will be ice-free during the entire summer. This news came in the same week that the Intergovernmental Panel on Climate Change released its own report on global warming. Data were collected with NASA’s (long-deceased) Nimbus-7 Scanning Multichannel Microwave Radiometer and instruments onboard Defense Meteorological Satellite Program spacecraft. Scientists can measure the changes in the ice’s microwave emissivity using a formula developed by co-author Thorsten Markus.
NASA Study Projects Higher Temperatures Despite Recent Slowdown in Global Warming, Bloomberg. Despite a recent slowdown in the rate of global warming, a study by Drew Shindell suggests global temperatures will likely continue to rise in coming decades, on track with earlier estimates of increasing temperatures. Shindell and his colleagues sought to reconcile different estimates for the Earth’s climate sensitivity, or how temperatures change in response to changes in radiative forcing. Some studies estimate low climate sensitivity, based on the assumption that global average temperatures would respond uniformly to increases of carbon dioxide (CO2) and other greenhouse gas emissions. But the NASA study showed that global temperatures are more sensitive to changes in aerosols and ozone in the atmosphere than was thought. This higher sensitivity could mean a larger and faster temperature response. Shindell said the study’s findings could have “a really profound impact” on the amount of greenhouse gas emission reductions needed for countries to meet an international goal of limiting temperature increases to 2°C (3.6 °F). “I wish it weren’t so,” said Shindell, “but forewarned is fore-armed.” Global temperatures have increased at a rate of 0.12 °C (0.22 °F) per decade since 1951, according to the NASA GISS temperature record. This trend has been interrupted since 1998, as since then the rate of warming has slowed to only 0.05 °C (0.09 °F) per decade—even as atmospheric CO2 continues to rise.
Amazon Rainforest Breathes In More Than It Breathes Out, LiveScience.com. A new study further confirms that pristine Amazon forests pull in more CO2 than they put back into the atmosphere, helping to reduce global warming by lowering the planet’s greenhouse gas levels. When scientists account for the world’s CO2, their totals suggest some of the greenhouse gas disappears into land-based carbon traps. These natural carbon sinks, such as forests, absorb and store CO2, helping to lower the greenhouse gas levels in the atmosphere. To better measure the carbon flux from the Amazon, researchers tracked tree death throughout the Amazon. Lead study author Fernando Espírito-Santo combined satellite data, airborne lidar data (i.e., laser surface imagery), and tree counts to compare carbon consumed by living trees with emissions from dead trees. Espírito-Santo found that dead Amazonian trees emit an estimated 1.9 billion tons (1.7 billion metric tons) of carbon to the atmosphere each year. In a normal year, the Amazon rainforest absorbs about 2.2 billion tons (2 billion metric tons) of CO2, studies suggest. The study also found that big storms that can blow down millions of trees at once barely budge the forest’s carbon output.

It’s that Time of Year
Monarch butterflies congregate in central Mexico every winter. Sandhill cranes stop at a small section of the Platte River in Nebraska every spring. And earth and planetary scientists congregate in San Francisco each December.
More than ten thousand people converged on Moscone Center this week for the the fall meeting of the American Geophysical Union, a hectic five-day event full of lectures, poster presentations, networking lunches, press conferences, and plenty of coffee and beer. For updates from the meeting, check out Dave Petley at the Landslide blog, Will Morgan at Polluting the Internet, the Barometer Podcast, Real Climate, and Journeys of Dr. G from Laura Guretin.
Tracking Tornado Intensity
Are tornadoes getting stronger? It’s a complicated and controversial topic among meteorologists, but Florida State University’s James Elsner thinks the answer is probably yes (with an emphasis on probably). Elsner came to that conclusion after analyzing the damage caused by every tornado to hit between 1994 and 2006. “If I were a betting man, I’d say tornadoes are getting stronger,” he noted during a talk the American Geophysical Union meeting this week. But when asked directly at a press conference whether they were, he resorted to caveats, according to Scientific American. “I’m not doing this [work] to establish the future intensity of tornadoes,” he explained, but to establish a method that someday could indeed determine if the storms are becoming more powerful. For more on the muddled topic of tornado intensity trends, see this detailed post from DotEarth’s Andrew Revkin.
Arctic Cyclones Galore
Remember that strong Arctic storm that whirled near the north pole back in the summer of 2012? A new analysis shows that there are more of them than we thought—40 percent more. From 2000 to 2010, about 1,900 cyclones churned across the top of the world each year, leaving warm water and air in their wakes—and melting sea ice in the Arctic Ocean. “We now know there were more cyclones than previously thought, simply because we’ve gotten better at detecting them,” one of the authors explained. “We can’t yet tell if the number of cyclones is increasing or decreasing, because that would take a multidecade view.” Read the press release.
Data Visualization AMA
If you missed the Reddit Ask Me Anything with Earth Observatory art director Robert Simmon, you can find the transcript here.
From Facebook
We post items every day to facebook (and not everything that goes onto Facebook makes it onto our site). One of the highlights this week was a spectacular montage of astronaut photography put together by film student David Peterson. Look for Don Pettit’s head peering out from the cupola at the end end of the video. If you’re anything like me, you’ll find yourself watching it again. And again. And again.
[youtube GOAEIMx39-w]
[youtube Ke6ureLcpkk]
Agony in the Philippines
Satellite images of Super Typhoon approaching and smashing into the Philippines last week were extremely worrisome. Reports and imagery from the ground have now confirmed that the concern was justified. One of the most intense tropical cyclones ever measured by satellites has left the Philippines in chaos. The Capital Weather Gang has heartbreaking footage from Earth UncutTV, which had videographers working in the path of the storm.
Deadly Cyclone over Somalia
Scores of people have died in Somalia after another powerful tropical cyclone — known as 03A — slammed into the northeastern part of the country. According to Accuweather, about 1-2 tropical cyclones form in the Arabian Sea each year, often in November. The last cyclone to strike Somalia made landfall in December 2012. Read more about the storm from Voice of America and Gulf Today.
Super Typhoon Haiyan and Climate Change
Given the strength and destruction of Haiyan, it was inevitable for discussions to arise about the relationship between the most powerful tropical cyclones and climate change. Climate Central contacted some of the leading researchers in the field and detailed some of the complexities in this piece. Though not all experts agree, the general consensus is that warming will bring stronger, wetter, but less frequent storms in the coming decades. Read our feature about storms and climate change for more insight on this complicated balance.
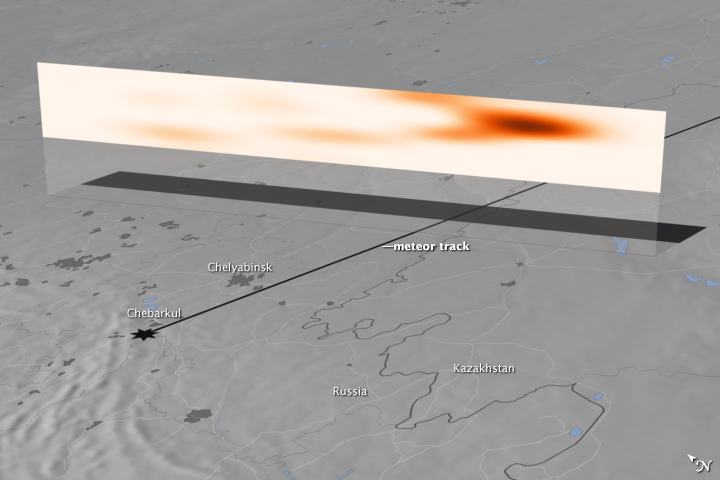
New Clues about Chelyabinsk Meteor
Following the dramatic meteor explosion over Chelyabinsk on February 15, 2013, eye-popping video and photographs flooded social media. After the event, there was no shortage of speculation about the trajectory of the meteor and how the explosion created so much damage. Scientists have since had time to carefully review all of the available evidence and have just published a detailed analysis of the event in the journal Science. Read more about the new research from NASA Ames and check out this blog about one of the researchers who co-authored the study.
Tiger Stripes Beneath Antarctic Ice
A new study published in Science points out that stripes of dirt and rock beneath Antarctic glaciers create friction zones that slow the flow of ice toward the sea. The researchers focused on the Pine Island and Thwaites glaciers, which together have contributed about 10 percent of the world’s observed sea-level rise over the past 20 years. Read more about the research in this press release from Princeton.
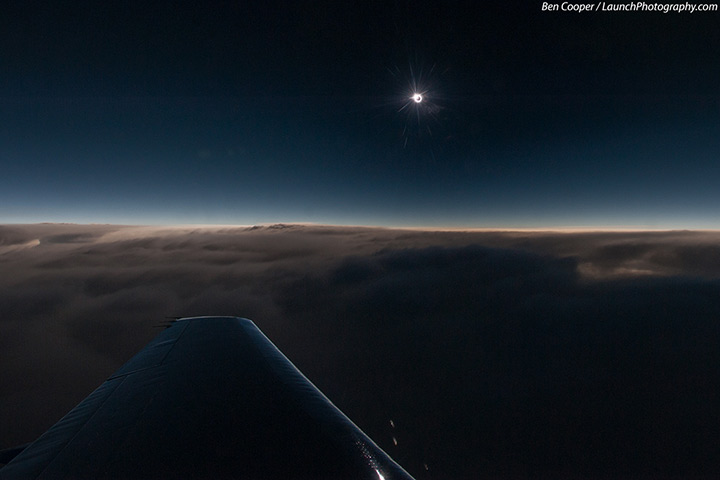
From Facebook: Eclipse at 44,000 Feet
Flying at 44,000 feet (13,000 meters), eclipse chasers on a chartered jet managed to intercept the Moon’s shadow over the Atlantic Ocean during the November 3, 2013, solar eclipse. The remarkable flight made a perpendicular crossing of the central shadow track. The photograph below was taken by Ben Cooper of Launch Photography. See another unique view—from space—of the same eclipse here.
The following is an excerpt from a story by Alan Buis, NASA’s Jet Propulsion Laboratory…
The curtain has come down on a superstar of satellite oceanography that played the “Great Blue Way” of the world’s ocean for 11.5 years. The joint NASA and Centre National d’Etudes Spatiales (CNES) Jason-1 ocean altimetry satellite was decommissioned on July 3, 2013, following the loss of its last remaining transmitter.

Launched December 7, 2001, and designed to last three to five years, Jason-1 helped create a revolutionary 20-plus-year climate data record of global ocean surface topography that began in 1992 with the launch of the NASA/CNES Topex/Poseidon satellite. For more than 53,500 orbits of our planet, Jason-1 precisely mapped sea level, wind speed, and wave height for more than 95 percent of Earth’s ice-free ocean every 10 days. The mission provided new insights into ocean circulation, tracked our rising seas, and enabled more accurate weather, ocean, and climate forecasts.
“Jason-1 has been a resounding scientific, technical and international success,” said John Grunsfeld, associate administrator of NASA’s Science Mission Directorate in Washington. “Since launch, it has charted nearly 1.6 inches (4 centimeters) of rise in global sea levels, a critical measure of climate change and a direct result of global warming. The Jason satellite series provides the most accurate measure of this impact, which is felt all over the globe.”
During parts of its mission, Jason-1 flew in carefully coordinated orbits with both its predecessor Topex/Poseidon and its successor, the Ocean Surface Topography Mission/Jason-2 (launched in 2008). These coordinated orbit periods, which lasted about three years each, cross-calibrated the satellites, making possible a 20-plus-year unbroken climate record of sea level change. These coordination periods also doubled data coverage.
Combined with data from the European Space Agency’s Envisat mission, these data allow scientists to study smaller-scale ocean circulation phenomena, such as coastal tides, ocean eddies, currents, and fronts. These small-scale features are thought to be responsible for transporting and mixing heat and other properties–such as nutrients and dissolved carbon dioxide–within the ocean.

Contact was lost with the Jason-1 satellite on June 21 when it was out of visibility of ground stations. At the time of the last contact, Jason-1 and its instruments were healthy, with no indications of any alarms or anomalies. Subsequent attempts to re-establish spacecraft communications from U.S. and French ground stations were unsuccessful. Extensive engineering operations undertaken to recover downlink communications also were unsuccessful.
After consultation with the spacecraft and transmitter manufacturers, it was determined a non-recoverable failure with the last remaining transmitter on Jason-1 was the cause of the loss of contact. The spacecraft’s other transmitter experienced a permanent failure in September 2005. There now is no remaining capability to retrieve data from the Jason-1 spacecraft.
On July 1, mission controllers commanded Jason-1 into a safe hold state that reinitialized the satellite. After making several more unsuccessful attempts to locate a signal, mission managers at CNES and NASA decided to proceed with decommissioning Jason-1. The satellite was then commanded to turn off its magnetometer and reaction wheels. Without these attitude control systems, Jason-1 and its solar panels will slowly drift away from pointing at the sun and its batteries will discharge, leaving it totally inert within the next 90 days. The spacecraft will not reenter Earth’s atmosphere for at least 1,000 years.
“Like its predecessor Topex/Poseidon, Jason-1 provided one of the most comprehensive pictures of changes in the tropical Pacific Ocean, including the comings and goings of El Nino and La Nina events,” said Lee-Lueng Fu, Jason-1 project scientist at NASA’s Jet Propulsion Laboratory. “These Pacific Ocean climate cycles are responsible for major shifts in sea level, ocean temperatures and rainfall every two to five years and can sometimes be so large that worldwide weather patterns are affected. Jason-1 data have been instrumental in monitoring and predicting these ever-changing cycles.”
For more information on Jason-1, visit: http://sealevel.jpl.nasa.gov and http://www.aviso.oceanobs.com .
An image from the SEVIRI instrument aboard the European Space Agency’s Meteosat-10 geostationary satellite. The vapor trail left by the meteor is visible in the center of the image. Credit: European Space Agency/EUMETSAT
Around 9:20 a.m. local time on February 15, 2013, a blazing mass of rock from space—a meteor—streaked across the sky over the Ural Mountains in the Chelyabinsk region of Russia. The burning mass produced a loud sonic boom and shock wave that blew out windows in multiple cities and towns. Russian media outlets are reporting hundreds of injuries, most minor, and damage to thousands of buildings.
Bill Cooke, the head of the Meteoroid Environments Office at Marshall Flight Center, said that the object, which likely came from the asteroid belt, had a diameter of about 15 meters (50 feet) and weighed about 7,000 metric tons. When it encountered the top of Earth’s atmosphere, it was moving 18 kilometers (11 miles) per second and left a vapor trail that was approximately 480 kilometers (300 miles) long. It lasted in the atmosphere for over 30 seconds before breaking up 25 kilometers (15 miles) above the surface, producing a violent explosion that released about 300 kilotons of energy. Most of the fragments burned up as they passed through the atmosphere, but some meteorites did reach the surface. One reportedly left an impact crater that was 6 meters (20 feet) in diameter.
The SEVIRI instrument on the European Space Agency’s Meteosat-10 geostationary weather satellite captured a view (top of this page) of the vapor trail. Dramatic videos and photos of the incident have also popped up on the internet.
The incident was not related to 2012 DA14, a 45 meter (150 foot) diameter asteroid that was expected to make its closest approach to Earth—17,200 miles (27,000 kilometers)—at 2:25 p.m. EST on Feb 15, 2013. The trajectory of the Russian meteor was significantly different than the trajectory of the asteroid 2012 DA14.
If you would like to learn more about 2012 DA14, tune into NASA Television starting at 2 p.m. EST. For general background about near-Earth objects, see these FAQ’s from NASA’s Near Earth Object Program.
For more information:
Live Updates from RT
Moscow Times
NASA Press Release
NASA Press Conference
RIA Novosit
Russia Beyond the Headlines
Slate: Bad Astronomer
USGS
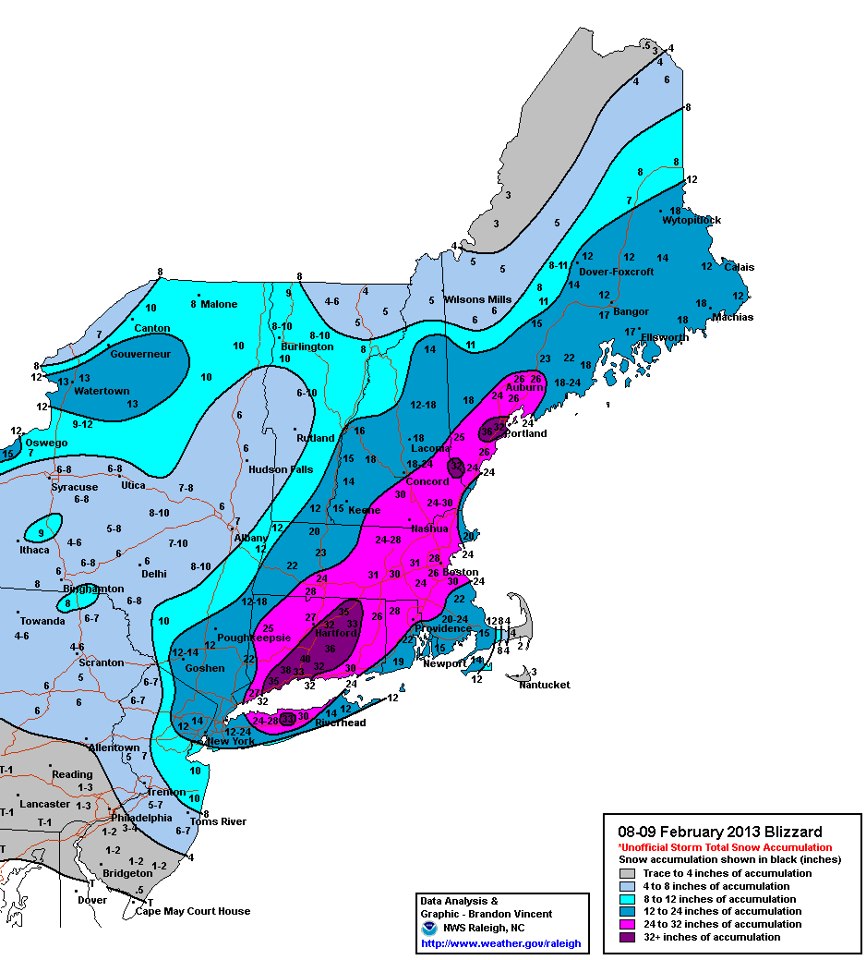
In digging for news on the nor’easter that whacked New England (and my house in southeastern Massachusetts), I happened upon several compelling images.
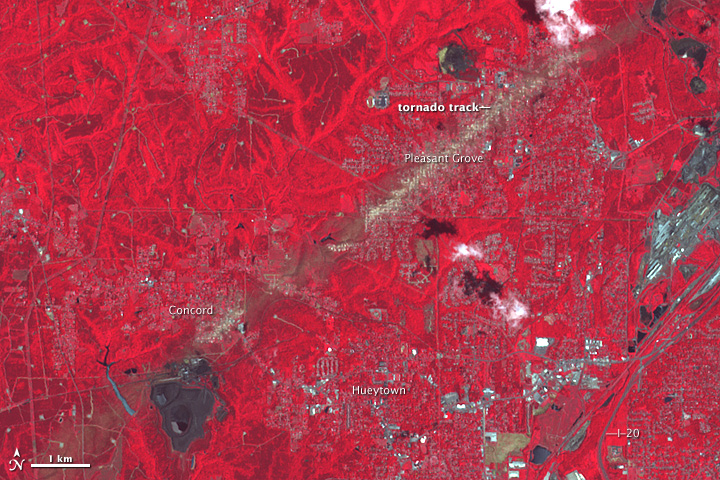
Marshall Shepherd, current president of the American Meteorological Society and director of the atmospheric science program at the University of Georgia, tweeted out this annotated version of a Terra MODIS satellite image of the storm aftermath:

It seems that the monumental snowfall highlighted some land features of New England, including its longest river, one of the largest manmade reservoirs in the United States (Quabbin), and the scar of a vicious tornado.
EarthSky published a map of snowfall totals compiled by the National Weather Service Hydrometeorological Prediction Center. About 35 to 40 million Americans live within that snowy bullseye.
Finally, our colleague Jeff Schmaltz on the LANCE/MODIS Rapid Response team noticed that while the skies cleared over New England and the Canadian Maritimes on February 10, cloud streets lined up offshore.

Cloud streets form when cold air moves over warmer waters, while a warmer air layer (or temperature inversion) rests over the top of both. Read more here from my fellow Earth Observatory writer Adam Voiland.
By the way, I am not buying into this idea of naming winter storms. I certainly won’t let it spoil my fondness for Nemo, both the movie and book characters. How do you feel about this idea of naming winter storms?
Many wildfires burn unnoticed in remote forests and grasslands, far from major population centers. Satellites detect the majority of them, but in many cases, images of the fire from the ground are scarce.
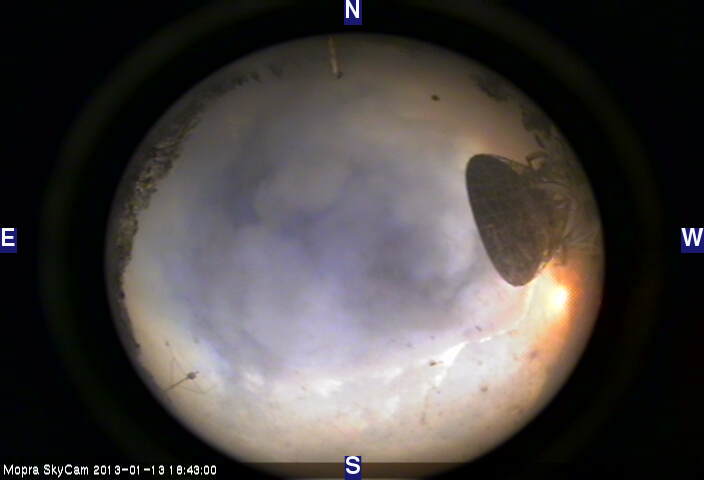
Not so for an Australian bushfire in January 2013 that passed through the campus of Siding Spring Observatory in New South Wales. The world-class astronomy facility houses numerous powerful telescopes. They’re designed to peer out into space, but webcams on a few of the telescopes captured remarkable images of smoke billowing and flames blazing. See, for instance, the all-sky view from the MOPRA SkyCam shown above.
Other webcams around the observatory were also capturing images as the fire raged nearby. The video below, a time lapse of webcams compiled by Las Cumbres Observatory Education Director Edward Gomez, offers a remarkable perspective on the blaze. For more, on-the-ground coverage of the fire, see the Astropixie blog.
Whether it was retreating ice, super storms, wildfires, or the simple changing of the seasons there was no shortage of fascinating, beautiful, and occasionally ominous imagery in 2012. Throughout the year, we published more than 600 images. Of those, the ten most popular (based on the number of page views) are below. Click on each image for more details and a full caption. Plus, you can browse through our Image of the Day archives month by month in case you missed some and want to catch up.
1 — City Lights of the United States 2012
Updated for 2012, this map of lights across America has a least 10 times better resolution than previous maps.

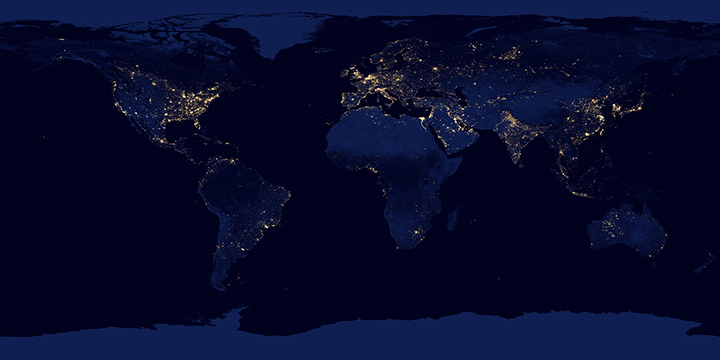
2 — Nights Lights 2012, Flat Map
The lights of cities and villages trace the outlines of civilization in this global view.
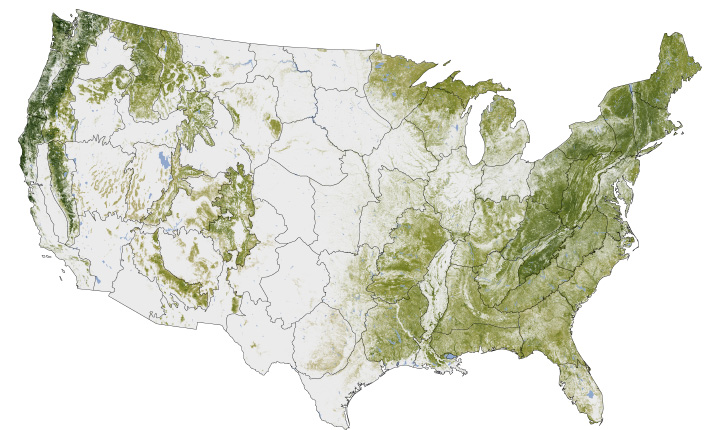
3 — Where the Trees Are
The National Biomass and Carbon Dataset reveals the location and the carbon storage of forests in the United States.
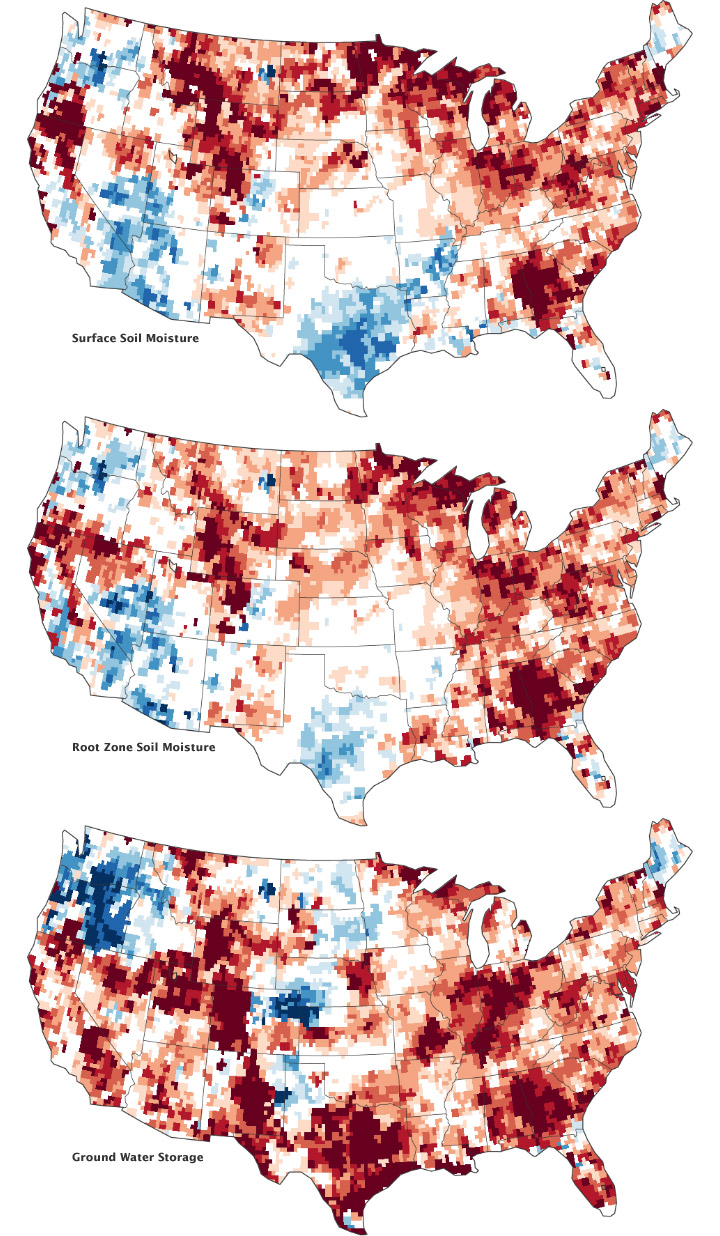
4 — Signs of the U.S. Drought are Underground
Nearly two-thirds of the continental United States suffered some form of drought in the summer of 2012.
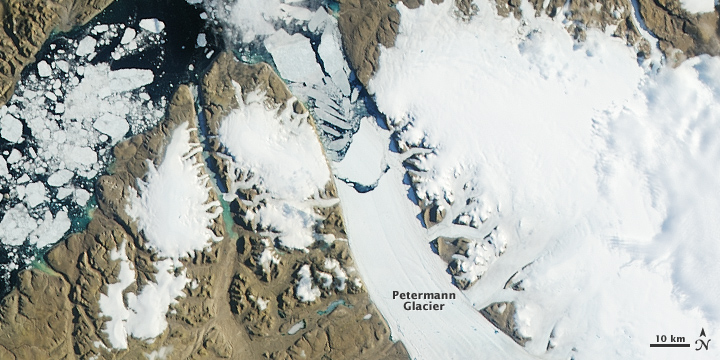
5 — More Ice Breaks off of Petermann Glacier
A new chunk of Petermann Glacier broke off in July 2012, two years after another large ice island was launched. In the same week, the surface of the Greenland ice sheet experienced unusually widespread melting and some flooding along rivers.
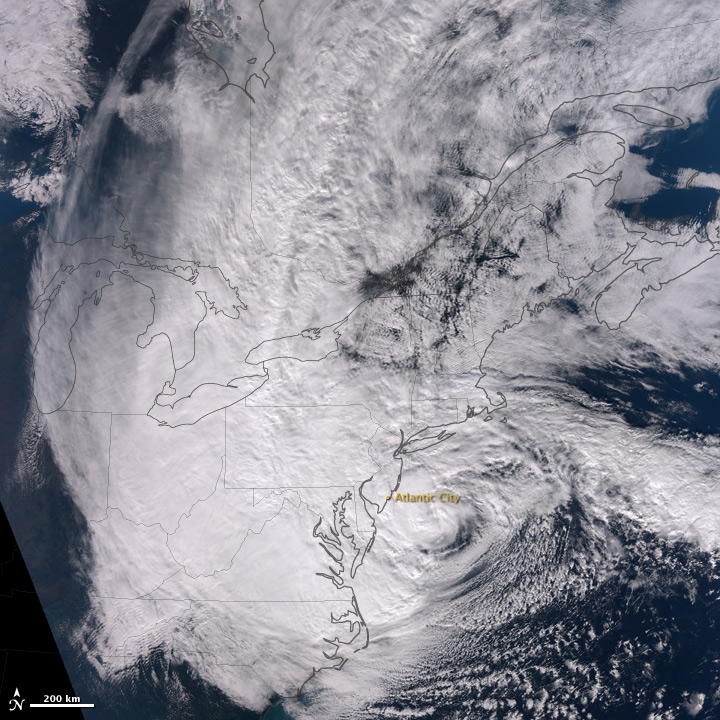
6 — Hurricane Sandy
Acquired October 29, 2012, this natural-color image shows Sandy shortly before landfall on the U.S. East Coast .
7 — Night Lights 2012: Black Marble
This animated globe shows the city lights of the world as they appeared to the new Suomi NPP satellite, which has at least 10 times better light-resolving power than previous night-viewing satellites.

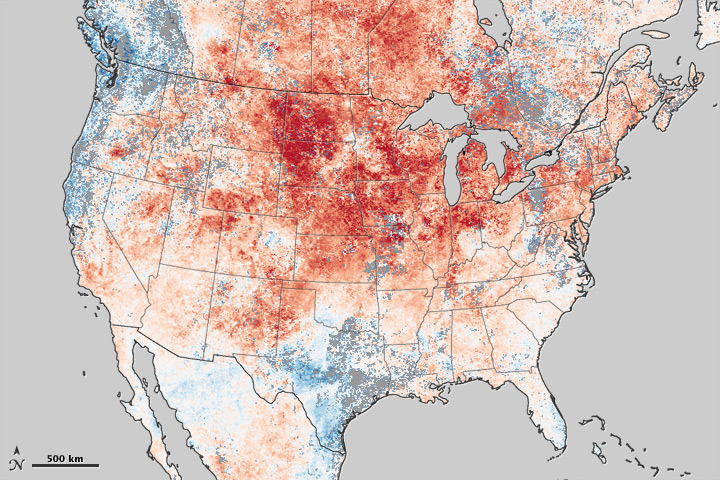
8 — Historic Heat in North America Turns Winter to Summer
The winter and early spring of 2012 brought record-setting high temperatures over much of United States and Canada.
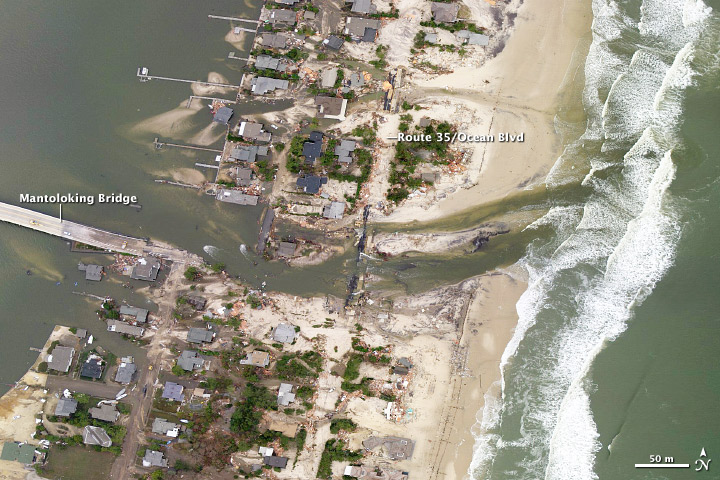
9 — A Changed Coastline in Jersey (aerial photo)
Hurricane Sandy cut a new channel and wiped out houses in the town of Mantoloking, New Jersey.
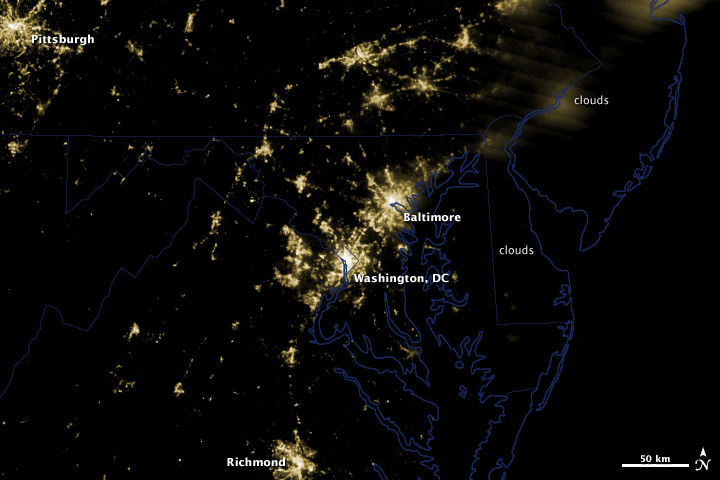
10 — Power Outages in Washington, DC
A potent line of thunderstorms knocked out power for millions of households in the U.S. Midwest and Mid Atlantic on June 29, 2012.
The following is a cross-post of a news release written by our colleagues Rob Gutro and Laura Betz in NASA public affairs and Suomi NPP outreach…
As Hurricane Sandy made a historic landfall on the New Jersey coast during the night of October 29, the Visible Infrared Imaging Radiometer Suite (VIIRS) on NASA/NOAA’s Suomi National Polar-orbiting Partnership (Suomi NPP) satellite captured this nighttime view of the storm. This image, provided by University of Wisconsin-Madison, is a composite of several satellite passes over North America taken 18 hours before Sandy’s landfall.

The storm was captured by a special “day-night band,” which detects light in a range of wavelengths from green to near-infrared and uses filtering techniques to observe dim signals such as auroras, airglow, gas flares, city lights, fires and reflected moonlight. City lights in the south and mid-section of the United States are visible in the image.
William Straka, associate researcher at Cooperative Institute for Meteorological Satellite Studies, University of Wisconsin-Madison, explains that since there was a full moon there was the maximum illumination of the clouds.
“You can see that Sandy is pulling energy both from Canada as well as off in the eastern part of the Atlantic,” Straka said. “Typically forecasters use only the infrared bands at night to look at the structure of the storm. However, using images from the new day/night band sensor in addition to the thermal channels can provide a more complete and unique view of hurricanes at night.”
VIIRS is one of five instruments onboard Suomi NPP. The mission is the result of a partnership between NASA, the National Oceanic and Atmospheric Administration, and the U.S. Department of Defense.
On Monday, Oct. 29, around 8 p.m. EDT, Hurricane Sandy made landfall 5 miles (10 km) south of Atlantic City, N.J., near 39 degrees 24 minutes north latitude and 74 degrees 30 minutes west longitude. At the time of landfall, Sandy’s maximum sustained winds were near 80 mph (130 kph) and it was moving to the west-northwest at 23 mph (37 kph). According to the National Hurricane Center, hurricane-force winds extended outward to 175 miles (280 km) from the center, and tropical-storm-force winds extended 485 miles (780 km). Sandy’s minimum central pressure at the time of landfall was 946 millibars or 27.93 inches.
Suomi NPP was launched on Oct. 28, 2011, from Vandenberg Air Force Base, Calif. One year later, the satellite has orbited Earth more than 5,000 times and returned images and data that provide critical weather and climate measurements of complex Earth systems. Suomi NPP observes nearly every location on Earth’s surface twice every 24 hours, once in daylight and once at night. NPP flies 512 miles (824 kilometers) above the surface in a polar orbit, circling the planet about 14 times a day. NPP sends its data once an orbit to the ground station in Svalbard, Norway, and continuously to local, direct-broadcast users.
For storm history, images, and video of Hurricane Sandy, please visit the following websites:
http://www.nasa.gov/mission_pages/hurricanes/archives/2012/h2012_Sandy.html
http://cimss.ssec.wisc.edu/goes/blog/
http://earthobservatory.nasa.gov/NaturalHazards/event.php?id=79504
October 14–20 is Earth Science Week. This annual celebration started in 1998, established by the American Geosciences Institute to help children, students, and the general public understand how geoscientists collect information about our planet.
In 2012, the theme is “Discovering Careers in the Earth Sciences” and involves activities by NASA, the U.S. Geological Survey, the National Park Service, and multiple professional associations. Online resources for Earth Science Week include tools for teachers, students, and the media. Highlights of Earth Science Week 2012 include National Fossil Day on October 17, Female Geoscientist Day on October 18, and Geologic Map Day on October 19.
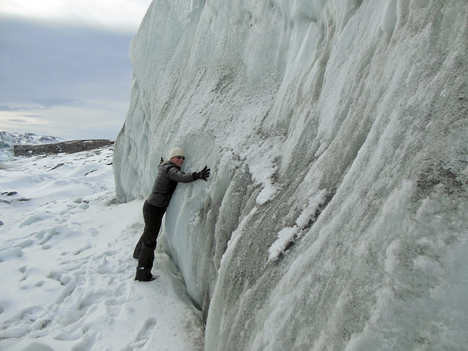
From the Global Climate Change Earth Science Week Blog: Explorer Christy Hansen hugs the Russell glacier, part of the Greenland Ice Sheet. Image courtesy Christy Hansen, JPL
NASA plays an active role in the celebration, hosting activities and offering an ESW web site with a blog, an events page, a videos page, and explorer articles. These resources (including several in Spanish) introduce visitors to NASA’s Earth Explorers — scientists, engineers, educators, multimedia producers, and writers — who describe their work, their motivations for studying our planet, and the kinds of challenges they face on a daily basis.
The schedule of NASA-sponsored events includes:
