
Every year, a group of scientists affiliated with the Global Carbon Project give Earth something like an annual checkup. Among the key questions they address: how much carbon is stored in the atmosphere, the ocean, and the land? And how much of that carbon has moved from one reservoir to another through fossil fuel burning, deforestation, reforestation, and uptake by the ocean each year?
All of the latest findings—including the data for 2020, a year like few others—are available here, including links to dozens of interesting charts and a peer-reviewed science paper. Ben Poulter, a NASA scientist and member of the Global Carbon Project team, summarized the findings this way: “The economic effects of COVID-19 caused fossil fuel emissions to decrease by 7 percent in 2020, but we continued to see atmospheric CO2 concentrations increase, by 2.5 ppm, or about 5.3 PgC. This means that the remaining carbon budget to avoid 1.5 or 2 degrees warming continues to shrink, and that we need to continue to monitor the land, ocean, and atmosphere to understand where fossil fuel CO2 ends up.”
Below are 10 key findings from the most recent report. (Note: the Global Carbon Project team synthesizes a broad range of data, some of which requires time-consuming processing, quality-control, and analysis. While they do report some 2020 numbers, the most recent full year of data available for others is 2019.)

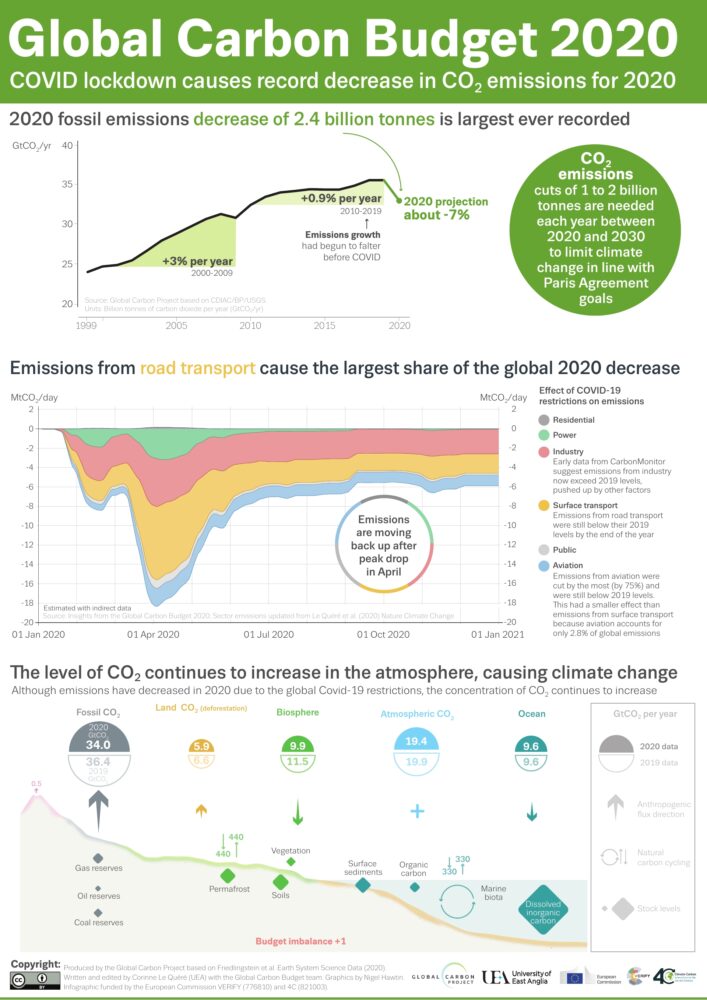
- Due to COVID-19 economic impacts, global fossil CO2 emissions declined by approximately 2.4 billion metric tons in 2020, a record drop. Fossil CO2 emissions declined by 11 percent in the European Union, by 12 percent in the United States, by 9 percent in India, and 2 percent in China.
- The global atmospheric CO2 concentration rose by 2.5 parts per million (ppm) in 2020 to reach 412 ppm averaged over the year. That puts it 48 percent above pre-industrial levels, 16 percent above 1990 levels, and 3 percent above 2015 levels.
- The growth rate in atmospheric CO2 concentration in 2020 was near the 2019 growth rate, despite slightly lower anthropogenic emissions.
- The land and oceans combined to absorb more than half of the CO2 emitted to the atmosphere (54 percent in 2020). While this can slow global warming, it leads to ocean acidification.
- Total CO2 emissions from human activities (fossil CO2 burning and land-use change) were around 40 billion metric tons in 2020. That compares to 43 billion tons in 2019.
- The growth of forests on abandoned farmland removed nearly 11 billion metric tons of CO2 in 2020. However, deforestation caused the equivalent of 16 billion tons of CO2 emissions.
- Land-use change emissions rose in 2020, predominantly in tropical regions. These emissions came from several areas, particularly Latin America, Sub-Saharan Africa, and Southeast Asia.
- Many economic sectors that produce fossil fuel carbon emissions returned to pre-COVID levels by the end of 2020, including the residential and power sectors. One exception was ground transportation, where declines persisted throughout 2020.
- Countries have a broad range of per capita emissions reflecting their national circumstances. The United States has the highest per capita emissions.
- Five years since the adoption of the Paris Agreement, growth in global fossil CO2 emissions have begun to falter. For the decade prior to 2020 (2010-2019), fossil CO2 emissions were decreasing significantly in 24 countries with growing economies.

The Global Carbon Budget is produced by more than 80 researchers working from universities and research institutions in 15 countries. Observations from several NASA satellites, sensors, aircraft, and models were among the sources of information used to formulate the 2020 budget. Sources of information supported by NASA included: the MODIS sensors on Aqua and Terra satellites, the Global Fire Emissions Database (GFED), the LPJ land surface carbon exchange model, Landsat, the LUHv2 land-cover change model, the CASA land surface carbon exchange model, ODIAC fossil fuel emissions data, the MERRA-2 reanalysis, the Cooperative Global Atmospheric Data Integration Project, and OCO-2.
Tags: carbon, carbon dioxide, climate
If the Mass reaches the weight of the moon or more, the earth will suffer! Pulling on the earth has a lot of affects to the earth. One is our high and low tide, caused by the moon. The moon is not a very big rock. And I would have to say, the moon also pulls on the earths internal liquid called magma which causes the flow to turn the opposite direction our earth is spinning. This in turn, creates our earth’s magnetic field. So, if you want more earthquakes and severe storms, keep putting space junk (tonnage) in our orbit to pull on the earth. All countries want in on the action. Hell, build motels, space stations, and all kinds of great things on the moon and make it super heavy. See what happens then! It needs to be cleaned up, and found out what’s wrong with our bees.