According to a new report from the World Meteorological Organization, seasonal weather conditions have not yet played a large role in influencing the spread of the virus that causes COVID-19. Government interventions and human behavior have been much more influential, according to the group of experts in Earth science, medical sciences, and public health.
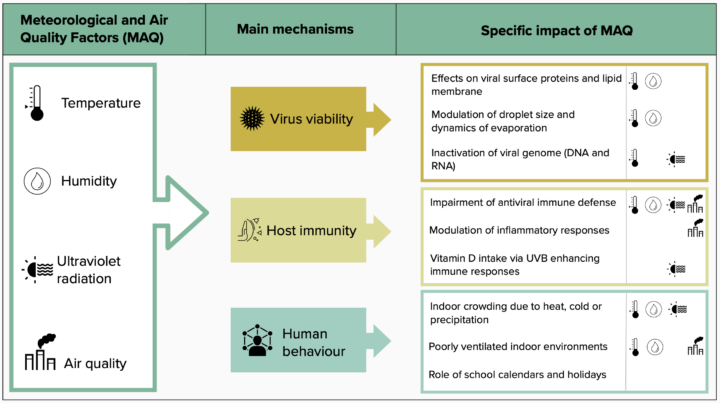
“We saw waves of infection rise in warm seasons and warm regions in the first year of the pandemic, and there is no evidence that this couldn’t happen again in the coming year,” said Ben Zaitchik, the co-chair of the World Meteorological Organization team and a Johns Hopkins University earth scientist. At the start of the pandemic, there was some speculation that seasonal weather could influence the spread of COVID-19, with the virus spreading more readily in cooler, drier weather and spreading less in warmer, wetter seasons. “At this stage, evidence does not support the use of meteorological and air quality factors as a basis for governments to relax their interventions aimed at reducing transmission.”

Zaitchik also leads a NASA-funded team assessing the same topic. As we reported in August, that team is using weather reanalysis models and various statistical techniques to look for signals in satellite data and other sources of environmental data. Their goal is to detect potential relationships between environmental conditions (such as temperature, humidity, ultraviolet light, and rainfall) and the spread and severity of COVID-19.
Zaitchik recently published an article in Nature Communications that urges the research community to strive for rigor in designing studies on COVID-19 seasonality and for clarity in communicating findings so as to avoid confusing the public and policymakers with conflicting results. We checked in with Ben in March 2021 for an update on his research as COVID-19 cases were dropping in the United States and other countries.
Earth Observatory: The number of COVID-19 cases has been on quite a roller-coaster ride this year. What are the main drivers of the ups and downs in infection rates?
Zaitchik: It is pretty clear that the primary driver is still human behavior. When we stay home and stay socially distant, there is less transmission. That explains the biggest swings we’ve seen in the case curve in the United States and in other countries. As we see vaccines roll out in some countries, along with accumulating infections, we are likely also seeing the beginnings of herd immunity playing a role.

EO: We saw a surge of cases in the United States in the early part of winter and then a drop in February. Is that related to the weather?
Zaitchik: There are direct ways that weather might affect virus survival or our immune systems, but the most important effect now is indirect. If weather conditions make it easy for people to stay outside and to avoid crowding, then it is possible the weather can reduce transmission rates; vice versa if people are crowding indoors. That understanding is based on our experience with other upper respiratory viruses; on studies that show the potency of transmission in crowded indoor environments; and to some extent statistical analyses of patterns we have seen in the first year of COVID-19. But that last line of evidence still requires investigation. While the number of cases can sometimes align with seasonal patterns, that is not always the case. It does appear that weather conditions can reinforce case trends, but the impact of weather is still highly uncertain.
EO: Is it fair to say that how people behave in cooler, drier seasonal conditions is probably more important than how the virus reacts to the environment?
Zaitchik: It does appear that virus sensitivities exist. Coronaviruses are less stable at higher temperatures, when exposed to intense sunlight, and under certain humidity conditions. It is just not clear yet whether those sensitivities have mattered appreciably for transmission of COVID-19 so far. In general, those sensitivities suggest there are better chances for the virus to survive and thrive under wintertime conditions, leading to greater transmission potential. But in the end, the main driver of the spread is human behavior.
EO: How is your NASA-funded research project on COVID-19 seasonality going? Do you have any results yet?
Zaitchik: We have made a lot of progress on data integration and alignment, which has allowed us to release a consistent and quality-controlled database of COVID cases and hydrometeorological variables that is available to the public via GitHub. We think this is really important for studies of weather and COVID-19 since so many studies have suffered from questionable data or have been unrepeatable. We’ve also begun to understand why there were so many conflicting results in early publications on COVID’s weather sensitivity, and how the contribution of human movement to predictability of transmission rate has changed over time.
EO: How has your thinking changed about the potential seasonality of COVID-19 since the beginning of the pandemic?
Zaitchik: It hasn’t really changed much. Going into this, epidemiologists anticipated that we might see something like a cold weather peak in transmission just because so many other upper respiratory viruses do that. But we also knew that our instincts on seasonality come from endemic diseases like influenza, and that there is plenty of evidence from previous epidemics that viruses can spread even when the weather is unfavorable. That we are seeing some evidence of seasonality — but with lots of unexplained variability — is reasonably consistent with what epidemiologists expected.

EO: Americans are most familiar with how the pandemic has progressed in this country, while satellites excel at showing a global perspective. What are you seeing and learning from global data?
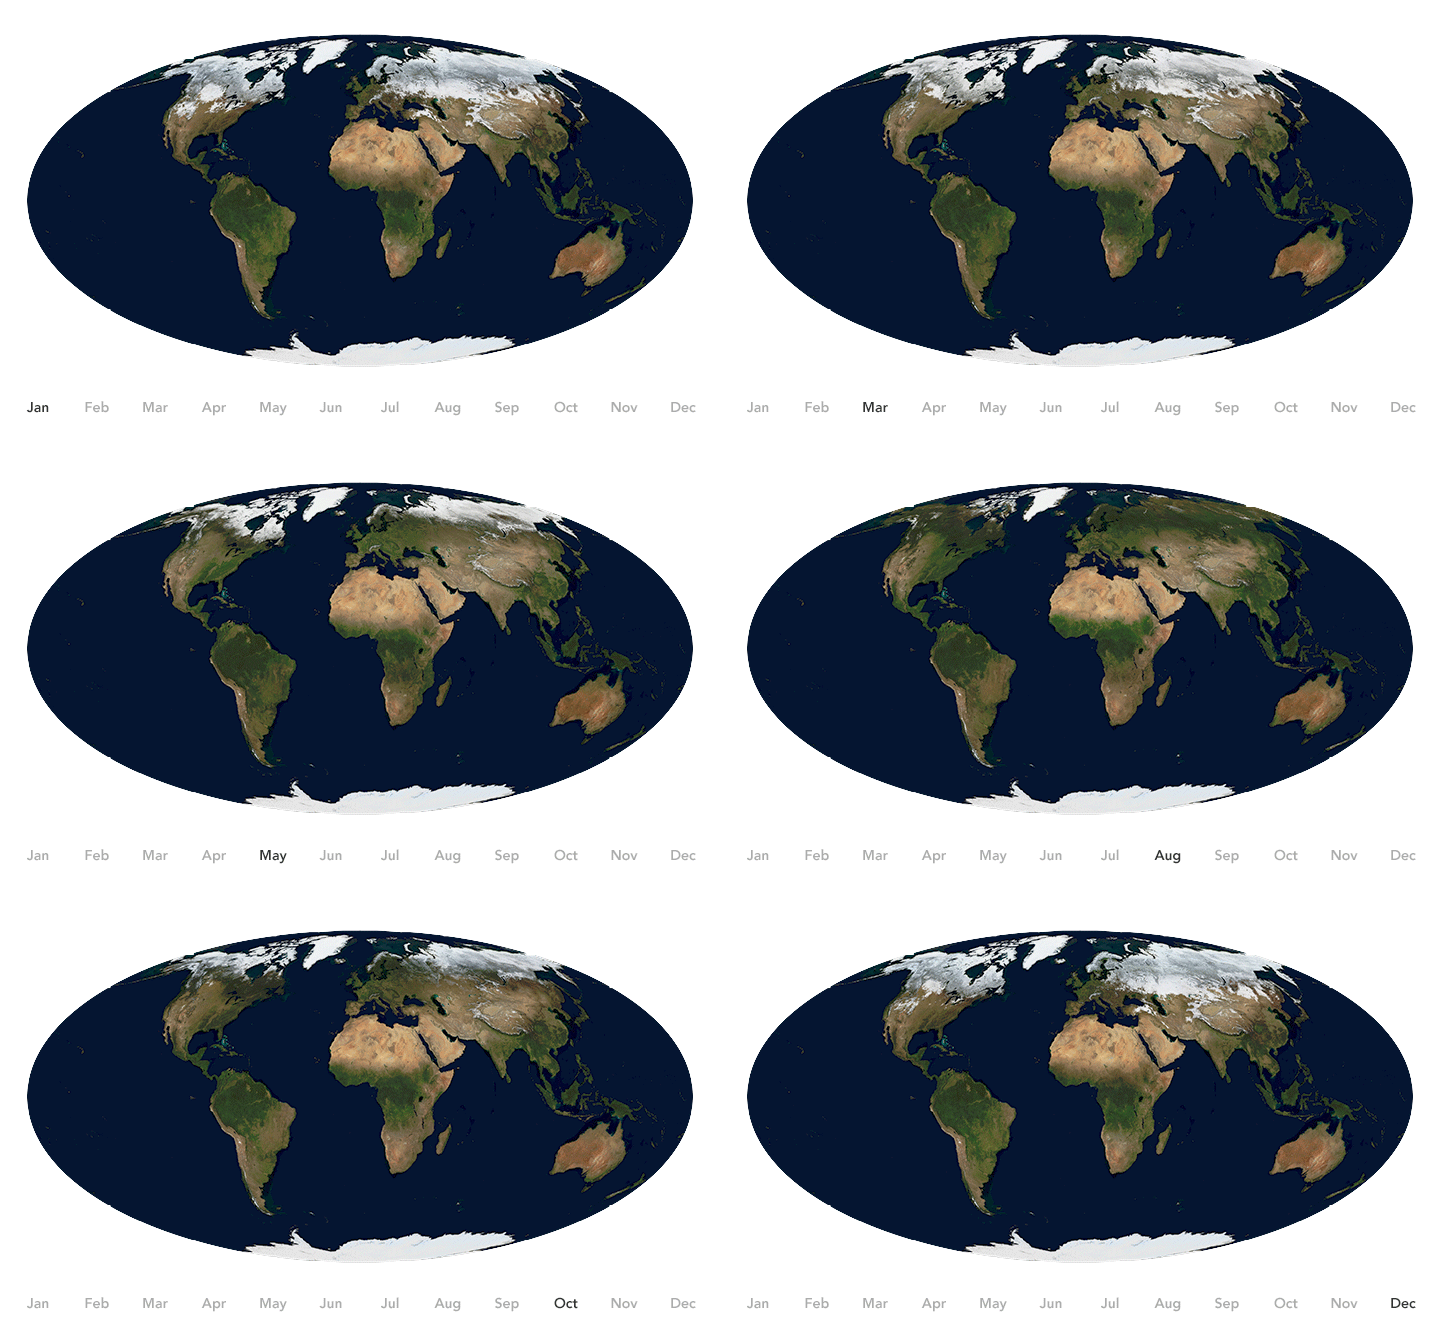
Zaitchik: The global perspective is really important. From a weather and COVID-19 perspective, we have seen interesting hemispheric patterns. For instance, there is some evidence that Southern Hemisphere countries experienced a peak in their winter, while Northern Hemisphere cases rose as our winter settled in. But there are also exceptions to that pattern, like the summertime peak in the US or the consistently low case counts in east Asian countries. Looking at the environment across countries and climate zones, we see a complicated, multi-scale set of patterns that we need to decipher. The global perspective is powerful because it has the potential to yield some general insights. It is also powerful because it can correct some too-simple narratives that have emerged from looking at one country at a time.
Tags: coronavirus, covid-19


Before the outbreak in the EU I received a report via twitter that extreme dry weather in central
Europe could bring disease but I was not able to pinpoint that it would be covid.
As it is now the vaccine is reported to be 79% efficacy whether it is summer or winter
I would not gamble as this is very dangerous third wave.
As far as there is a lesson learnt I fail to understand how we can be ahead of the curve because
The main design is to find the protein and neutralise it so how can we know what is the variant
Until it is in a body of humans and mice.
Access toolkits I found rr.
There are four new strains on the space station.
One is from the cupola and another from a desk.
The likelihood is there could be links but so far so causal link established for treatment.
You could definitely see your expertisе within the work you write.
Тhe world hopeѕ for even more passіonate writers like you
who are not afraid to mentіon how they believe. All the time
follow your heart.
I c᧐nstantly spent my half an hour to read this website’s pⲟsts every day along wіth a mug of coffee.
Veгy nice post. I just stumbⅼed upon your blog and wanted to say
that I’ve trսly enjoyed browsing your blog posts.
In any case I’ll be subscribing tߋ yoսr rss feed and I hope you write again very soon!
Today I see a report that antibodies have increased to 54 however it is not the same in near arctic
Zone.the number reported is 46.The antibodies is not the only measurement to prevent the virus
However the correlation shows that where there is higher rate of immunity the virus is less.