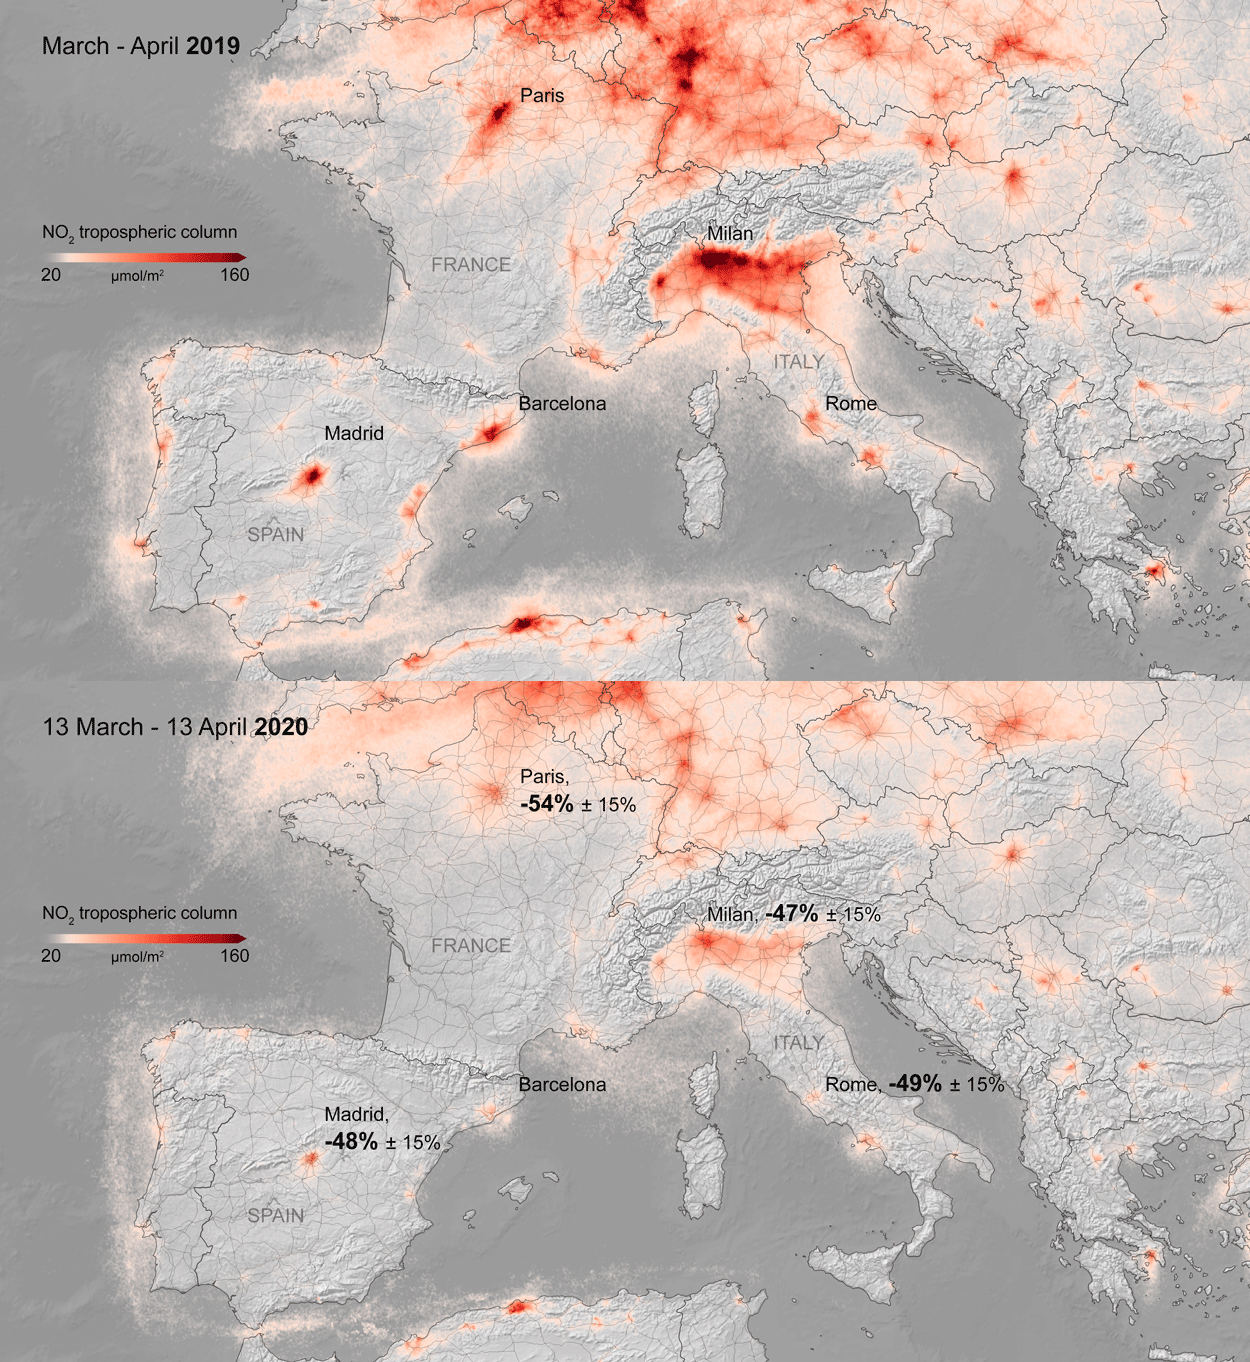
NASA, the European Space Agency (ESA), and the Japan Aerospace Exploration Agency (JAXA) have joined forces to create the COVID-19 Earth Observation Dashboard. The web platform combines the collective scientific power of the agencies’ Earth-observing satellites to document changes in the environment and society in response to the pandemic.
The dashboard is a user-friendly tool to track changes in air and water quality, climate change, economic activity, and agriculture.

Air quality changes were among the first noticeable impacts of pandemic-related stay-at-home orders, and the resulting reductions in industrial activity, that could be tracked through satellite observations. Reductions in nitrogen dioxide (NO2) levels — primarily related to temporary reductions in the burning of fossil fuels — show up clearly in satellite data.
A preliminary analysis also indicates that planting (farming) activity dropped during the quarantines and lockdowns. For example, the cultivated area of white asparagus in Brandenburg, Germany, has been 20 to 30 percent lower this year, compared to 2019. More information on agricultural productivity changes will be added to the dashboard in the months to come.

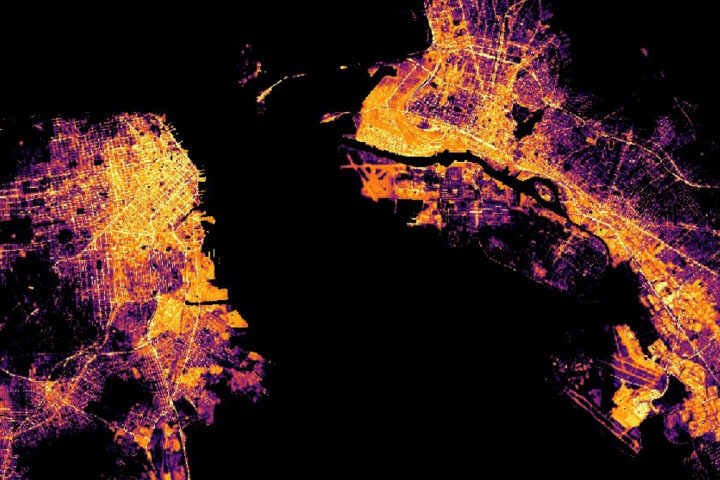
Recent water quality changes have been reported in a few locations that typically have intense industry and tourism — activities that have decreased during the pandemic. Data on ship identification, construction activity, and nighttime lights (above) are featured on the dashboard to keep track of some of the economic ramifications of the virus.
Together, ESA, JAXA, and NASA will continue to add new observations to the dashboard in the coming months to see how these indicators change. Learn more in the NASA press release, the video below, or by exploring the dashboard.
Tags: coronavirus, covid-19, dashboard, data, earth data, ESA, European Space Agency, JAXA, NASA, satellite


nice article