 |
|||
|
Each year, the North Atlantic Ocean announces springtime by producing “blooms” large enough to be seen from space. These explosive increases in microscopic marine algae, called phytoplankton, appear as sudden bright blossoms in satellite imagery. Phytoplankton blooms occur in all the Earth’s oceans when nutrient and sunlight conditions are right. Although scientists have been able to view these blooms through satellite data for the past 25 years, they could not get much detail about phytoplankton health. The latest development in oceanographic remote sensing, however, enables researchers to detect the glow, or phytoplankton fluorescence, from chlorophyll.
“I think the most exciting advance in remote sensing is fluorescence from space,” said Mark Abbott, professor and dean in the College of Oceanic and Atmospheric Sciences at Oregon State University. “This is the first time we’ve been able to measure physiological changes in phytoplankton communities rather than just population increases.”
|
August 8, 2003
Image in title graphic (Rhabdonema minutum diatom) courtesy of Alg@line: Operational Monitoring of the Baltic Sea Environment (A new browser window will open.) |
||
|
Like other plants, phytoplankton use photosynthesis to grow. During photosynthesis, the green pigment chlorophyll absorbs light, which allows plants to produce organic carbon (carbohydrates) from carbon dioxide and water. The amount of organic carbon plants produce is called primary productivity. |
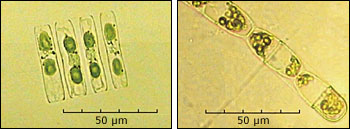
Different phytoplankton species take diverse forms, including Navicula vanhoeffenii (left) and Melosira juergensii (right). Images courtesy of NOAA’s Dominant Phytoplankton Taxa of the Arctic Seas (A new browser window will open.) | ||
|
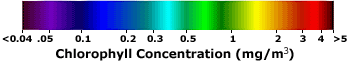
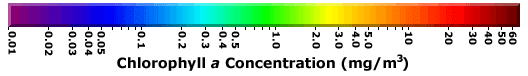
Ocean remote sensing instruments measure primary productivity by determining the amount of light absorbed by phytoplankton chlorophyll. Sunlight enters ocean water, bounces around on particles, phytoplankton, and water molecules, then bounces back up toward space. The instruments detect variations in the intensity of light, called ocean color, at the ocean surface. The first remote sensing instrument designed to survey ocean color, the Coastal Zone Color Scanner (CZCS), operated from 1978 to 1986. The Sea-viewing Wide Field of View Sensor (SeaWiFS) was launched in 1997 and is still operational. These instruments measure light absorption at particular wavelengths (bands). Specific bands on each sensor detect chlorophyll absorption. As the concentration of chlorophyll increases, satellite images show the ocean surface changing from blue to shades of green. To illustrate these changes, most ocean color imagery uses a color palette ranging from purple to orange or red as chlorophyll concentration increases. One of the initial challenges in ocean color remote sensing was determining the difference between phytoplankton chlorophyll and dissolved organic matter, called gelbstoff. A high concentration of gelbstoff affects how much sunlight penetrates the water, which impacts the growth of phytoplankton populations, and can present a false signal in the satellite’s color measurements of chlorophyll. “If you’ve ever raked leaves and put them in a bucket of water, you see the water turn yellow over time — the yellow color is gelbstoff,” said Ken Carder, professor of ocean optics at the University of South Florida. Carder has developed an algorithm, called chlor-a 3, that distinguishes between gelbstoff and chlorophyll by measuring the chlorophyll a molecules. “CZCS didn’t have the ability to separate gelbstoff from phytoplankton. High concentrations of gelbstoff looked just like chlorophyll,” Carder said. “So CZCS and SeaWiFS historically overestimated the amount of chlorophyll, and chlor-a 3 now adjusts for that.” Using data from the chlorophyll bands on CZCS and SeaWiFS, researchers could track the size and movement of phytoplankton populations, but they could not determine phytoplankton health or efficiency. What scientists needed was fluorescence data, which is now available from the Moderate Resolution Imaging Spectroradiometer (MODIS), launched in 1999.
Carder and Abbott are both members of the MODIS Ocean Science Team, based at the Goddard Space Flight Center (GSFC) in Greenbelt, Maryland. The GSFC Earth Sciences (GES) DAAC archives and distributes oceanographic data from CZCS, SeaWiFS, and MODIS. Along with other team members, Carder and Abbott are working on new models of primary productivity using MODIS fluorescence data.
|
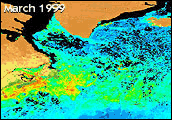 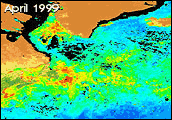 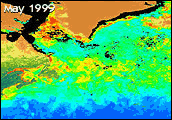 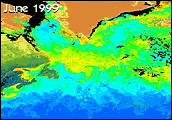 SeaWiFS captured the progression of the North Atlantic Bloom between March and June 1999. Images courtesy of the GSFC Earth Sciences DAAC’s North Atlantic Bloom (A new browser window will open.) |
||
|
Monitoring fluorescence can help scientists describe the physiological state of phytoplankton, determine the cause of population decreases, and make accurate estimates of primary productivity on a global scale. Abbott explained, “Phytoplankton can do three things with absorbed light: use it to conduct photosynthesis, turn it into heat, or emit light (glow) in the red portion of the spectrum called fluorescence. The relative balance of these processes tells us about the health of the phytoplankton. Relatively low fluorescence indicates a healthy area.” When phytoplankton cells absorb light efficiently for photosynthesis, they have less light energy available for fluorescence. Therefore, researchers can evaluate phytoplankton health by looking at fluorescence levels. |
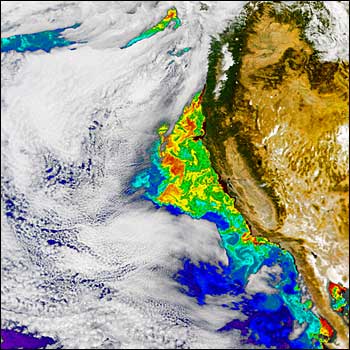
This false-color SeaWiFS image, acquired on October 6, 2002, shows a phytoplankton bloom off the California coast. Blue indicates low chlorophyll concentrations, and yellow and red indicate significantly higher values. Image courtesy of James Acker, Goddard Space Flight Center | ||
  |
|||
|
Different species of phytoplankton fluoresce at different rates, called fluorescence quantum yield. Phytoplankton use light differently as the amount of sunlight changes from sunrise to sunset and from sunny days to cloudy days. “As phytoplankton age or the availability of nutrients decreases, they become less healthy and the amount of fluorescence may increase,” Abbott noted. While ocean color remote sensing instruments can detect blooms and track their progress, fluorescence data provide more specific information about how phytoplankton use light. This information could lead to more accurate models of primary productivity and give scientists a better idea of how ecosystem changes affect algal populations. “MODIS is the first satellite sensor to measure chlorophyll fluorescence from space,” said Abbott. “Fluorescence is an indicator of phytoplankton health, and we’ll be able to use that to improve estimates of phytoplankton productivity — and to understand how the ecosystem is responding to changes in its physical environment.” College of Oceanic and Atmospheric Sciences at Oregon State University. Accessed July 7, 2003. College of Marine Science at the University of South Florida. Accessed July 25, 2003. |
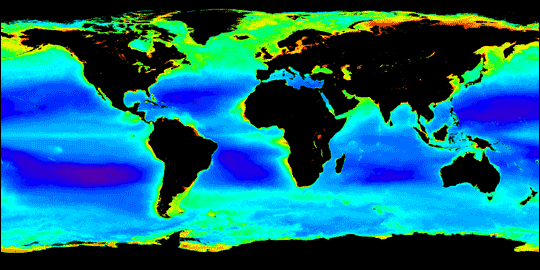
This SeaWiFS image shows average chlorophyll a concentration from October 1997 to April 2002. Image courtesy of the SeaWiFS Image Gallery (A new browser window will open.)
For more information, visit: GSFC Earth Sciences DAAC MODIS Web SeaWiFS Project (A new browser window will open for each.) |
||