|
|
|||
|
Nestled in the Himalaya Mountains, Kashmir inhabits a crossroads between the Middle East and Asia. Kashmir’s valleys and snow-clad peaks have historically hosted divergent cultures and housed scholarly learning centers. Its natural resources and complex heritage have attracted tourists and border disputes; the region is administered by the neighboring countries of Pakistan and India. |
Originally published by Earth System Science Data and Services. |
||
 |
|||
|
Kashmir also inhabits another crossroads: It lies atop a web of active geological faults with underground dynamics that rival the complexities above ground. On October 8, 2005, one of the faults—places underground where the rocks are weak or cracked—gave way, resulting in a magnitude 7.6 earthquake. In a matter of seconds, the rugged terrain that lures travelers became a disaster zone that soon would host relief workers providing food and shelter, military rescue operations airlifting supplies, and scientists seeking to understand how the earthquake happened. |
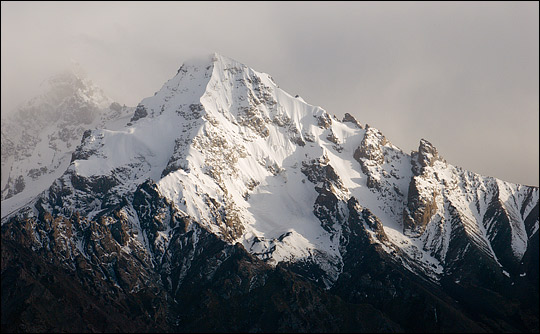
Kashmir is a land of high mountains, natural beauty, and ancient cultures. Although they appear timeless, the snowy peaks—and the people that live among them—continue to be shaped by the force of colliding continents. (Photograph ©2006 sanjoyg.) |
||
 |
|||
|
After a major earthquake, scientists have traditionally relied on ground surveys to understand the damage. But satellite imagery is producing increasingly accurate ways to spot exposed faults and map deformation caused by earthquakes, especially in remote areas like Kashmir. What scientists learn by studying earthquake geology and post-earthquake deformation can advance what we know about earthquake dynamics and provide valuable information to relief organizations. Anatomy of an EarthquakeKashmir lies on the boundary of two colliding tectonic plates: the small Indian plate that underlies most of India and Pakistan, including much of Kashmir; and the vast Eurasian plate that underlies Europe, China, Russia, and much of the Middle East. Jean-Philippe Avouac, a geologist, a professor at the California Institute of Technology, and Director of Caltech’s Tectonics Observatory, studies Asian earthquakes and tectonics. Avouac said, “Northern India is being thrust under the Himalaya, and the mountains are being pushed up by this motion. It’s a small increment of deformation, which over millions of years has built the Himalaya range.” This slow-motion collision created one of the planet’s most active earthquake hotspots; as the plates collide, stress builds up in the fault zones where the plates meet. |
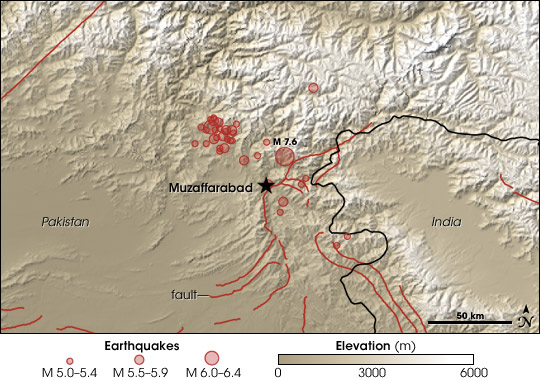
On October 8, 2005, a magnitude 7.6 earthquake (large circle) and a series of aftershocks (small circles) struck Kashmir near the city of Muzaffarabad, Pakistan. The earthquakes occurred along the faults (red lines) that underlie the southern margin of the Himalaya. (NASA map by Robert Simmon, using SRTM elevation data and USGS earthquake locations.) |
||
 |
|||
|
Sudden and rapid releases of seismic stress can cause large earthquakes. And sometimes, an abrupt movement along a shallow fault can rupture the surface, as happened during the 2005 Kashmir earthquake. This surface rupture extended for seventy-five kilometers (forty-seven miles) and was a first among earthquakes in the Himalaya seismic zone. Robert Yeats, a geologist at Oregon State University, traveled to Pakistan after the Kashmir earthquake and witnessed the damage caused by the rupture firsthand. Yeats said, “In the known historic and recent records, not one of the earthquakes in the Himalaya has ever produced a surface rupture, not in Nepal, or India, or anywhere. This rupture was the first one.” |
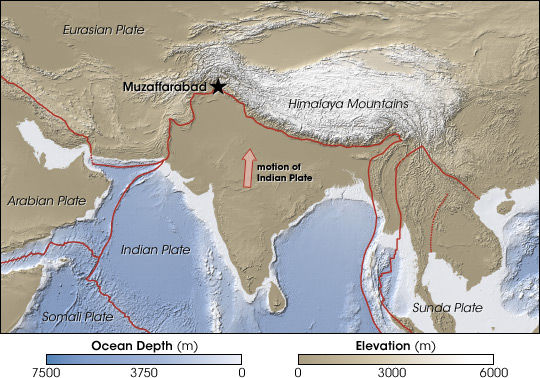
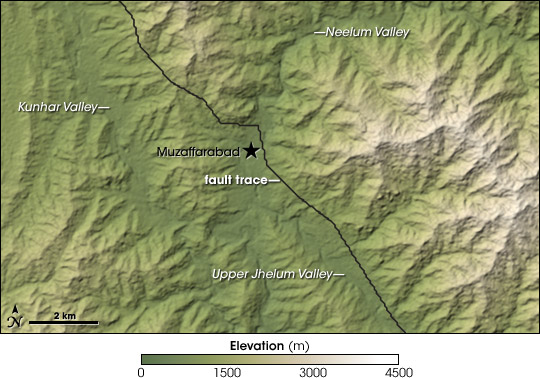
Muzaffarabad sits at the boundary between the slowly colliding Indian and Eurasian tectonic plates, both composed of thick continental crust. The pressure of the collision isn’t released gradually, but suddenly, when rocks that can no longer bear the stress crack. These forces make Kashmir one of the most earthquake-prone regions on Earth. (NASA map by Robert Simmon, from CleanTOPO2 data.) |
||
 |
|||
|
The Kashmir earthquake killed nearly 75,000 people, injured more than 100,000 people, and destroyed 3 million homes. Two towns that straddled the newly exposed fault suffered the most damage: Muzaffarabad and Balakot. In addition, the earthquake generated massive landslides that buried entire towns. Yeats said, “The upper side of the fault had a lot of landslides. Tens of thousands of people died because of landslides.” |
The 2005 Kashmir earthquake actually split the Earth’s surface. Geologists call this event a surface rupture. The rupture crossed a road in Balakot, Pakistan, about 20 kilometers (12 miles) north of Muzaffarabad. In some areas, the earthquake shifted the ground more than 5 meters (16 feet). (Photograph ©2005, Robert Yeats.) |
||
Mapping Deformation |
|||
|
Yeats, an earthquake expert, has a long history of working in Pakistan. After the 2005 Kashmir earthquake, he joined a team of researchers who were the first to map the fault line on the ground. The team returned to the area several times to walk the fault and record the resulting earthquake deformation. “In that kind of terrain, seventy-five kilometers [forty-seven miles] takes a long time to cover,” Yeats said. This traditional method of ground surveying can be difficult after an earthquake because the land surface has changed. Mapping ruptures typically means finding features that used to be continuous before the earthquake, like a road or fence. But in parts of Kashmir, few of these man-made features exist, meaning that the survey team had to find natural features that had been disrupted by the fault, like small crests or river gullies. |
|||
 |
|||
|
Because of the difficulties of ground surveying, researchers like Avouac are investigating how satellite imagery can aid ground surveys and rescue work by generating more immediate maps of earthquake deformation. In theory, observing earthquake deformation should be as simple as comparing two optical satellite images that show the land surface before and after the earthquake. However, correlating three-dimensional images is technically very difficult. Avouac said, “There are distortions in the images because of the topography and geometry of the terrain, the angle at which the satellite instrument is viewing the Earth’s surface, and the satellite’s motion.” When correlating the two images, all of these distortions produced visual offsets in the resulting image that the earthquake did not cause. |
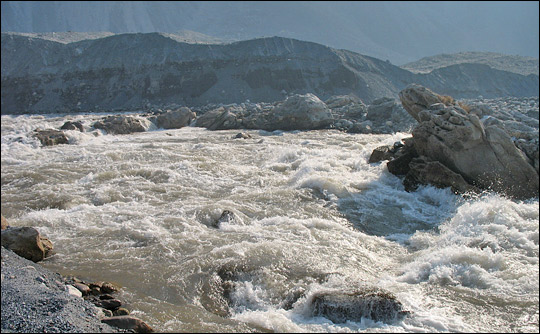
The Neelum River tumbles over rapids created by the earthquake, which lifted the river upstream of the rapids and lowered it on the downstream side. Yeats and his team used changes in natural features like riverbeds to map ground movement during the Kashmir earthquake. Geologists often map faults using post-earthquake breaks in man-made features like roads or fences, but few of those existed in the Kashmir earthquake zone. (Photograph ©2005 Robert Yeats.) |
||
 |
|||
|
Avouac’s team discovered that accurately correlating the images was not a simple process. To remove the distortions, the team needed to match geographic coordinates between the images and the ground; calculate the satellite’s position and motion; drape the images onto the corresponding portion of the Earth’s surface; and then compare differences between the two images. Avouac and his team refined these steps until they created a reliable technique that would accurately show the earthquake deformation without the visual distortions. |
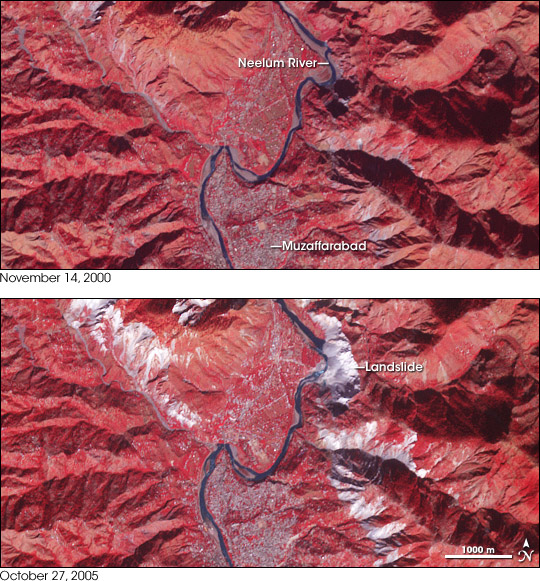
These satellite images show the area surrounding Muzaffarabad before (top) and after (bottom) the 2005 earthquake. The most obvious effect of the quake was a series of landslides, which appear white or light gray. The images are made from near-infrared, red, and green light. Vegetation is red, water is blue, and developed areas are gray. (NASA images by Robert Simmon, based on ASTER data.) |
||
 |
|||
|
The team applied this technique using imagery of the Kashmir area from the Advanced Spaceborne Thermal Emission and Reflection Radiometer (ASTER) aboard the NASA Terra satellite. Although Avouac has a variety of image sources to choose from, he frequently relies on ASTER images from the NASA Land Processes Distributed Active Archive Center (LP DAAC). He said, “I’ve switched to using ASTER because the community of users is much larger and because of the lower cost.” Avouac chose an image taken before the earthquake and compared it to a post-earthquake image captured on October 27, 2005. The results were successful, and correlated very well with the surface rupture measured by Yeats’ team. Avouac said, “We confirmed that our technique can provide information that may be very difficult to measure in the field but is critical for modeling earthquakes.” Remote answers to reliefEarthquake-stricken areas are notoriously difficult for relief workers to access because communication networks and infrastructure are damaged. Avouac hopes that the technique he and his colleagues developed can be used to hasten aid to future earthquake victims. He said, “Our technique provides detailed information that could be used by rescue teams to estimate whether a major town has been badly shaken or not.” Wiley Thompson, a lieutenant colonel in the United States Army serving in Afghanistan at the time of the quake, assisted with the disaster relief efforts. Thompson said, “As a disaster response coordinator, my goal was to get relief—the right kind of relief—to the people who needed it the most at that moment.” |
Avouac’s team compared satellite images from before and after the earthquake to trace the exact location of the fault on the Earth’s surface. The fault line generally angled from the northwest to the southeast, directly through Muzaffarabad. (NASA map by Robert Simmon, based on data from ASTER and COSI-Corr.) |
||
 |
|||
|
Having access to remote sensing and field studies can help relief workers zoom in on a crisis area. Thompson said, “You need to know where to go, so you don’t spend time going to places that weren’t the worst hit. I call it the flash-to-bang. From the first event to the first relief there, you want to minimize the time in between.” Researchers often try to deliver maps and data as soon after an earthquake as possible, but because many relief efforts evolve into long-term projects, new information can be helpful at any stage. New maps, for instance, may reveal damaged towns that were initially missed, but where relief is still badly needed. Thompson said, “Just because you don’t have definitive information right after an earthquake doesn’t mean it’s not going to do you some good later.” Recovering from the October 2005 Kashmir earthquake will likely take several more years, putting Kashmir once again at a crossroads, this time between the old and the new. Governments are razing old concrete block buildings and replacing them with modern structures designed to better withstand earthquakes. Relief organizations are helping relocate residents of towns destroyed by the earthquake to newly erected town sites. And scientists and researchers continue to focus on Kashmir and other earthquake-prone areas, mapping ancient geological faults and identifying new ways to examine an earthquake’s aftermath. Avouac said, “By studying these ruptures, we can learn more about the characteristics of future earthquakes, like what kind of ground motion we can expect.” Understanding how past earthquakes happened and how much damage they caused can help scientists estimate future seismic hazards and pinpoint areas with a high earthquake risk. They hope that this knowledge will eventually protect people living in areas with earthquakes.
About the Remote Sensing Data Used
|
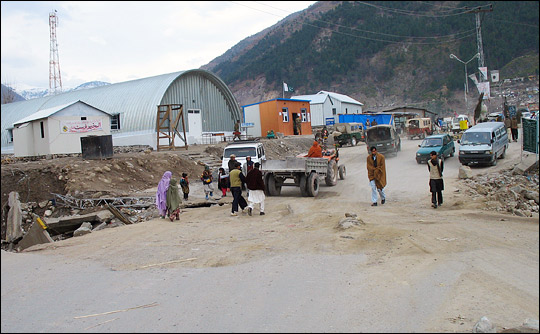
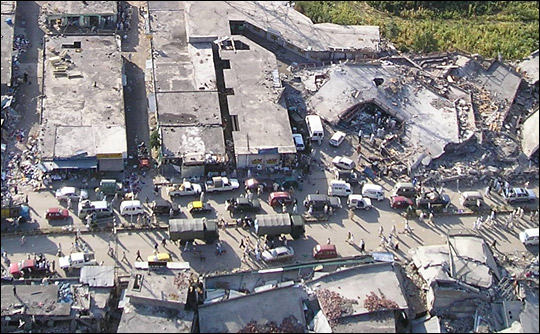
A line of vehicles jams the road through Balakot in the Kashmir earthquake’s aftermath. Satellite data help disaster-relief workers to quickly allocate resources to the worst hit areas and to avoid bottlenecks due to damaged or blocked roads. Researchers can also use satellite data to map potential hazards, enabling people to mitigate potential disasters. (Photograph ©2005 Wiley Thompson.) |
||
