 |
High Water:Building A Global Flood Atlas
| ||
The small plane droned loudly as it made its way from western Minnesota toward St. Louis in June 1993. Through his window, Dartmouth College geologist Bob Brakenridge glimpsed the white dome of a grain silo that seemed to float like a bleached lily pad on a muddy, inland sea. Everywhere he looked water sloshed up the sides of houses, swallowed fields full of early-season crops, transformed roadways into canals. It was tempting to just stare out the window and gawk at the greatest flood in the recorded history of the Upper Mississippi. |
|||
 | |||
But he hadn’t bought eight hours of flying time just for sightseeing. He was a scientist on a mission. Brakenridge, a geologist who specializes in studying the shape and structure of the topography produced by rivers, wanted to see how well satellite imagery of the floods matched up with the conditions on the ground. The idea had been floating around in the back of his mind since 1991, when he had spent a year as a visiting senior scientist at NASA Headquarters in Washington, D.C. All day he had been looking for boundaries—locations where the line between flooded areas and dry land was obvious. He directed the plane’s young pilot to an area that looked promising. A powerline whizzed by the window as they dropped down from 900 feet for a closer look. He found their current location on a grainy radar image, and nodded with satisfaction at the pattern that was emerging: against the lighter colors of dry land, flood waters stood out in black. |
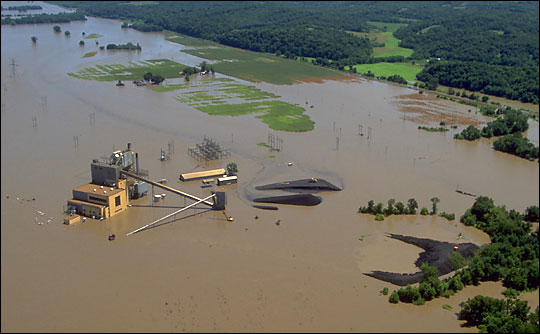
The great floods of 1993 inundated 80,000 square kilometers (20,000,000 acres) of land along the Missouri and Mississippi Rivers. This aerial photograph of a flooded power plant along the Mississippi only hints at the extent of the disaster. Because of the vast area covered by water, scientists turned to satellite remote sensing to map the floods. Remote-sensing techniques developed to study the 1993 Mississippi floods are now used to map floods worldwide. (Photograph courtesy FEMA photo library) | ||
“When that flood began, so many scientists just dropped whatever they were doing and focused on the Mississippi,” Brakenridge recalls. “I contacted NASA and asked for help in getting imagery from ERS-1 [European Remote-sensing Satellite-1], and then I quickly applied for a small grant from the Association of American Geographers. A week later, I was in a plane flying over the Upper Midwest.” His study of the Great Mississippi Flood of 1993 with remote-sensing data was the launching off point for what has become Brakenridge’s passion for the last decade: creating a satellite-based, global atlas of flood hazards and putting the information into the hands of disaster relief and planning organizations. Brakenridge is motivated by the hope that current information will help people cope with today’s flood disasters, but also by the hope that as his flood archive covers more of the globe over a longer time, patterns will emerge that will help people prepare for floods more confidently. |
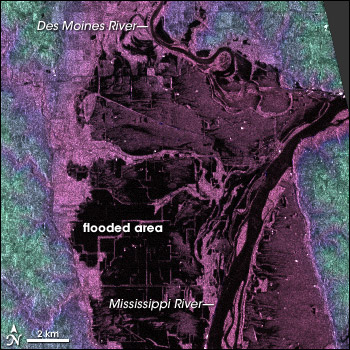
Geologist Bob Brakenridge used radar data to study areas covered by floods. Waterways and flooded areas are black in this radar image, which shows the region near the confluence of the Des Moines and Mississippi Rivers on July 16, 1993. (Image courtesy Dartmouth Flood Observatory) | ||
 | |||
Predicting precisely when a flood is going to occur or how severe it will be is mostly a matter of assessing the current weather and environmental conditions in an area, and that isn’t the kind of information you can get from an archive. “What a global archive of flood information can do,” says Brakenridge, “is to help disaster management planners and re-insurance companies to constrain flood hazards, giving a clear indication of what areas are susceptible to floods, how severe those are, and how often severe flooding returns to the same area.” [See Sidebar: Teleconnections] |
Satellite sensors allow Bob Brakenridge to map floods on a worldwide basis. Red areas correspond to regions that experienced significant flooding in the last week of March 2005. (Image adapted from the Dartmouth Flood Observatory) | ||
