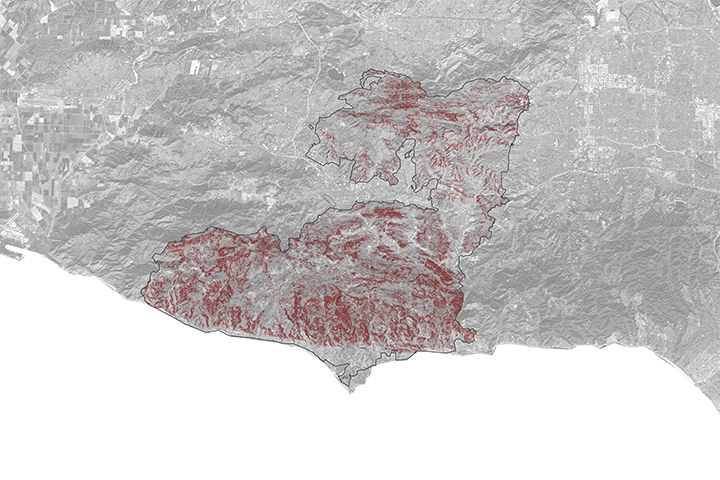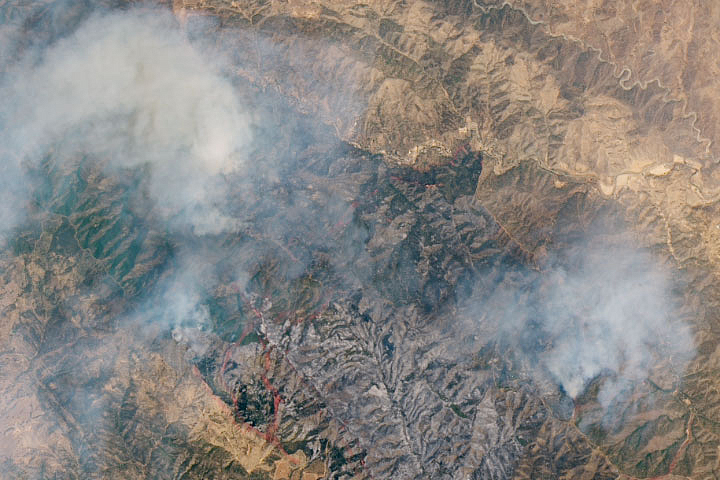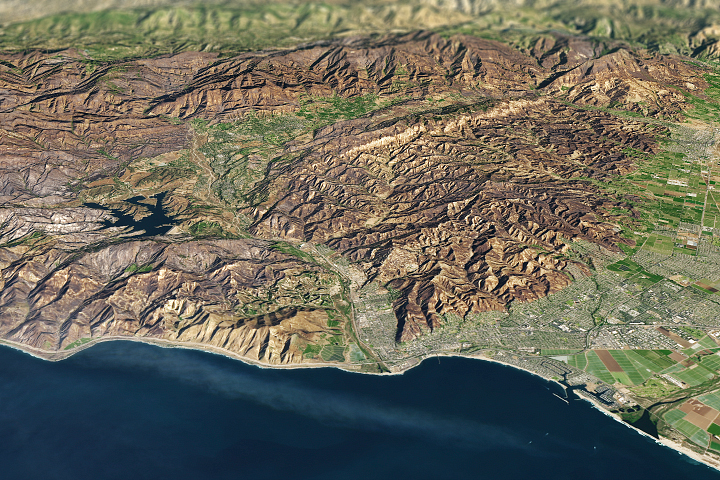
On May 2, 2013, an explosive wildfire ignited in southern California near Camarillo. Fueled by unusually dry conditions and strong winds, the Springs Fire blazed through more than 24,000 acres of chaparral on the Santa Monica Mountains, forcing the closure of parts of Highway 101 and threatening thousands of homes in Camarillo, Newbury Park, and Thousand Oaks.
Within a week, hundreds of firefighters had contained the fire, limiting damage to just 16 buildings. That may seem like the end of the story, but for Burned Area Emergency Response (BAER) teams, the work just begins when the flames die down.
BAER teams often head for the field while the remnants of a fire are still smoldering. These multidisciplinary groups of scientists—which include hydrologists, wildlife biologists, soil scientists, geologists, engineers, botanists, ecologists, and foresters—evaluate the severity of a fire and look for additional threats. The risk of floods, severe erosion, and landslides often increases because wildfires consume leaf litter and other organic matter that normally soak up and retain moisture. Vaporized oils from charred leaves also can leave a water-repellent sheen on the soil that causes water to run-off.
It’s the job of the BAER team to spot such risks as quickly as possible so emergency planners can begin developing responses. The obvious way to do this is to investigate with people on the ground. However, there are times when fires are so large and inaccessible, or when resources are stretched so thin, that BAER teams can’t get to all the fires. Since about 2001, BAER teams have gotten help from some eyes in the sky.
Satellite sensors collect data in a variety of wavelengths within the electromagnetic spectrum, some far beyond what the human eye can detect. Certain wavelengths in shortwave and near infrared are especially useful for gauging the severity of a fire. If a satellite passes over at the right time, remote-sensing experts can produce maps of burn severity within hours of the blaze.
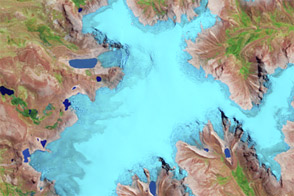
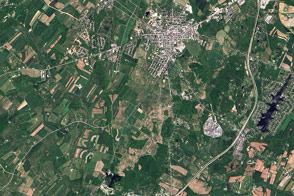
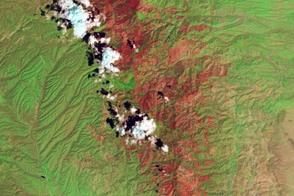
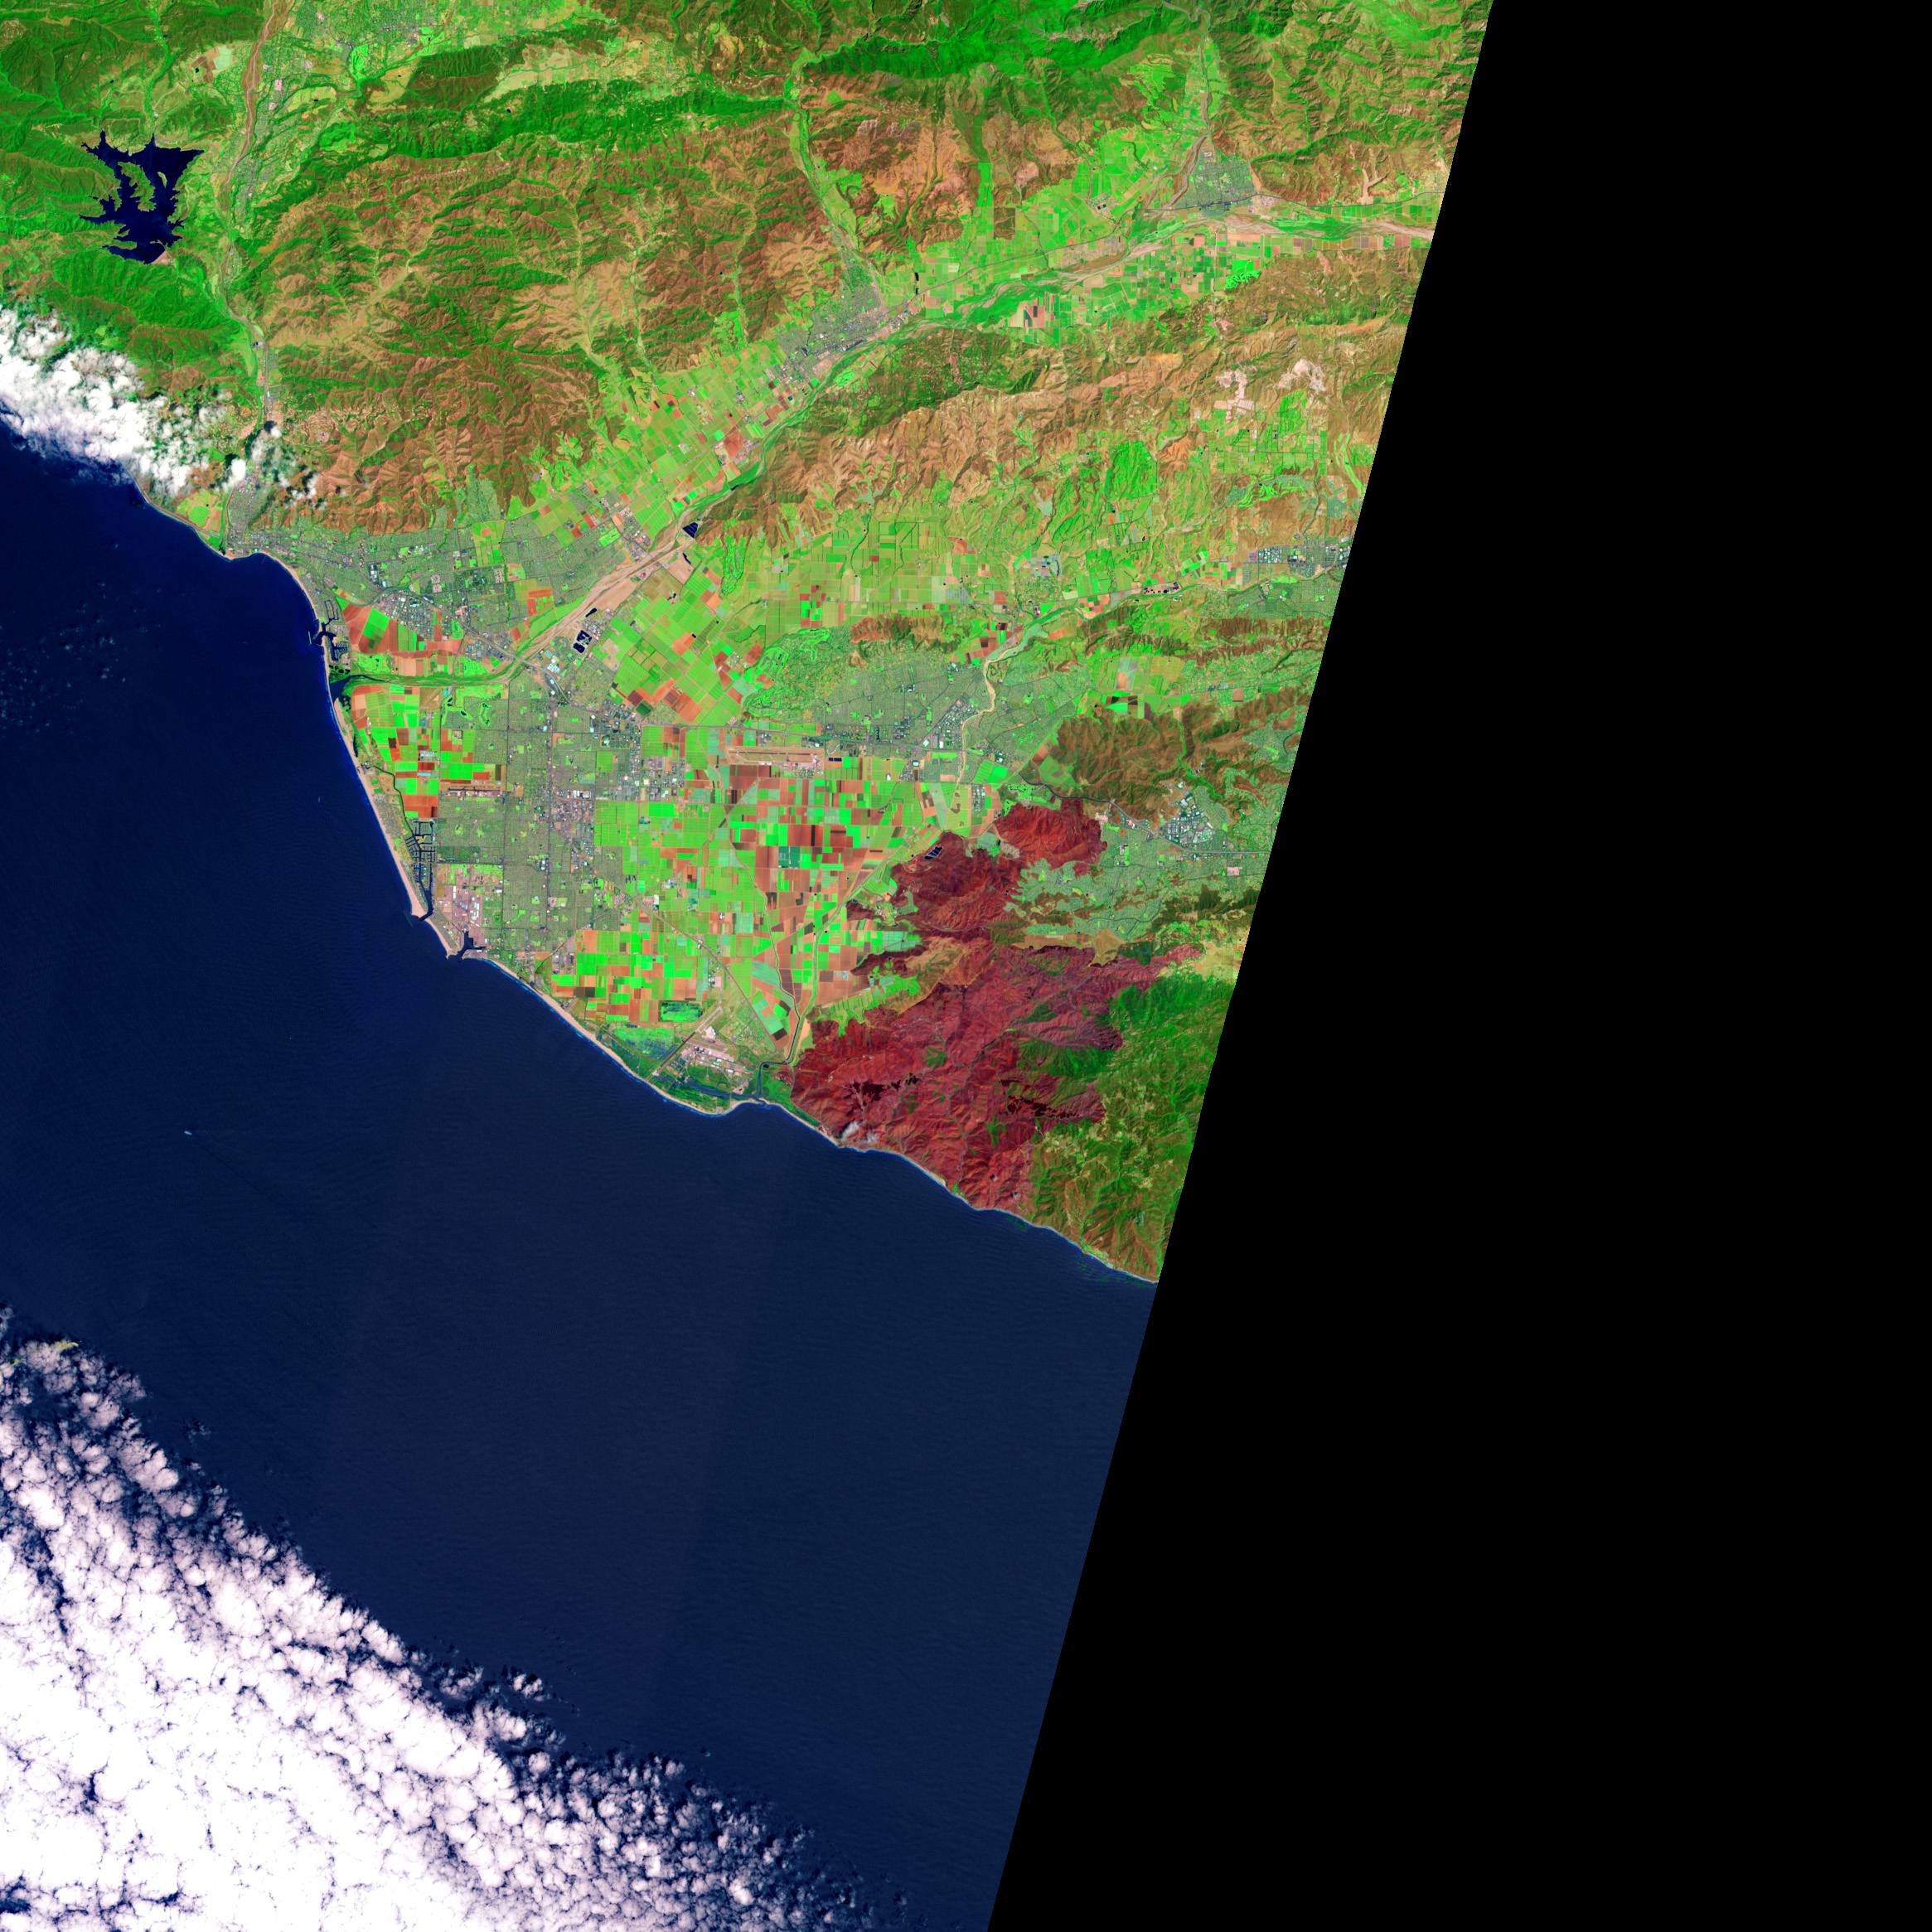
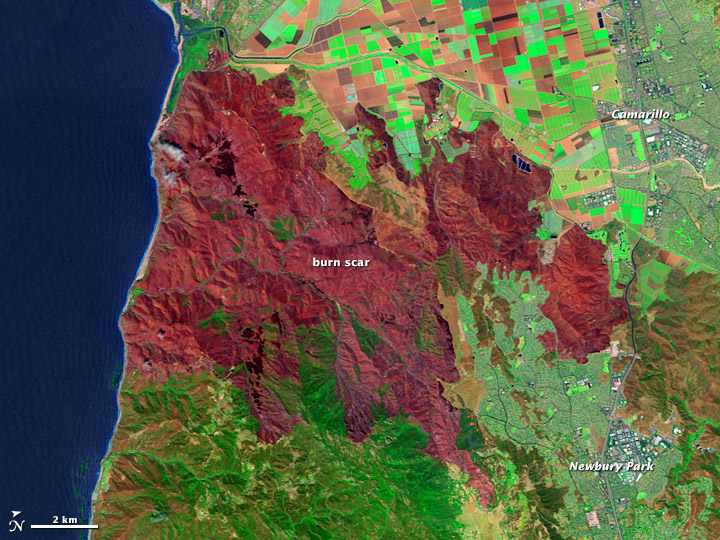
The Landsat Data Continuity Mission (LDCM), the newest Landsat satellite, passed over the Springs Fire on May 4, 2013. In the false-color images above from LDCM’s Operational Land Imager (OLI), unburned vegetation appears dark green. Burned areas are red, and the most severely burned areas are generally the darkest. Actively growing farmland is light green; plowed fields are brown. Buildings and roads are gray. Note that the image is rotated so that north is to the right.
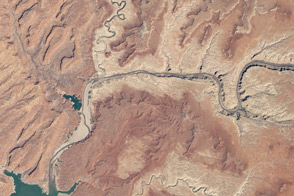
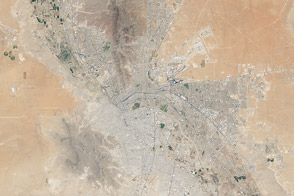
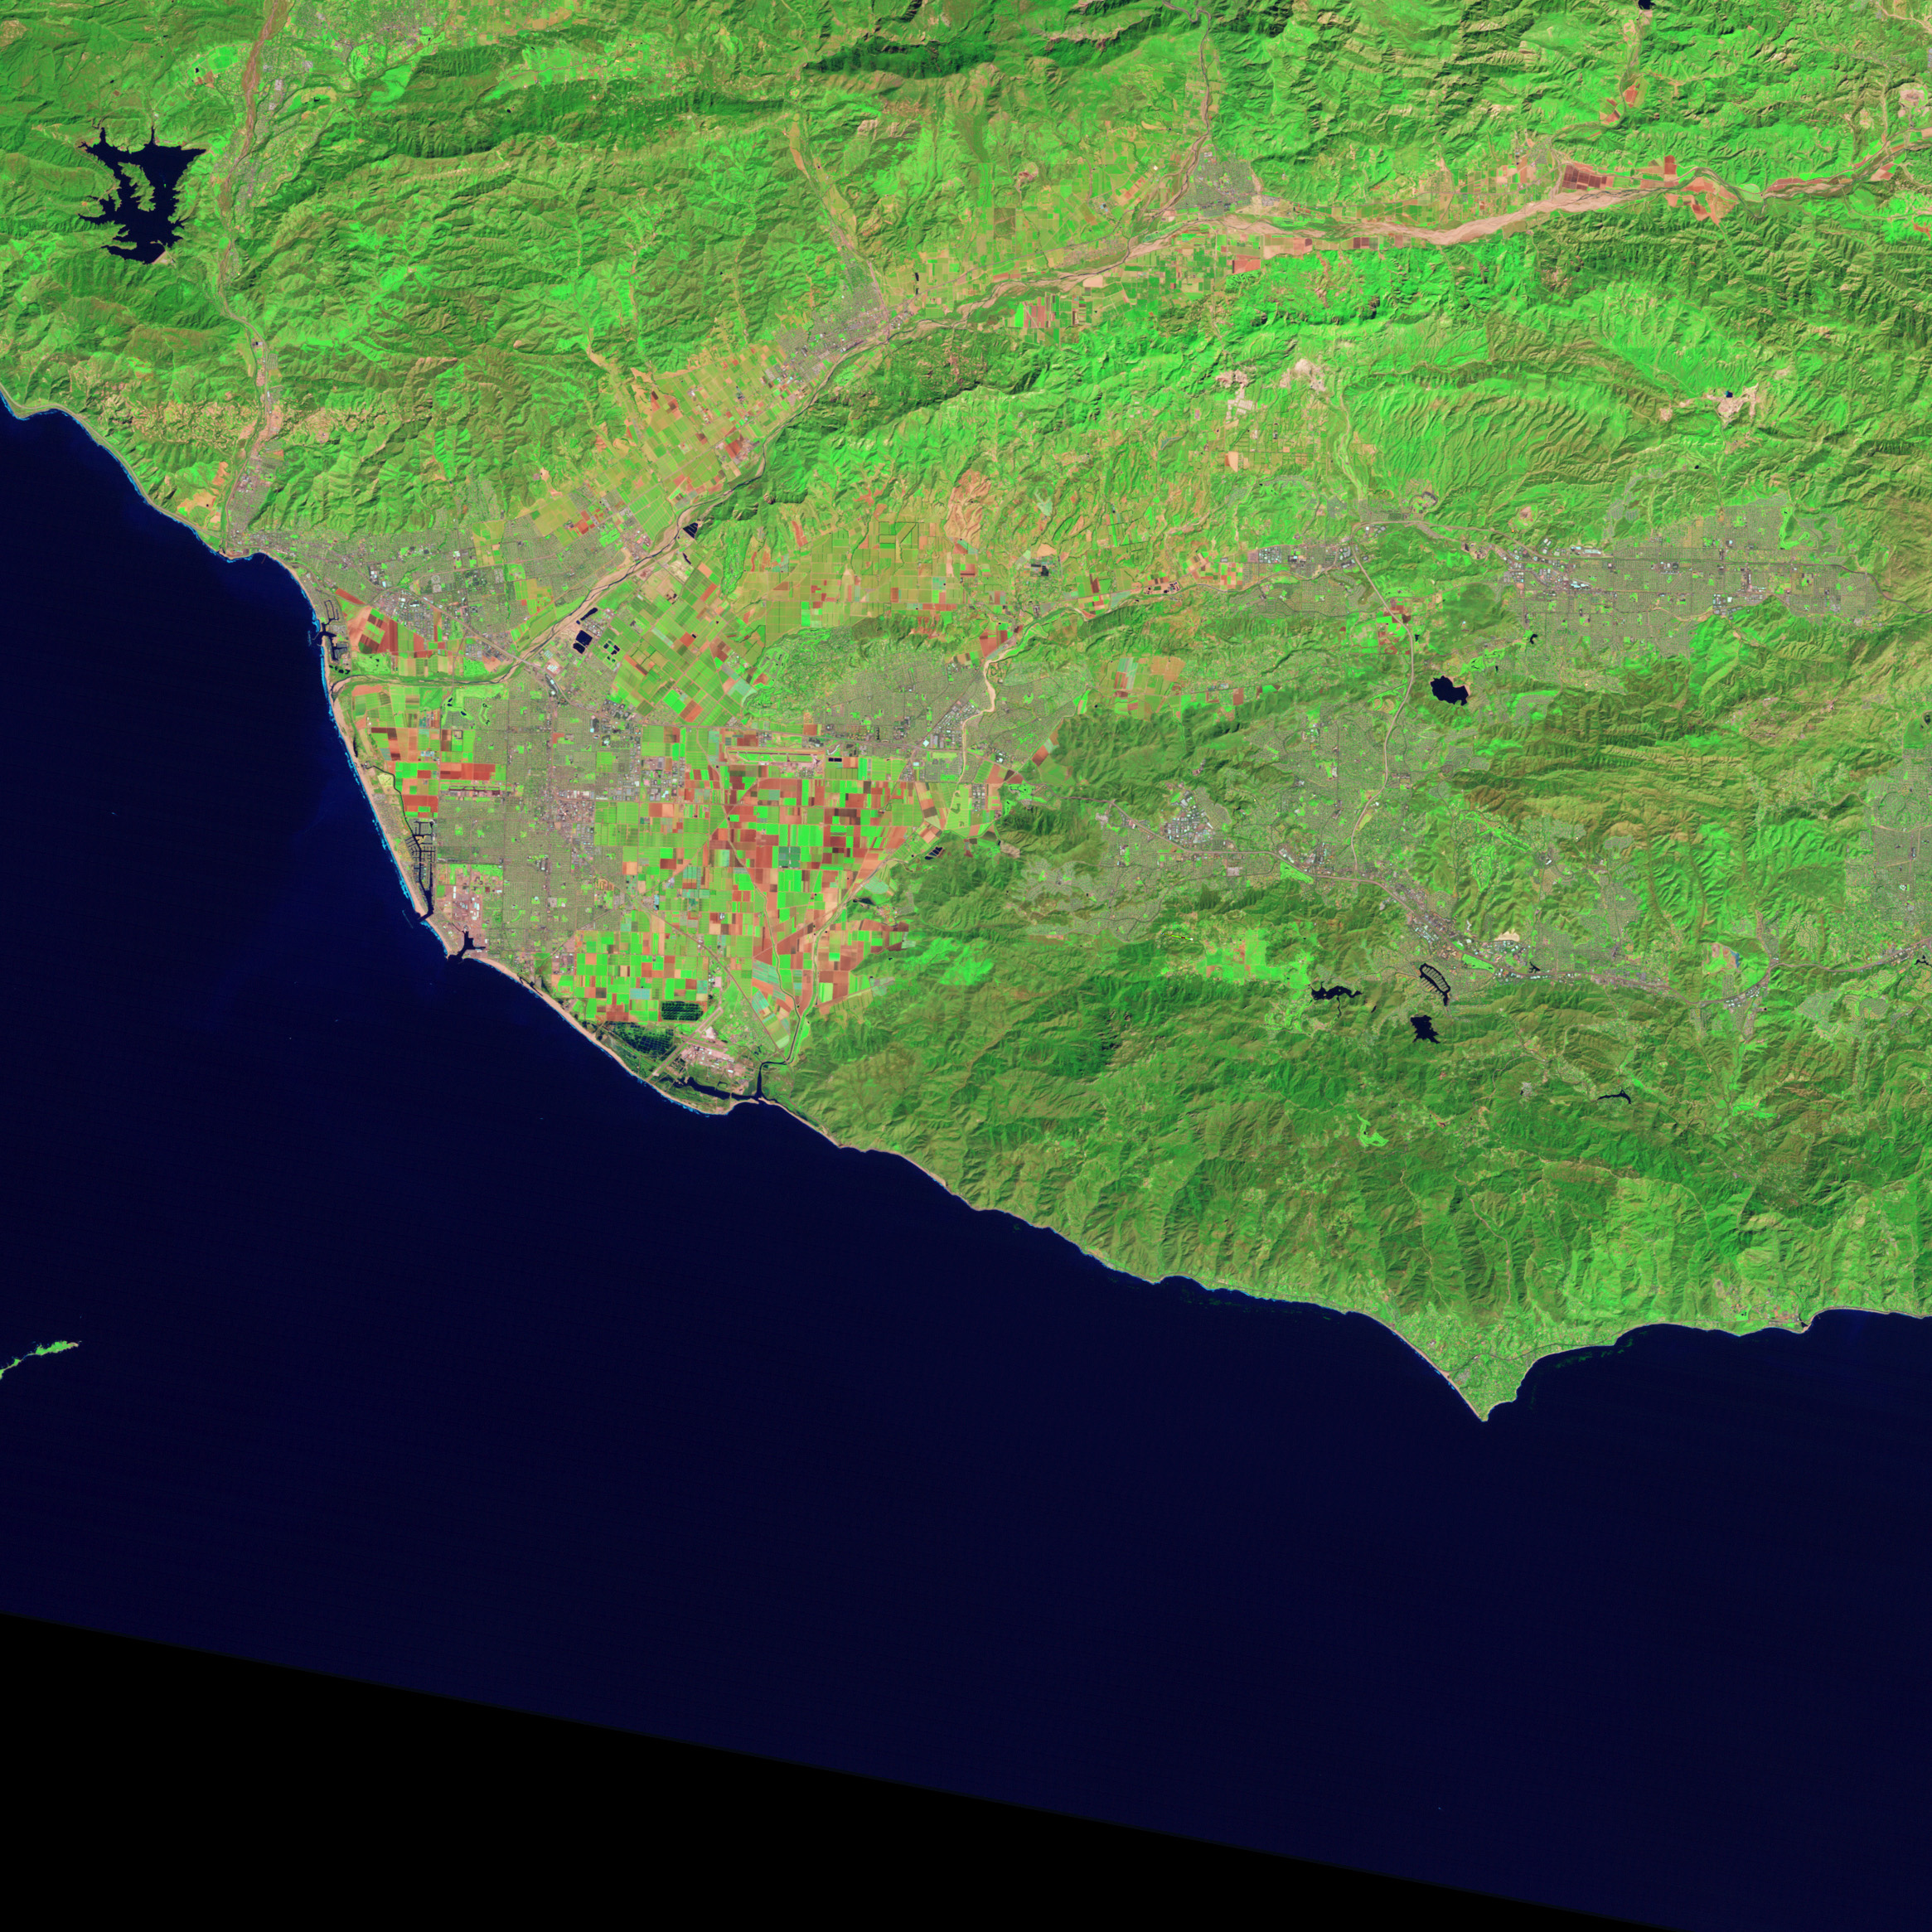
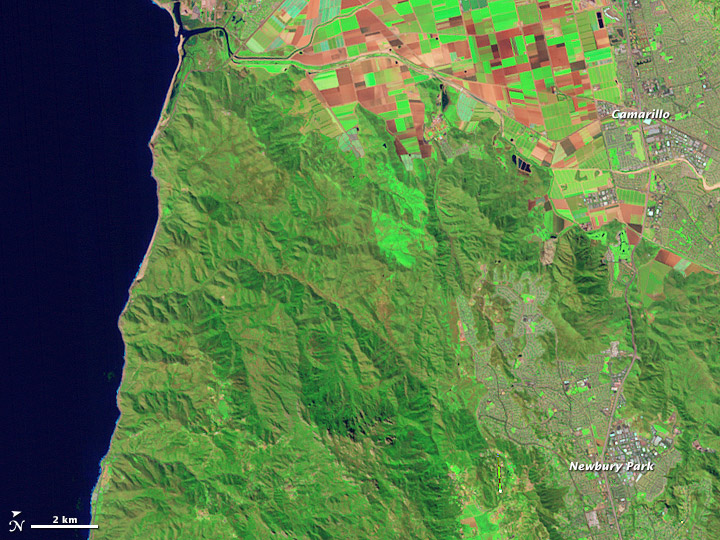
While most of the Springs Fire affected shrubland and forested areas, flames did encroach on fields and homes near Camarillo and Newbury Park. The lower image shows the same area on March 18, 2010. (Turn on the image-comparison tool to see the difference.)
“Having a new Landsat satellite on orbit is critically important. We have to deliver our maps to the BAER teams within a week for them to be most useful, and our odds of getting timely high-quality cloud and smoke-free image acquisitions just went up dramatically.” said Randy McKinley, a geographer with the U.S. Geological Survey’s Earth Resources Observation and Science (EROS) Center who makes burn severity maps.
“With the recent loss of Landsat 5, we were limited to one Landsat overpass every 16 days for most fires. With the successful launch of LDCM, we will now be getting a look at wildfires at least every 8 days,” he said. In addition, LDCM is expected to collect more than 400 scenes per day; instruments on Landsat 5 and 7 collected about 250.
Note that the images above are considered engineering data—they help LDCM scientists and engineers ensure that the satellite and its instruments are operating as designed. Once LDCM completes its check-out period and becomes fully operational for science, NASA will pass control of the satellite to the U.S. Geological Survey and LDCM will be re-named Landsat 8.
Images by Robert Simmon, using data from the U.S. Geological Survey and NASA. Caption by Adam Voiland.