
Kai-tak formed as a tropical depression over the western Pacific Ocean on August 12, 2012, strengthened to a typhoon on August 15, and finally diminished on August 17. During that time, the storm dropped heavy precipitation between the Philippines and Vietnam.
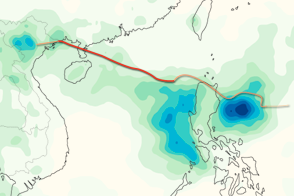
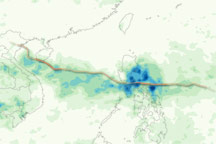
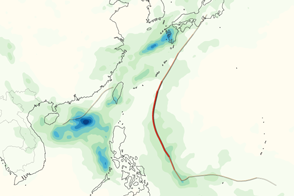
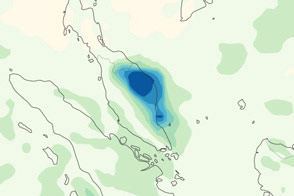
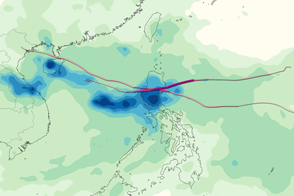
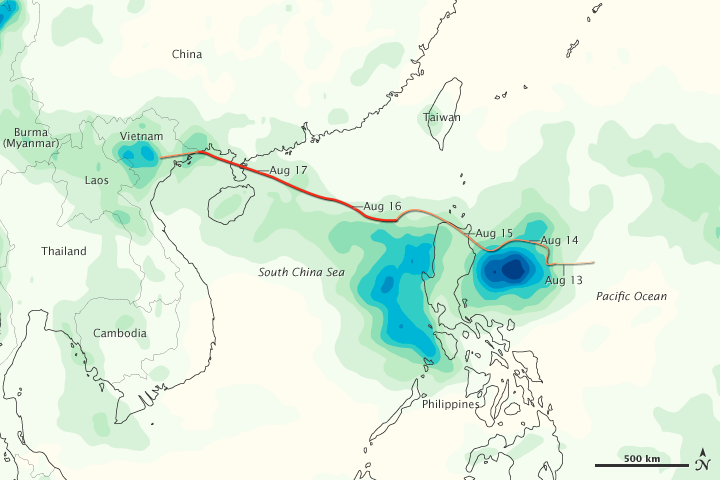
This map shows rainfall totals in the region from August 13 to 19, 2012. The heaviest rainfall—more than 540 millimeters (21 inches)—appears in dark blue. The lightest rainfall—less than 60 millimeters (2 inches)—appears in light green. Trace amounts of rain appear in yellow. The heaviest rainfall occurs around the Philippines, but another pocket of heavy rain also occurs over northern Vietnam.
Superimposed upon the rainfall totals is a storm track for Kai-tak, with darker shades of red-orange indicating greater storm intensity. Kai-tak was a Category 1 typhoon from August 15 to 17, as it traveled across the South China Sea and the Leizhou Peninsula of southeastern China.
This image is based on data from the Multisatellite Precipitation Analysis produced at NASA’s Goddard Space Flight Center, which estimates rainfall by combining measurements from many satellites and calibrating them using rainfall measurements from the Tropical Rainfall Measuring Mission (TRMM) satellite. Because this image is an estimate of the rainfall recorded over a very large area when the satellites are overhead, it may miss pockets of heavy rain in smaller areas, or short periods of more or less intense rain. As a result, local rainfall totals measured from the ground may differ from the estimates shown here.
Heavy rainfall associated with Kai-tak arrived on the heels of torrential rains and deadly floods that struck the northern Philippines in late July and early August 2012.
NASA Earth Observatory image by Jesse Allen, using data from the TRMM Science Data and Information System at Goddard Space Flight Center. Caption by Michon Scott.