Though far distant from any permanent settlement, Antarctica is poised to impact human life around the globe. Sea levels are rising in part because land-based ice is melting. Rising sea levels increase coastal erosion and flooding. And one of the largest single contributors to sea level rise in recent years is Antarctica’s Pine Island Glacier. Shrinking at a rate of 100 meters (300 feet) per year, the Pine Island Glacier is responsible for seven percent of the world’s recent sea level rise. Why is the Pine Island Glacier melting so quickly?
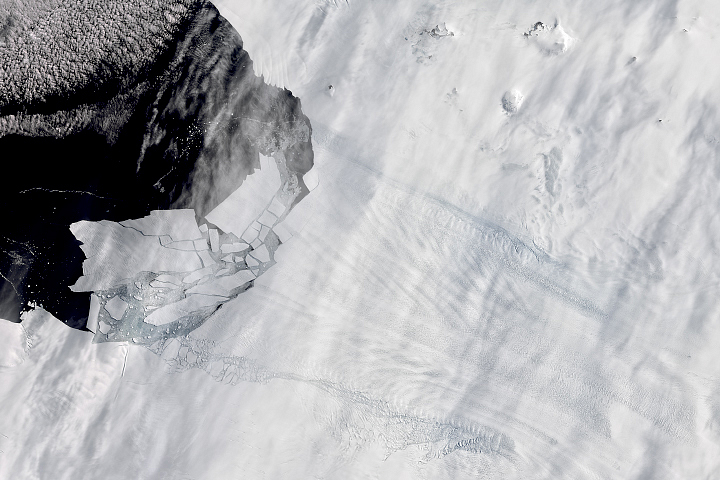
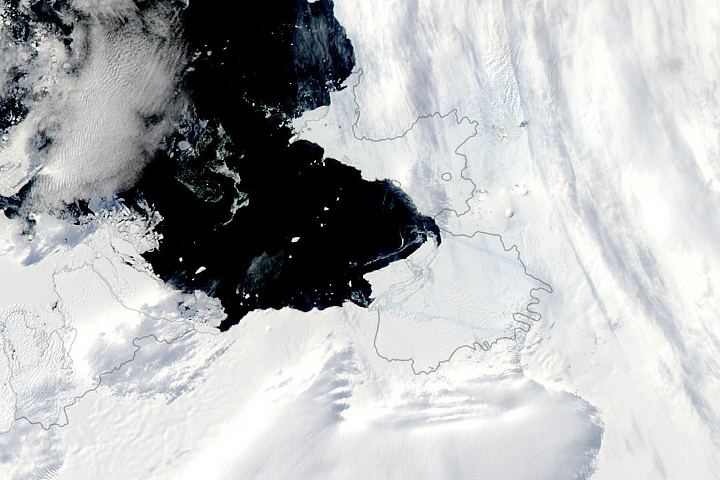
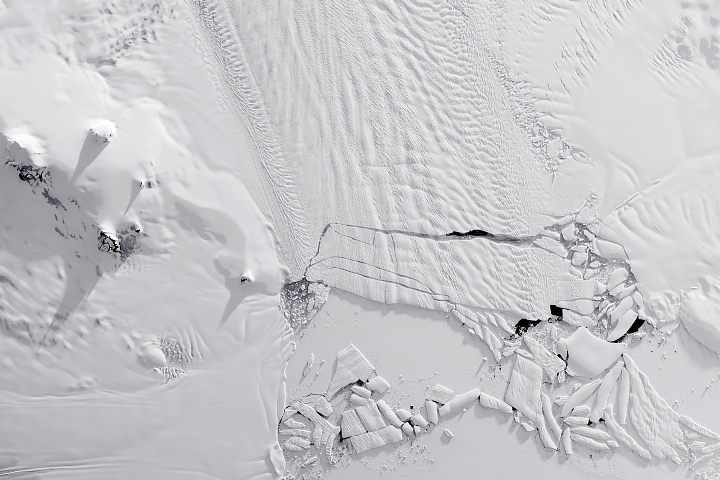
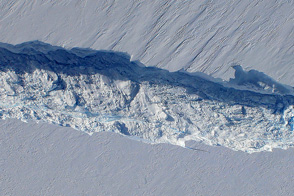
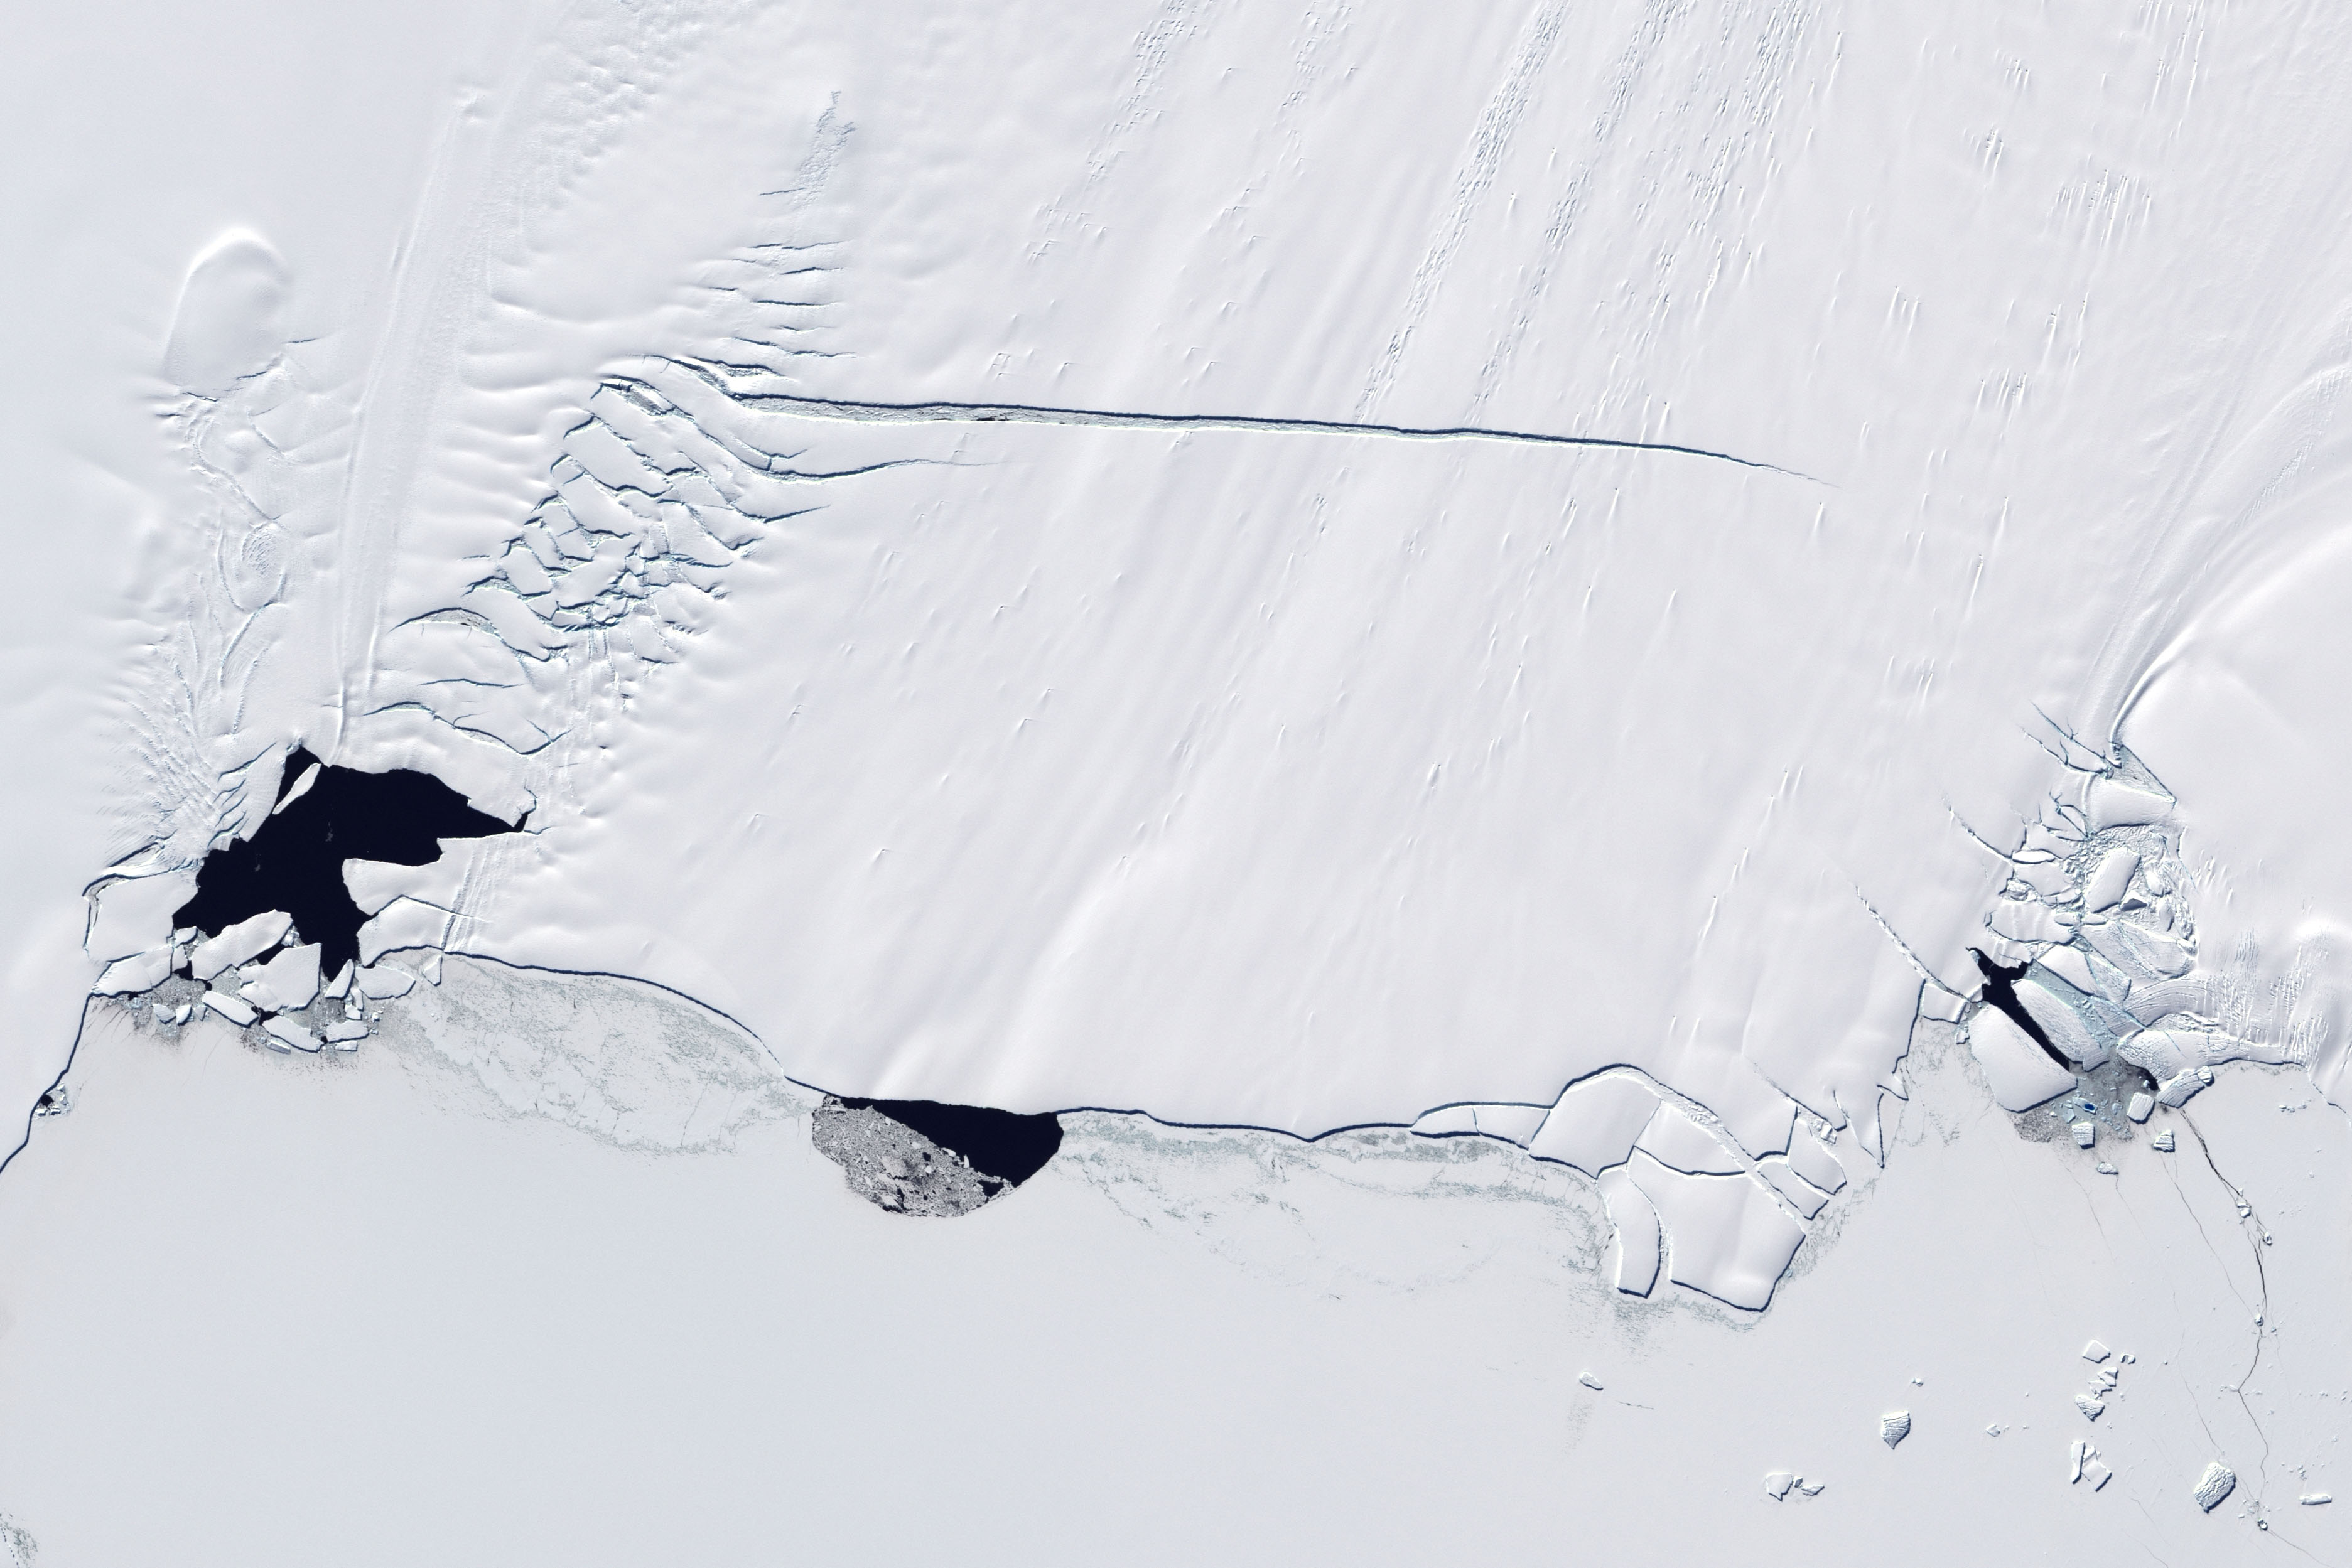
The Pine Island Glacier flows out of Antarctica’s Hudson Mountains and floats over the ocean. Scientists think that the glacier is shrinking because the ocean water that flows under the glacier is warming, increasing melt at the base. Some of the evidence for this idea comes from satellite images like this one. The Landsat satellite acquired the image on January 13, 2001.
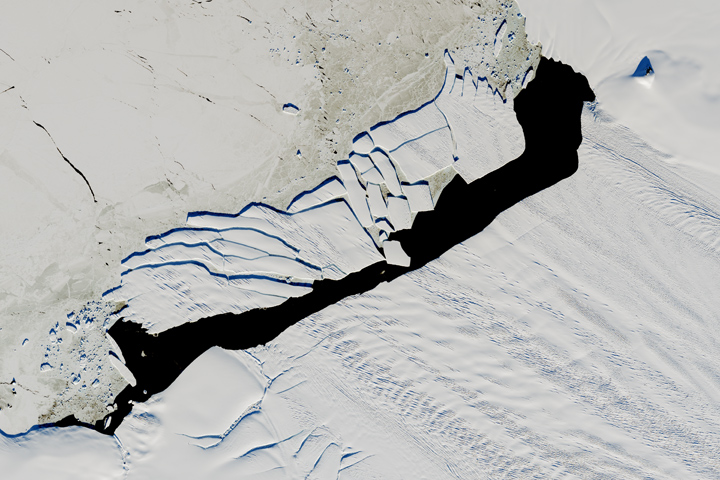
Sea ice abuts the floating glacier tongue except in three places along the front of the glacier. These ice-free areas are called polynyas. Polynyas are routinely present in these three locations when sea ice is present. The polynyas most likely form where warm ocean currents rise toward the ocean surface.
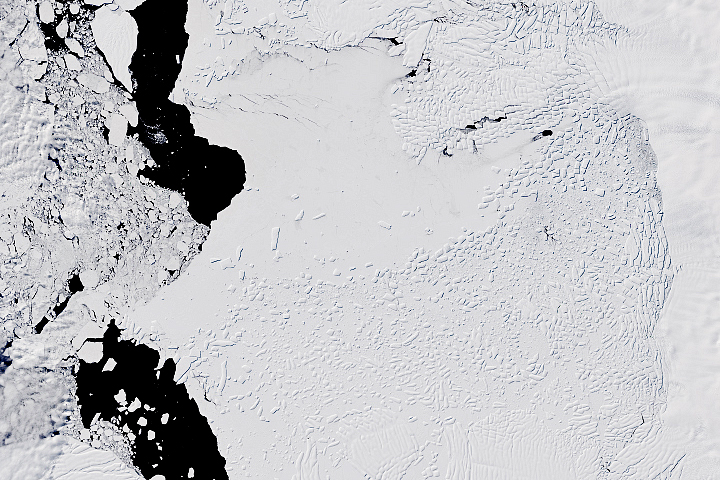
Ocean water in this part of the Antarctic has three layers. The deepest water is very cold and very dense, and the top layer is also cold. The middle layer, between 600 and 1,200 meters (2,000 and 4,000 feet) deep, is warmer. The continental shelf here is about 600 meters (2,000 feet) deep, and as the warm water from the open ocean meets the shelf, it continues to flow toward land and rises beneath the floating glacier. The polynyas suggest that the warm water exits the cavity beneath the glacier in three locations where the sea ice has melted. It is likely that the warm water consistently exits at these locations, but in years that are free of sea ice (like 2011), the polynyas aren’t visible and so this cannot be confirmed from images.
While scientists suspect warm ocean water is causing the rapid melt of the Pine Island Glacier, they don’t know exactly how the water is moving through the cavity beneath the glacier or how the melt is happening. To answer these questions, scientists need to know the shape of the ocean cavity and how the water moves through it. NASA scientists are on two separate field campaigns in Antarctica to answer these questions. Both groups are taking measurements to understand what is happening beneath the glacier.
Starting in mid-December 2011, Robert Bindschadler, a glaciologist at NASA Goddard Space Flight Center, will be leading a long-anticipated six-week expedition to the glacier. He and other team members will drill through the ice to measure the underside of the ice and the ocean and currents beneath it.
The second Antarctic expedition, IceBridge, is in its final weeks. IceBridge flies airplanes over the ice carrying radar and lidar equipment to measure its thickness. In 2009, the IceBridge team used a gravimeter to map out the shape of the ocean floor beneath the Pine Island Glacier. Their measurements revealed a deep channel under the glacier tongue through which warm water could flow.
The team is taking additional measurements in 2011 to get a clearer picture of the ground beneath the glacier and the ocean. The new measurements will also help scientists track how much the glacier is melting from year to year. In their first flight over the glacier in 2011, the IceBridge team discovered a crack. Eventually the ice will break off at the crack forming a new iceberg. Such events are natural, and in fact, a similar crack is visible in the 2001 image, the last time the Pine Island Glacier calved a large iceberg. The crack will not impact Bindschadler’s expedition and may offer a unique opportunity for the team to measure what happens on a glacier tongue during a calving event.
Read more about IceBridge in IceBridge: Building a record of Earth's changing ice, one flight at a time.
NASA Earth Observatory image created by Robert Simmon using Landsat data provided by the United States Geological Survey. Caption by Holli Riebeek.