April 27 and April 28, 2011, brought the deadliest tornado outbreak in the United States since 1974. By dawn on April 28, at least 250 people had been killed in 6 states. Alabama was the hardest hit, with 162 confirmed dead as of Thursday morning.
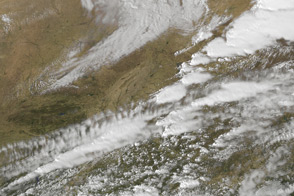
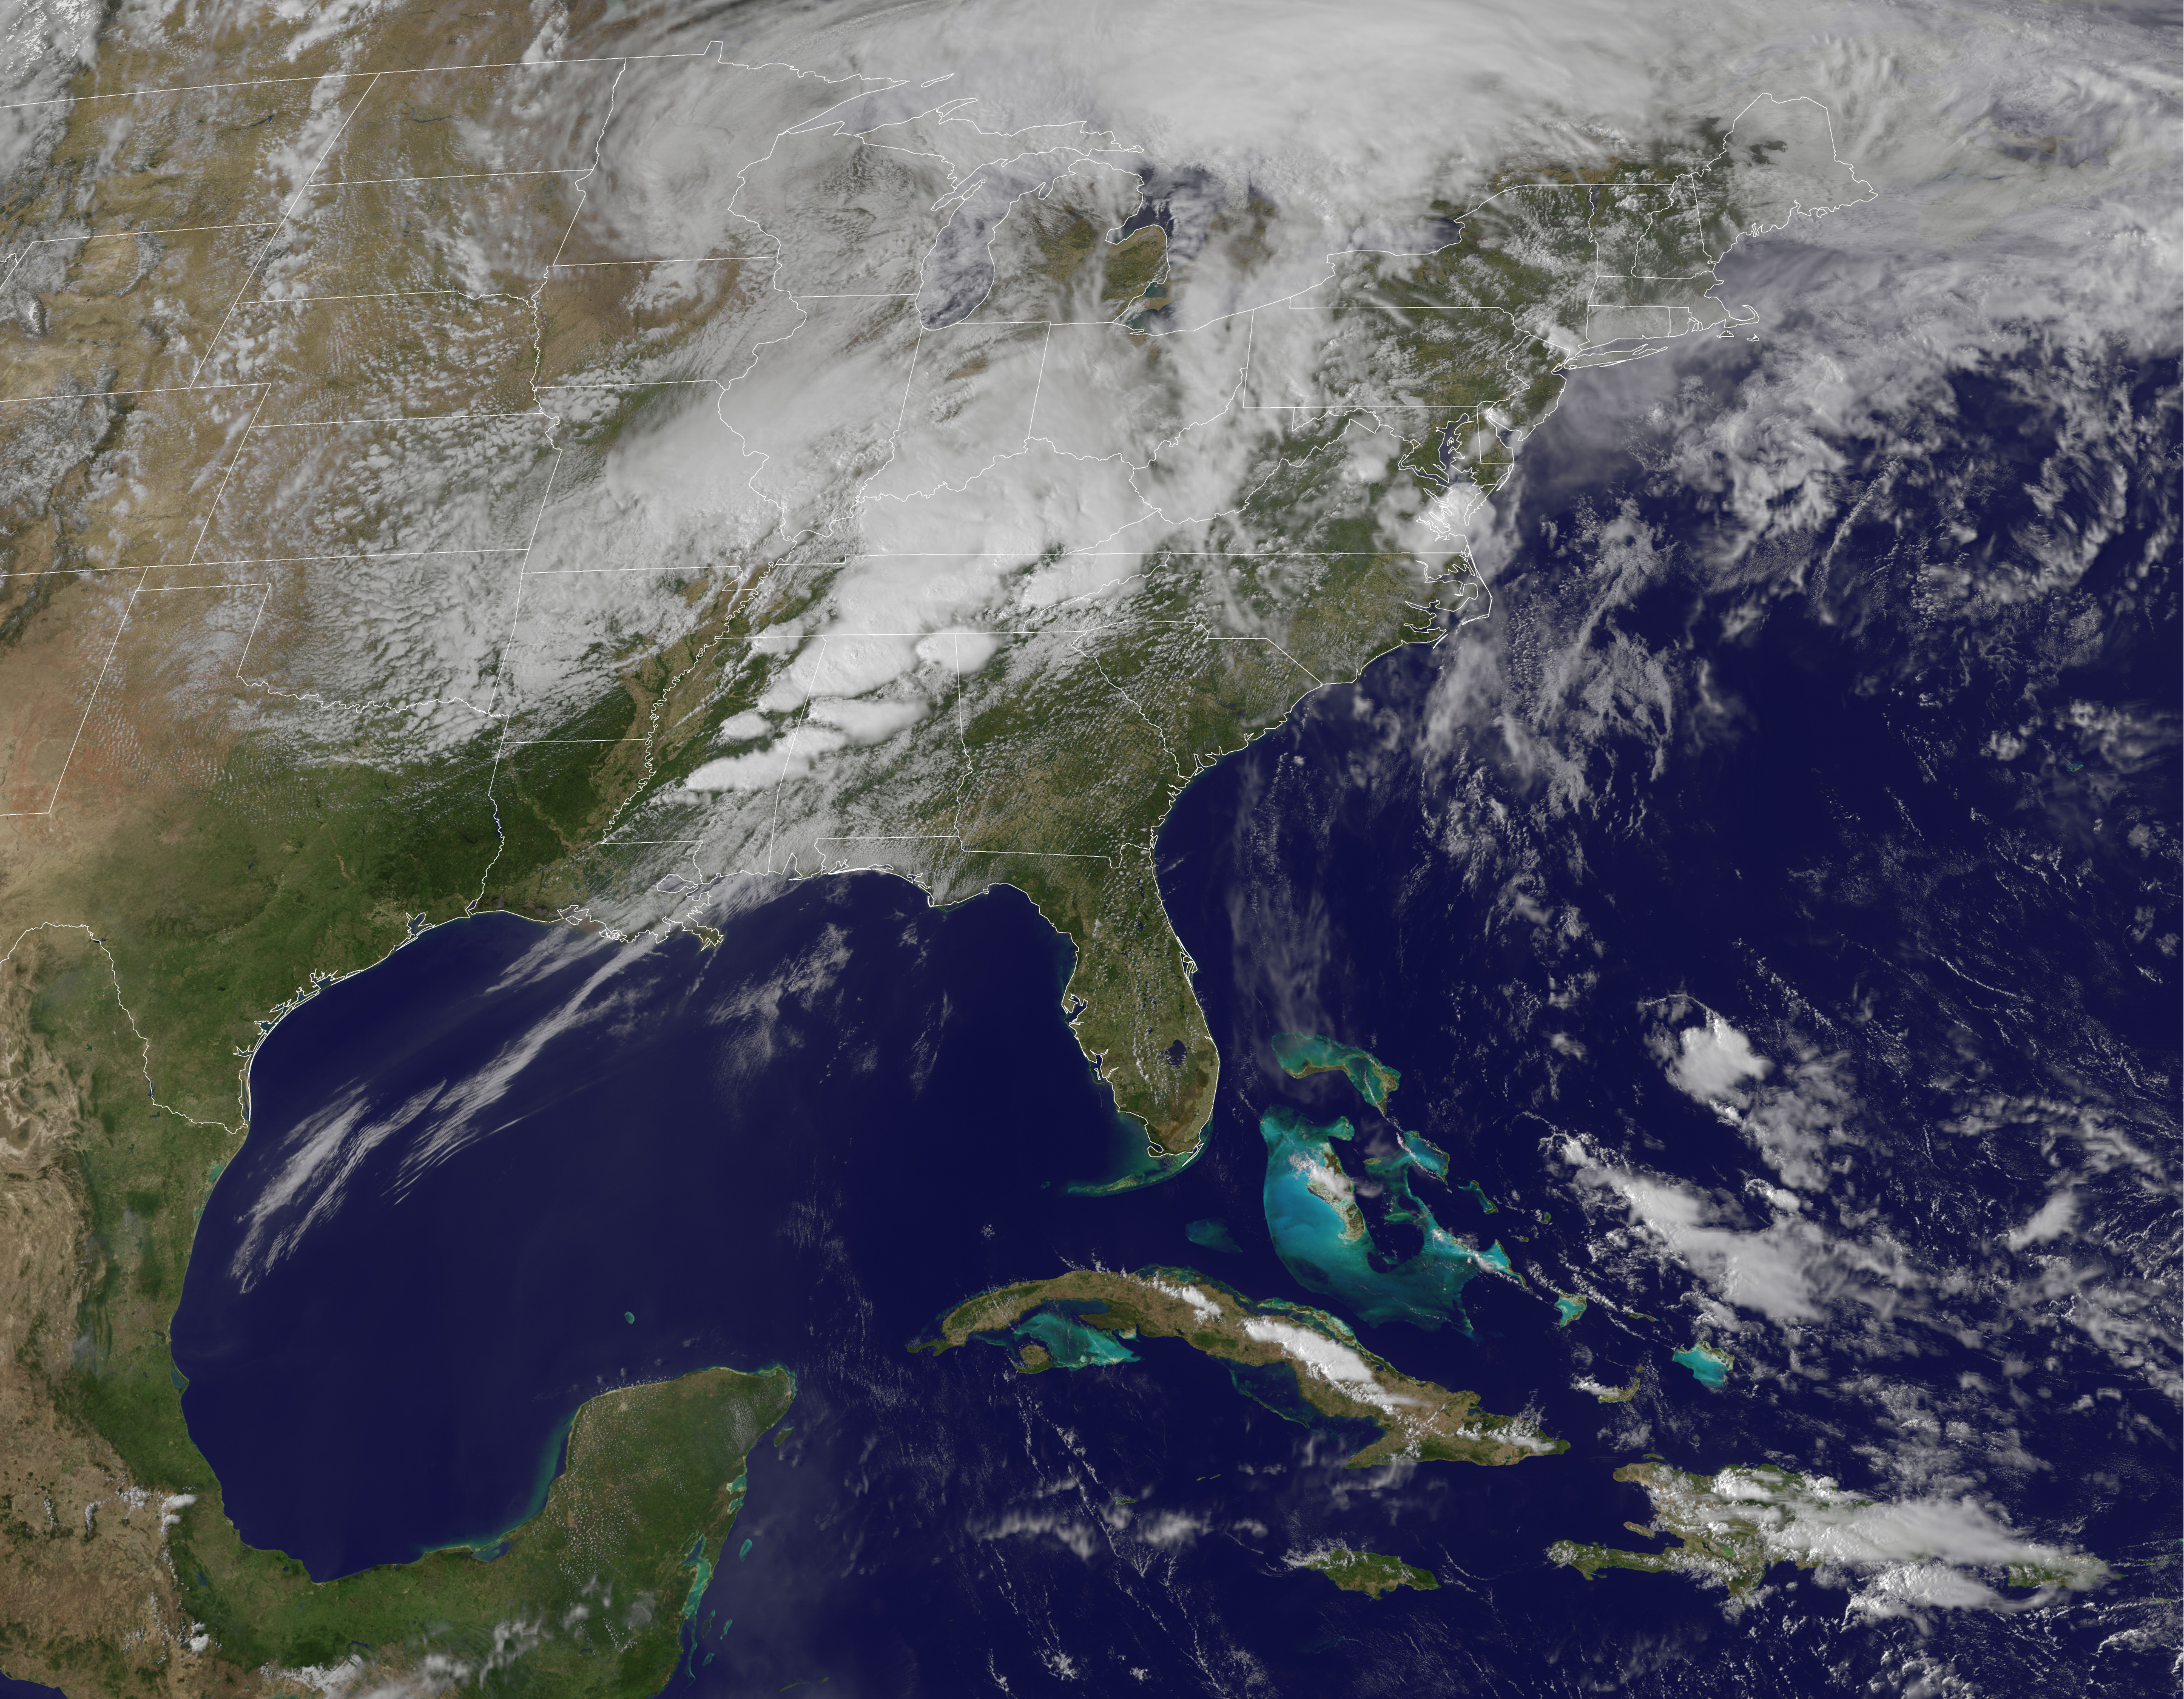
This image shows the storms at 1:45 p.m. U.S. Central Daylight Time on April 27, and the animation shows the development of the weather system that spurred the widespread tornadoes. The images are from the GOES satellite.
The animation starts on April 26 and runs through the morning of April 28. The ingredients for severe weather are evident in the cloud patterns. A relatively stable mass of cold air—visible as a swirl of more-or-less continuous clouds—rotates in the north along the top of the image. Meanwhile, moist air pushes north and west from the Atlantic Ocean and Gulf of Mexico. The warm air contains small low clouds.
The collision between two such air masses is enough to generate severe weather, but the weather also was amplified by the jet stream on April 27. Though not directly visible in the image, the narrow band of fast-moving wind blew north and east between the two air masses. With surface winds blowing from the south and east, and the jet stream blowing from the west, powerful smaller-scale circulation patterns generated lines of intense thunderstorms.
The thunderstorms shown in this image began to rise over Louisiana midway through the day on April 27—around 16:00 UTC or 11:00 a.m. local time—and moved across Mississippi and Alabama through the afternoon. Forming along and ahead of the turbulent boundary between the air masses, the storms move east and north with the jet stream. The bright white spots within the clouds are very active storms, quite probably the systems that generated tornadoes.
Throughout the day, many such storms arose over the South. The slow eastward progression of the upper-level system permitted successive storms to affect the same region for a much longer time span than usual. According to the National Weather Service, more than 150 tornadoes were reported throughout the day.
The images in this animation are from the GOES satellite, a geostationary satellite whose orbit keeps it above the same spot on Earth at all times. Such an orbit allows the satellite to image the movement of clouds every few minutes, observations that are necessary for weather monitoring and forecasting. GOES is a joint NASA and NOAA satellite.
NASA image courtesy the GOES Project Science team. Animation by Jesse Allen. Caption by Holli Riebeek with information from George Huffman.