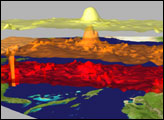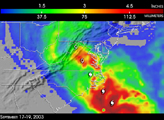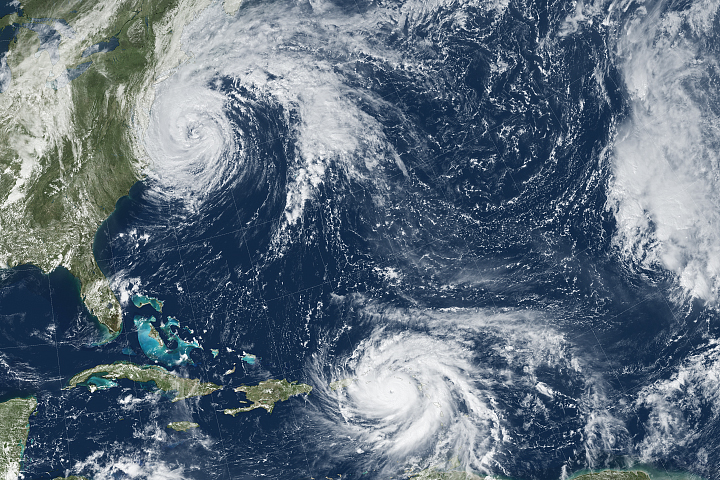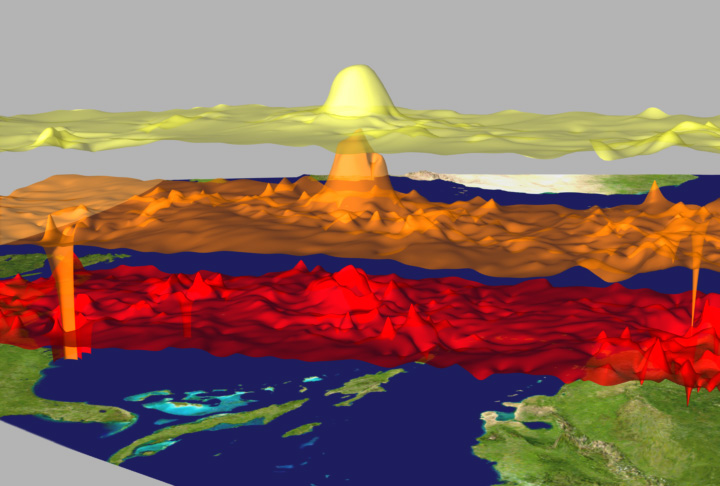
This animation, generated with data from the Atmospheric Infrared Sounder experiment on NASA’s Aqua spacecraft, depicts changes in the temperature of Hurricane Isabel as the storm moved across the Atlantic Ocean. The thermal structure of the storm is visualized as three surfaces of equal temperature, or isotherms. The temperature of each isotherm is represented by its color: red is warmest at 62 degrees Fahrenheit (17 degrees Celsius), orange is the freezing level of 32 degrees Fahrenheit, or 0 degrees Celsius, and yellow represents very cold temperatures of -10 degrees Fahrenheit, or -23 degrees Celsius.
The animation tracks the hurricane from September 6, 2003, when Isabel formed off the west coast of Africa, through September 18, 2003, when it made landfall on the on the east coast of the United States. AIRS made fifteen observations of the hurricane during this period. The storm maintains a coherent shape throughout most of its life. This shape features a distinct “hump” in all three isotherms, corresponding to a warming of air that is commonly seen in the "eye" of the hurricane. This hump undergoes a distinct spreading as the storm moves westward, being much wider on Sept. 17 than on Sept. 14. The storm winds were significantly more powerful on Sept. 14, but the winds were apparently concentrated over a relatively smaller area. Also seen on the final day is the beginning of the end of the storm. The hump in the -10 degrees Fahrenheit (-23 degrees Celsius) isotherm has disappeared in the last image, suggesting that Isabel’s thunderstorms had begun to weaken as the hurricane dissipated over land.
Image and animation courtesy Vincent J. Realmuto, NASA JPL