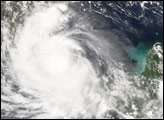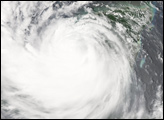
Dean may have been the first Atlantic hurricane of the 2007 season, but days after first forming, it was also classified among the strongest hurricanes recorded. Dean became a Category 5 hurricane before coming ashore on Mexico’s Yucatan Peninsula on August 21. Dean began as a wave-like disturbance in the cloud bands off South America, which gathered together to form a storm system on August 13. Fueled by the deep warm waters of the Caribbean, Dean quickly grew into a major hurricane, reaching its peak just before coming ashore. As it traveled across the Caribbean, the storm also caused great damage to Jamaica, Grand Cayman Island, and other Caribbean islands.
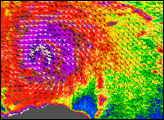
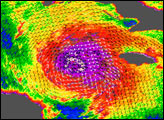
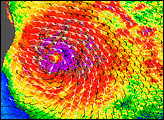
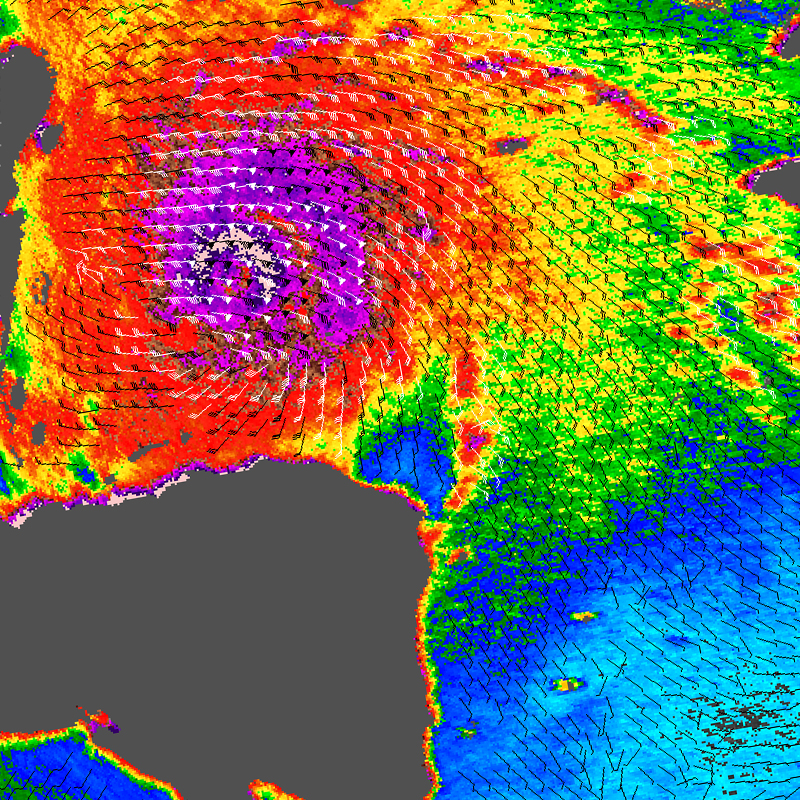
This data visualization of the hurricane shows observations from the QuikSCAT satellite on August 20, 2007, at 5:31 p.m. local time (23:31 UTC). At this time, Dean was in the Gulf of Mexico between Cuba, Jamaica, and the Central American peninsula heading towards the Yucatan Peninsula. Peak winds were around 250 kilometers per hour (155 miles per hour; 135 knots) at this time, according to Unisys Weather’s Hurricane information page. With these wind speeds, Dean just reached Category 5 status. The image depicts wind speed in color and wind direction with small barbs. The highest wind speeds, shown in purple, surround the center of the storm. The strongest winds on the north side of the eyewall are depicted in pink. Areas of heavy rain, shown with white barbs, correspond with stronger winds.
QuikSCAT measurements of the wind strength of Dean and other tropical cyclones can be slower than actual wind speeds. QuikSCAT’s scatterometer sends pulses of microwave energy through the atmosphere to the ocean surface and measures the energy that bounces back from the wind-roughened surface. The energy of the microwave pulses changes depending on wind speed and direction.
To relate the radar signal to actual wind speed, scientists compare measurements taken from buoys and other ground stations to data the satellite acquired at the same time and place. Because the high wind speeds generated by cyclones are rare, scientists do not have corresponding ground information to know how to translate data from the satellite for wind speeds above 50 knots (about 93 km/hr or 58 mph).
Also, the unusually heavy rain found in a cyclone distorts the microwave pulses in a number of ways, making a conversion to exact wind speed difficult. Instead, the scatterometer provides a nice picture of the relative wind speeds within the storm and shows wind direction.
NASA image courtesy of David Long, Brigham Young University, on the QuikSCAT Science Team, and the Jet Propulsion Laboratory.