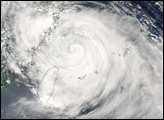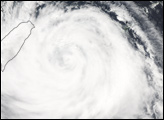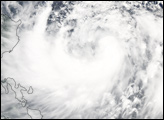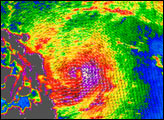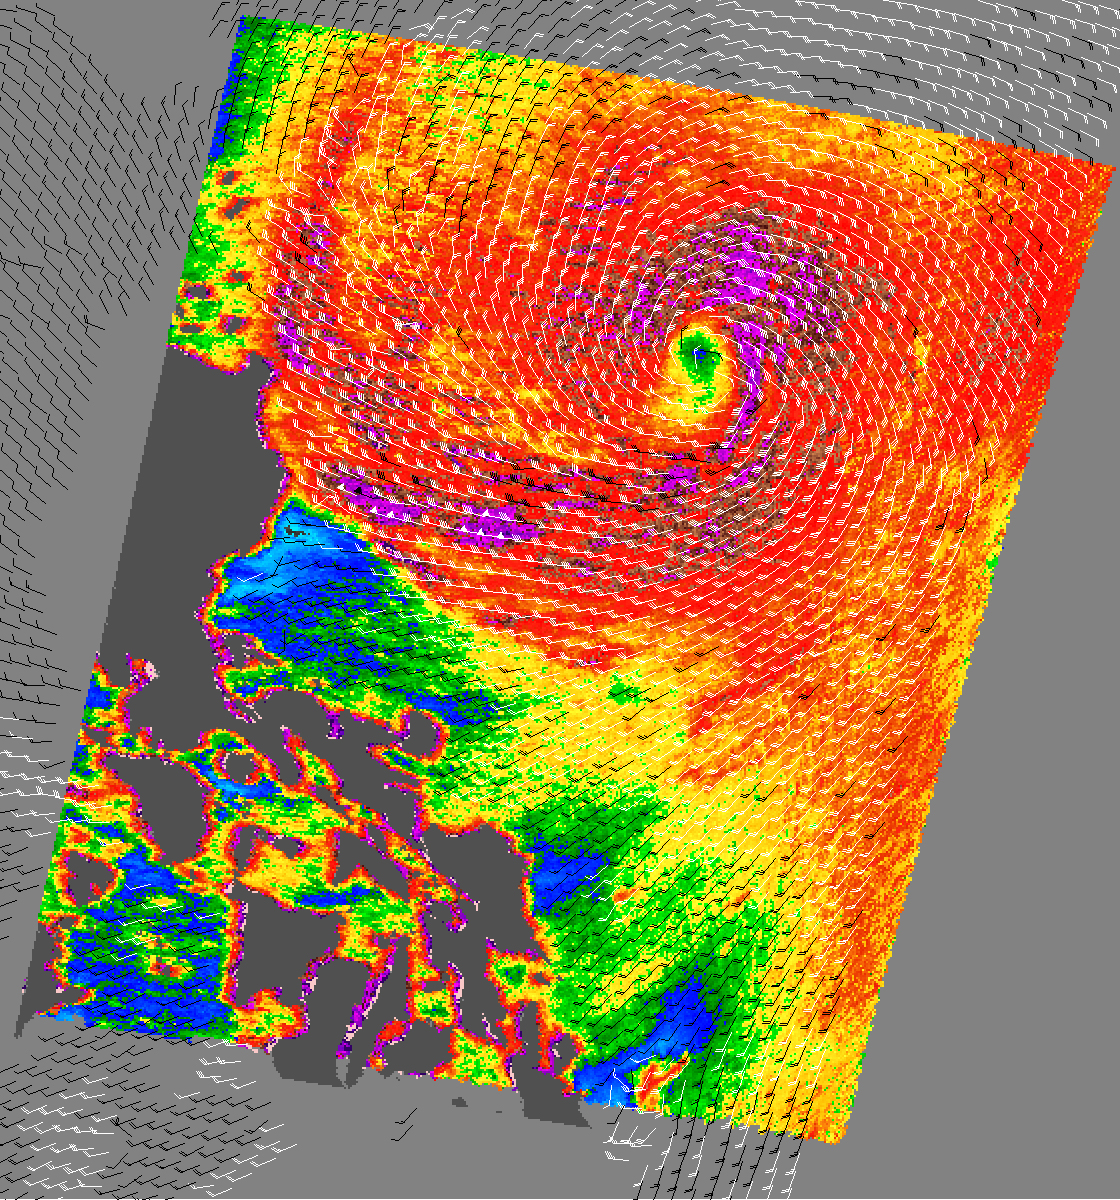
Typhoon Matsa is shown here as observed by NASA’s QuikSCAT satellite on August 2, 2005, at 08:46 UTC (16:46 in Manilla). At this time, the typhoon’s sustained winds reached 120 kilometers per hour (75 miles per hour or 65 knots), sufficient to upgrade it from a storm to a typhoon. The Philippines are located to the west of the storm, not far off the typhoon’s path at the time.
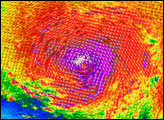
The image depicts wind speed in color and wind direction with small barbs. White barbs point to areas of heavy rain. The highest wind speeds, shown in purple, surround the center of the storm.
Measurements of the wind strength of Typhoon Matsa show sustained winds slightly higher than those shown by QuikSCAT observations. This is because the power of the storm makes accurate measurements difficult. The scatterometer sends pulses of microwave energy through the atmosphere to the ocean surface, and measures the energy that bounces back from the wind-roughened surface. The energy of the microwave pulses changes depending on wind speed and direction, giving scientists a way to monitor wind around the world.
Tropical cyclones (the generic term for hurricanes and typhoons), however, are difficult to measure. To relate the radar energy return to actual wind speed, scientists compare measurements taken from buoys and other ground stations to data the satellite acquired at the same time and place. Because the high wind speeds generated by cyclones are rare, scientists do not have corresponding ground information to know how to translate data from the satellite for wind speeds above 50 knots (about 93 km/hr or 58 mph). Also, the unusually heavy rain found in a cyclone distorts the microwave pulses in a number of ways, making a conversion to accurate wind speed difficult. Instead, the scatterometer provides a nice picture of the relative wind speeds within the storm and shows wind direction.
NASA image courtesy the QuikSCAT Science Team at the Jet Propulsion Laboratory