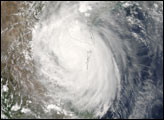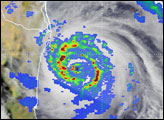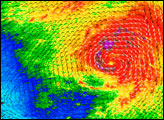
Hurricane Emily is gradually building power in the southern Caribbean. This image shows the storm’s swirling wind patterns as observed by NASA’s QuickScat satellite on July 13, 2005. The image depicts wind speed in color and wind direction with small barbs. The highest wind speeds, shown in purple, are on the trailing side of the developing hurricane spiral pattern.
Measurements of the wind strength of Hurricane Emily show sustained winds of around 80 knots and gusts up to 100 knots. The images, however, reveal lower wind speeds. This is because the power of the storm makes accurate measurements difficult. The scatterometer sends pulses of microwave energy through the atmosphere to the ocean surface, and measures the energy that bounces back from the wind-roughened surface. The energy of the microwave pulses changes depending on wind speed and direction, giving scientists a way to monitor wind around the world.
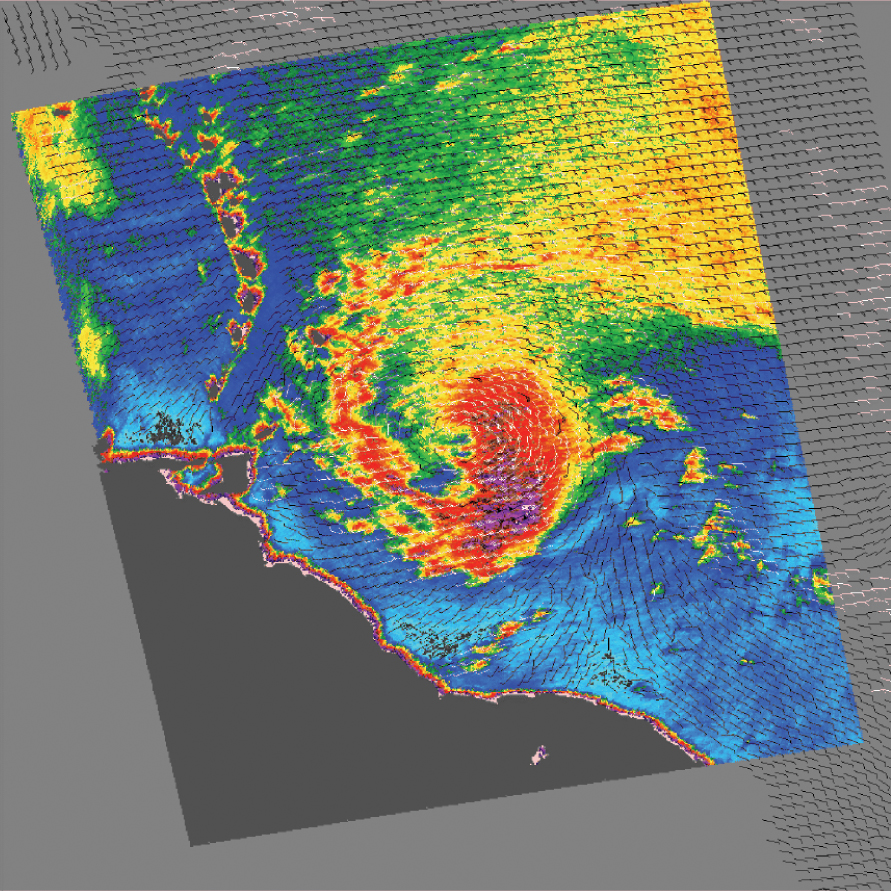
Tropical cyclones, however, are difficult to measure. To relate the radar energy return to actual wind speed, scientists compare measurements taken from buoys and other ground stations to data the satellite acquired at the same time and place. Because the high wind speeds generated by cyclones are rare, scientists don’t have corresponding ground information to know how to translate data from the satellite for wind speeds above 50 knots (about 93 kilometers per hour or 58 miles per hour). Also, the unusually heavy rain found in a cyclone distorts the microwave pulses in a number of ways, making a conversion to accurate wind speed difficult. Instead, the scatterometer provides a nice picture of the relative wind speeds within the storm and shows wind direction.
NASA image courtesy the QuickScat Science Team at the Jet Propulsion Laboratory