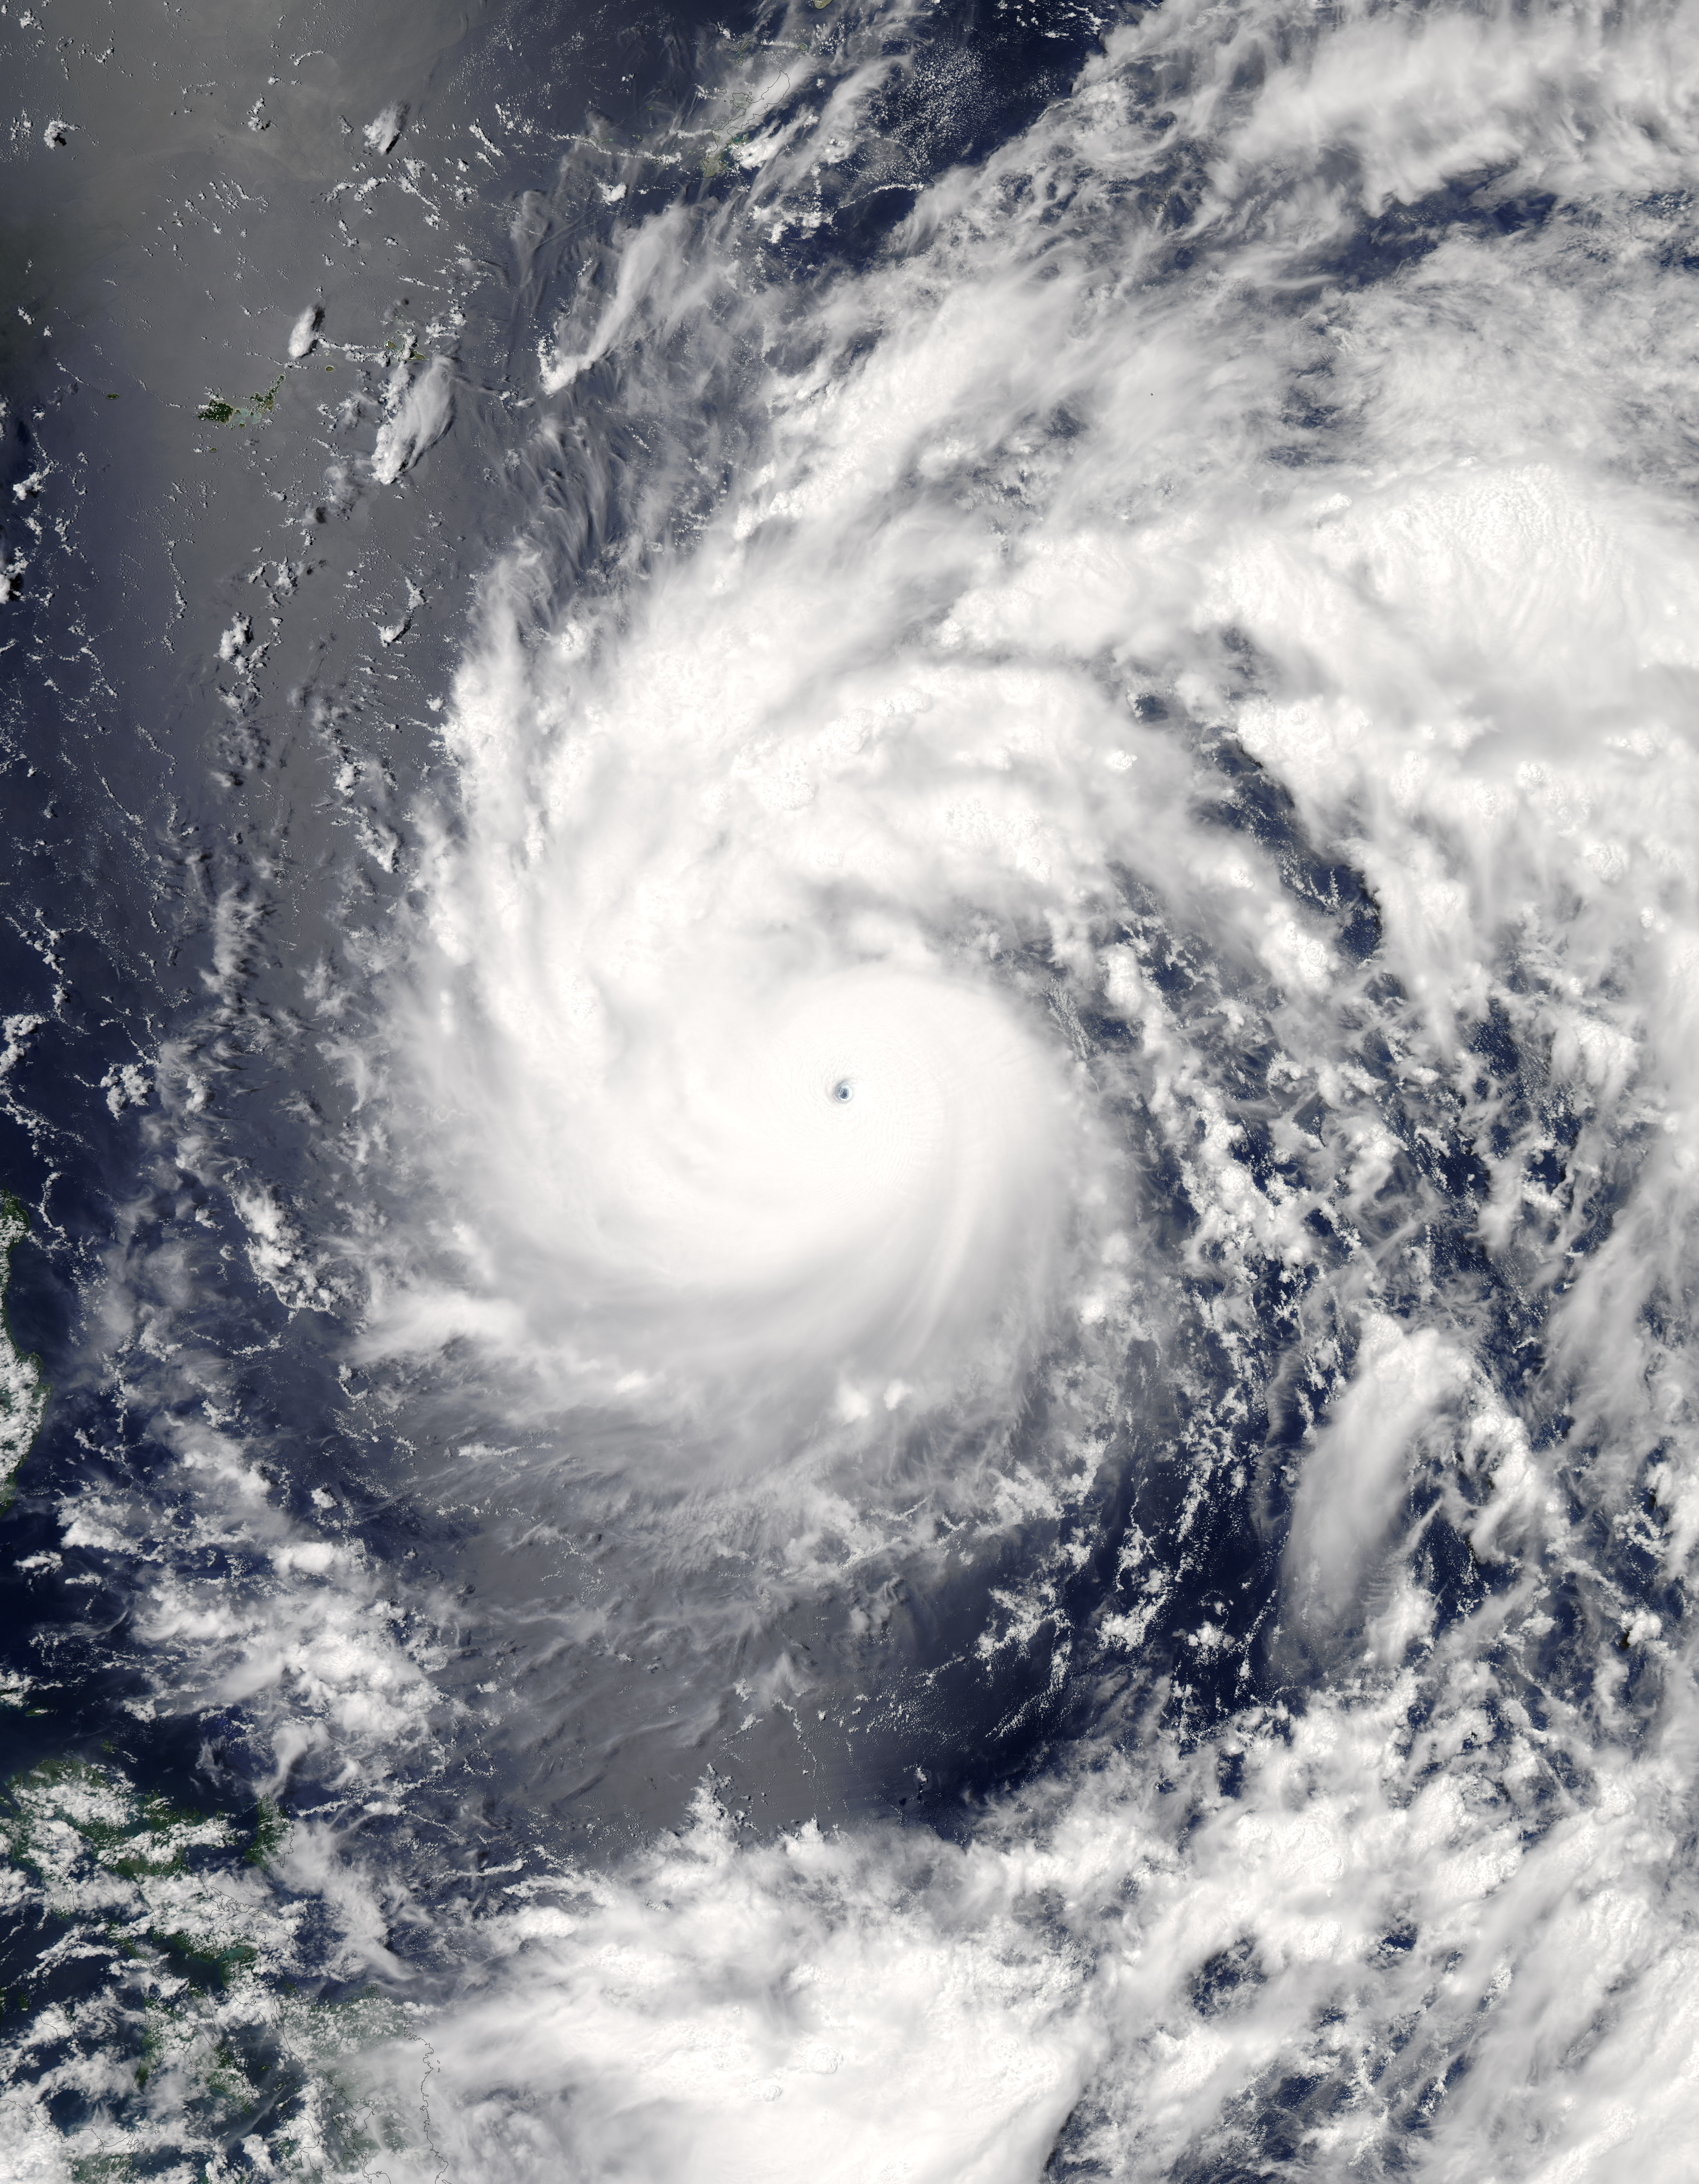
In early July 2016, storm clouds churned above the western Pacific Ocean as a super typhoon swept toward Taiwan. Over the course of 48 hours on July 5 and 6, Nepartak intensified from a tropical storm to a category 5 typhoon, according to Unisys Weather.
The storm is predicted to make landfall on the island nation on July 7, before moving up the coast of southeastern China. The onslaught of wind and rain brought by Nepartak could cause the already swollen Liu River in China to inundate more neighborhoods. Recent flooding in the region devastated 11 provinces and left at least 128 people dead. Japan’s Ryukyu Islands are also bracing for the storm.
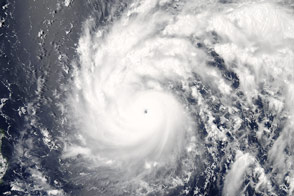
The Moderate Resolution Imaging Spectroradiometer (MODIS) on NASA’s Aqua satellite captured this natural-color image at 12:50 p.m. Taipei time (04:50 Universal Time) on July 6, 2016. The center of the cyclone was roughly 950 kilometers (590 miles) from Taiwan at the time. The Joint Typhoon Warning Center forecast that Nepartak could reach land with sustained winds of 135 knots (250 kilometers or 155 miles per hour).
Nepartak breaks a record-long storm-free streak for the western Pacific. The last named storm hit in December 2015, nearly 200 days ago, according to AccuWeather.
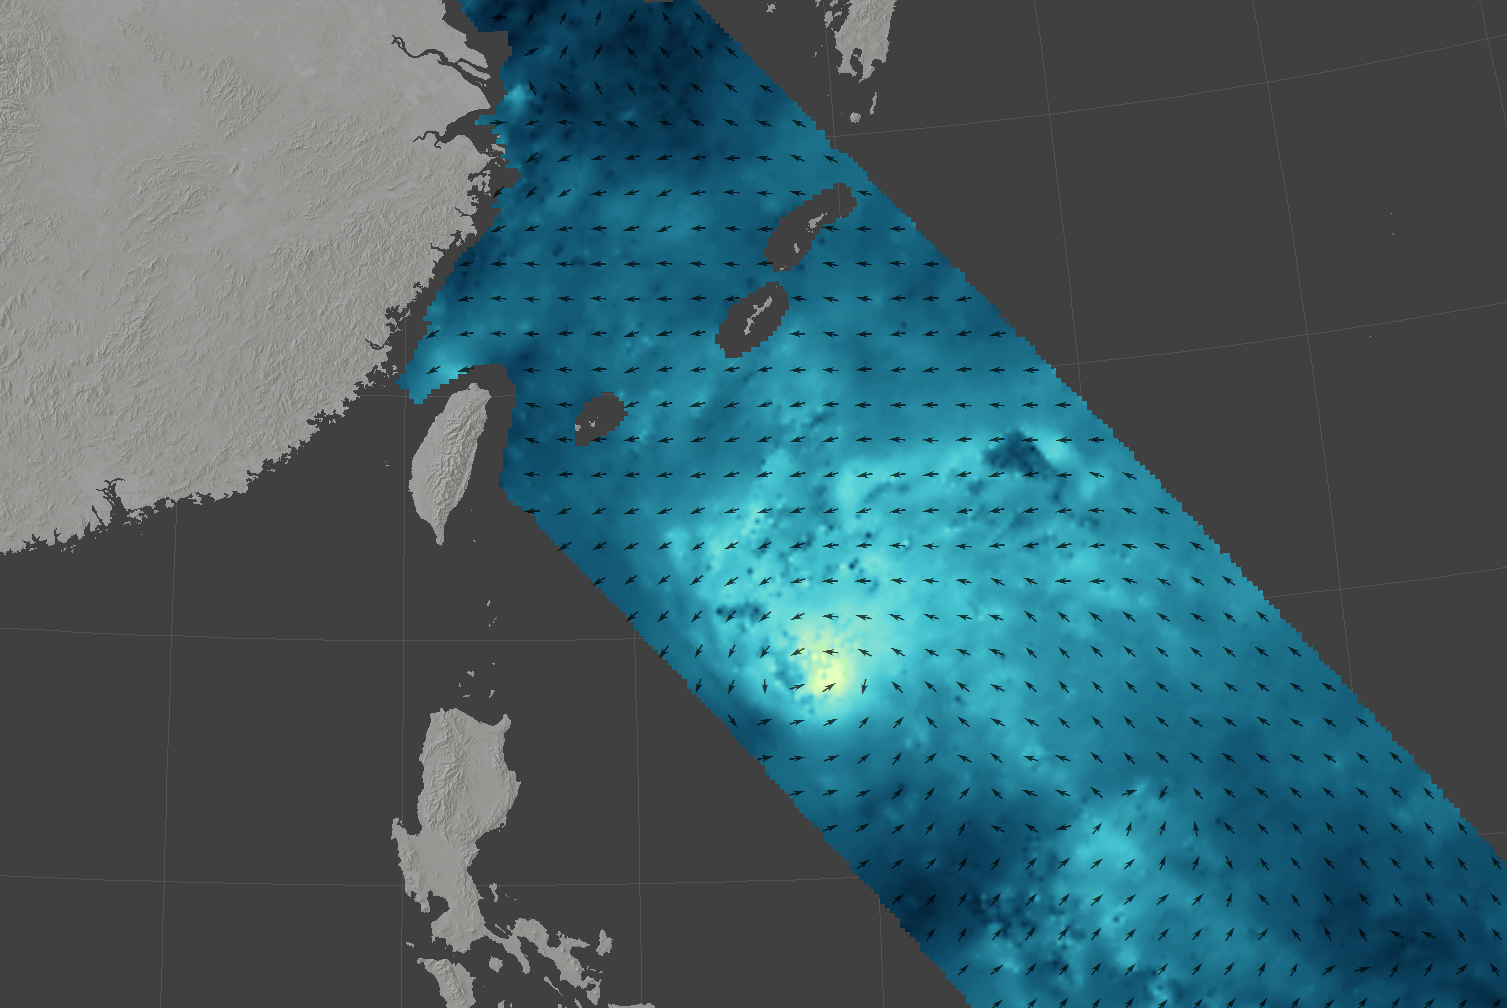
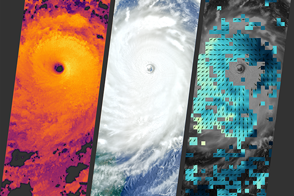
NASA’s International Space Station-Rapid Scatterometer (ISS-RapidScat) also observed the storm. The map above, based on RapidScat data acquired on July 6, shows winds near the sea surface tightening into a vortex. Near the center of the storm, winds approached 110 kilometers (68 miles) per hour just over the water’s surface. The instrument measures ocean surface wind speed and direction using microwave pulses that reflect off the ocean’s surface back into the sensor. The choppier the water, the stronger the corresponding signal. Arrows indicate the direction of the wind, based on the position of waves.
On July 6, Nepartak reached its expected peak intensity, with winds reaching 152 knots (282 kilometers or 175 miles an hour), The Weather Channel reported.
NASA image (top) by Jeff Schmaltz, LANCE/EOSDIS Rapid Response. NASA Earth Observatory map (bottom) by Joshua Stevens, using RapidScat data from the Jet Propulsion Laboratory. Caption by Pola Lem.


