
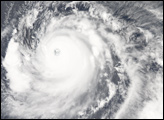
For remote sensing experts, getting a glimpse of the eye of a hurricane or typhoon with CloudSat is like a golfer hitting a hole in one. Consider: the cloud-penetrating radar on CloudSat has a field of view of just 1.4 square kilometers (0.5 square miles), but Earth’s total surface area is 519 million square kilometers (197 million square miles). Most tropical cyclones are well over 400 kilometers (250 miles) wide.
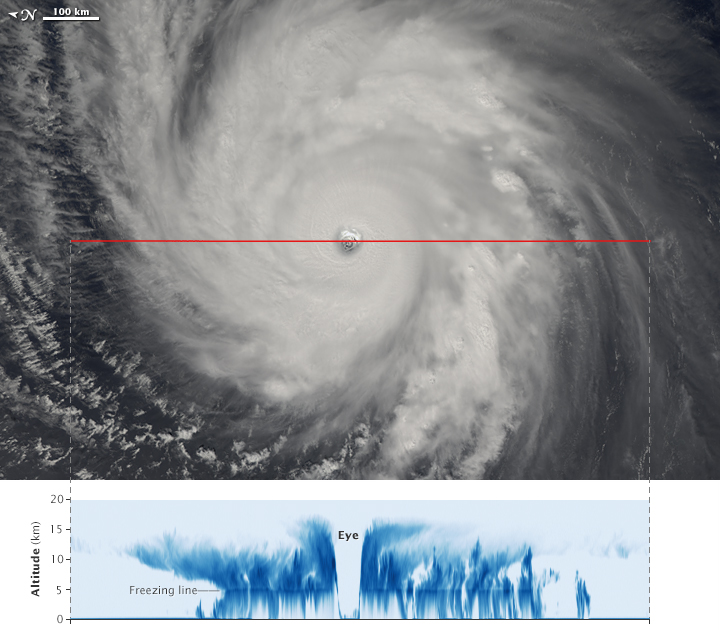
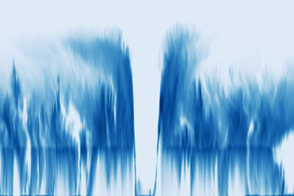
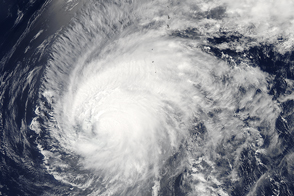
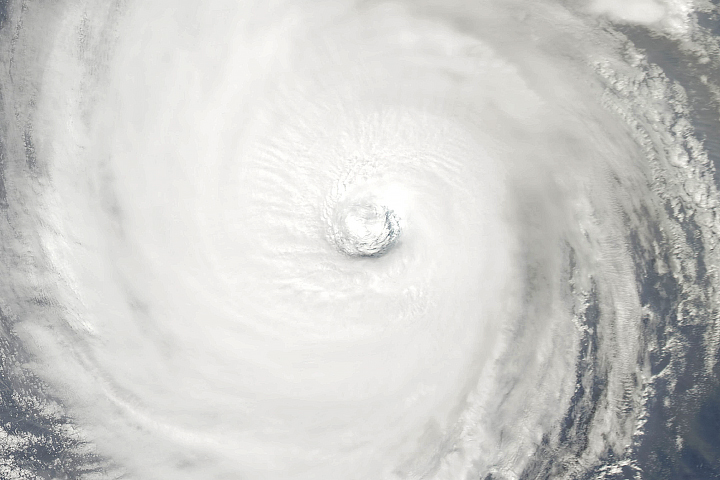
Yet a perfect eye overpass is exactly what researchers got on May 16, 2015. At 2:07 p.m. local time (04:07 Universal Time), the satellite passed over the eye of Typhoon Dolphin as the category 4 storm churned over the Pacific Ocean. The second image shows a cross-section—what the storm would look like if it had been sliced near the middle and viewed from the side. The top image, acquired the same day by the Moderate Resolution Imaging Spectroradiometer on the Aqua satellite, is shown for reference. The red line is the north-to-south track that CloudSat took over the storm. Note that the storm image has been rotated.
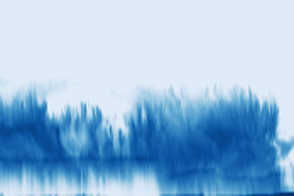
In the CloudSat data, the darkest blues represent areas where clouds and raindrops reflected the strongest signal back to the satellite radar. These areas had the heaviest precipitation and the largest water droplets. The blue horizontal line across the data is the freezing line; ice particles formed above it, raindrops below it.
CloudSat passed directly over the eye, allowing a view of the outward sloping eyewall, the intense convection and rainfall, and the storm’s cloud structure. Typhoon Dolphin’s clouds reached about 15 kilometers (9 miles) altitude at their highest point—fairly high for a tropical cyclone.
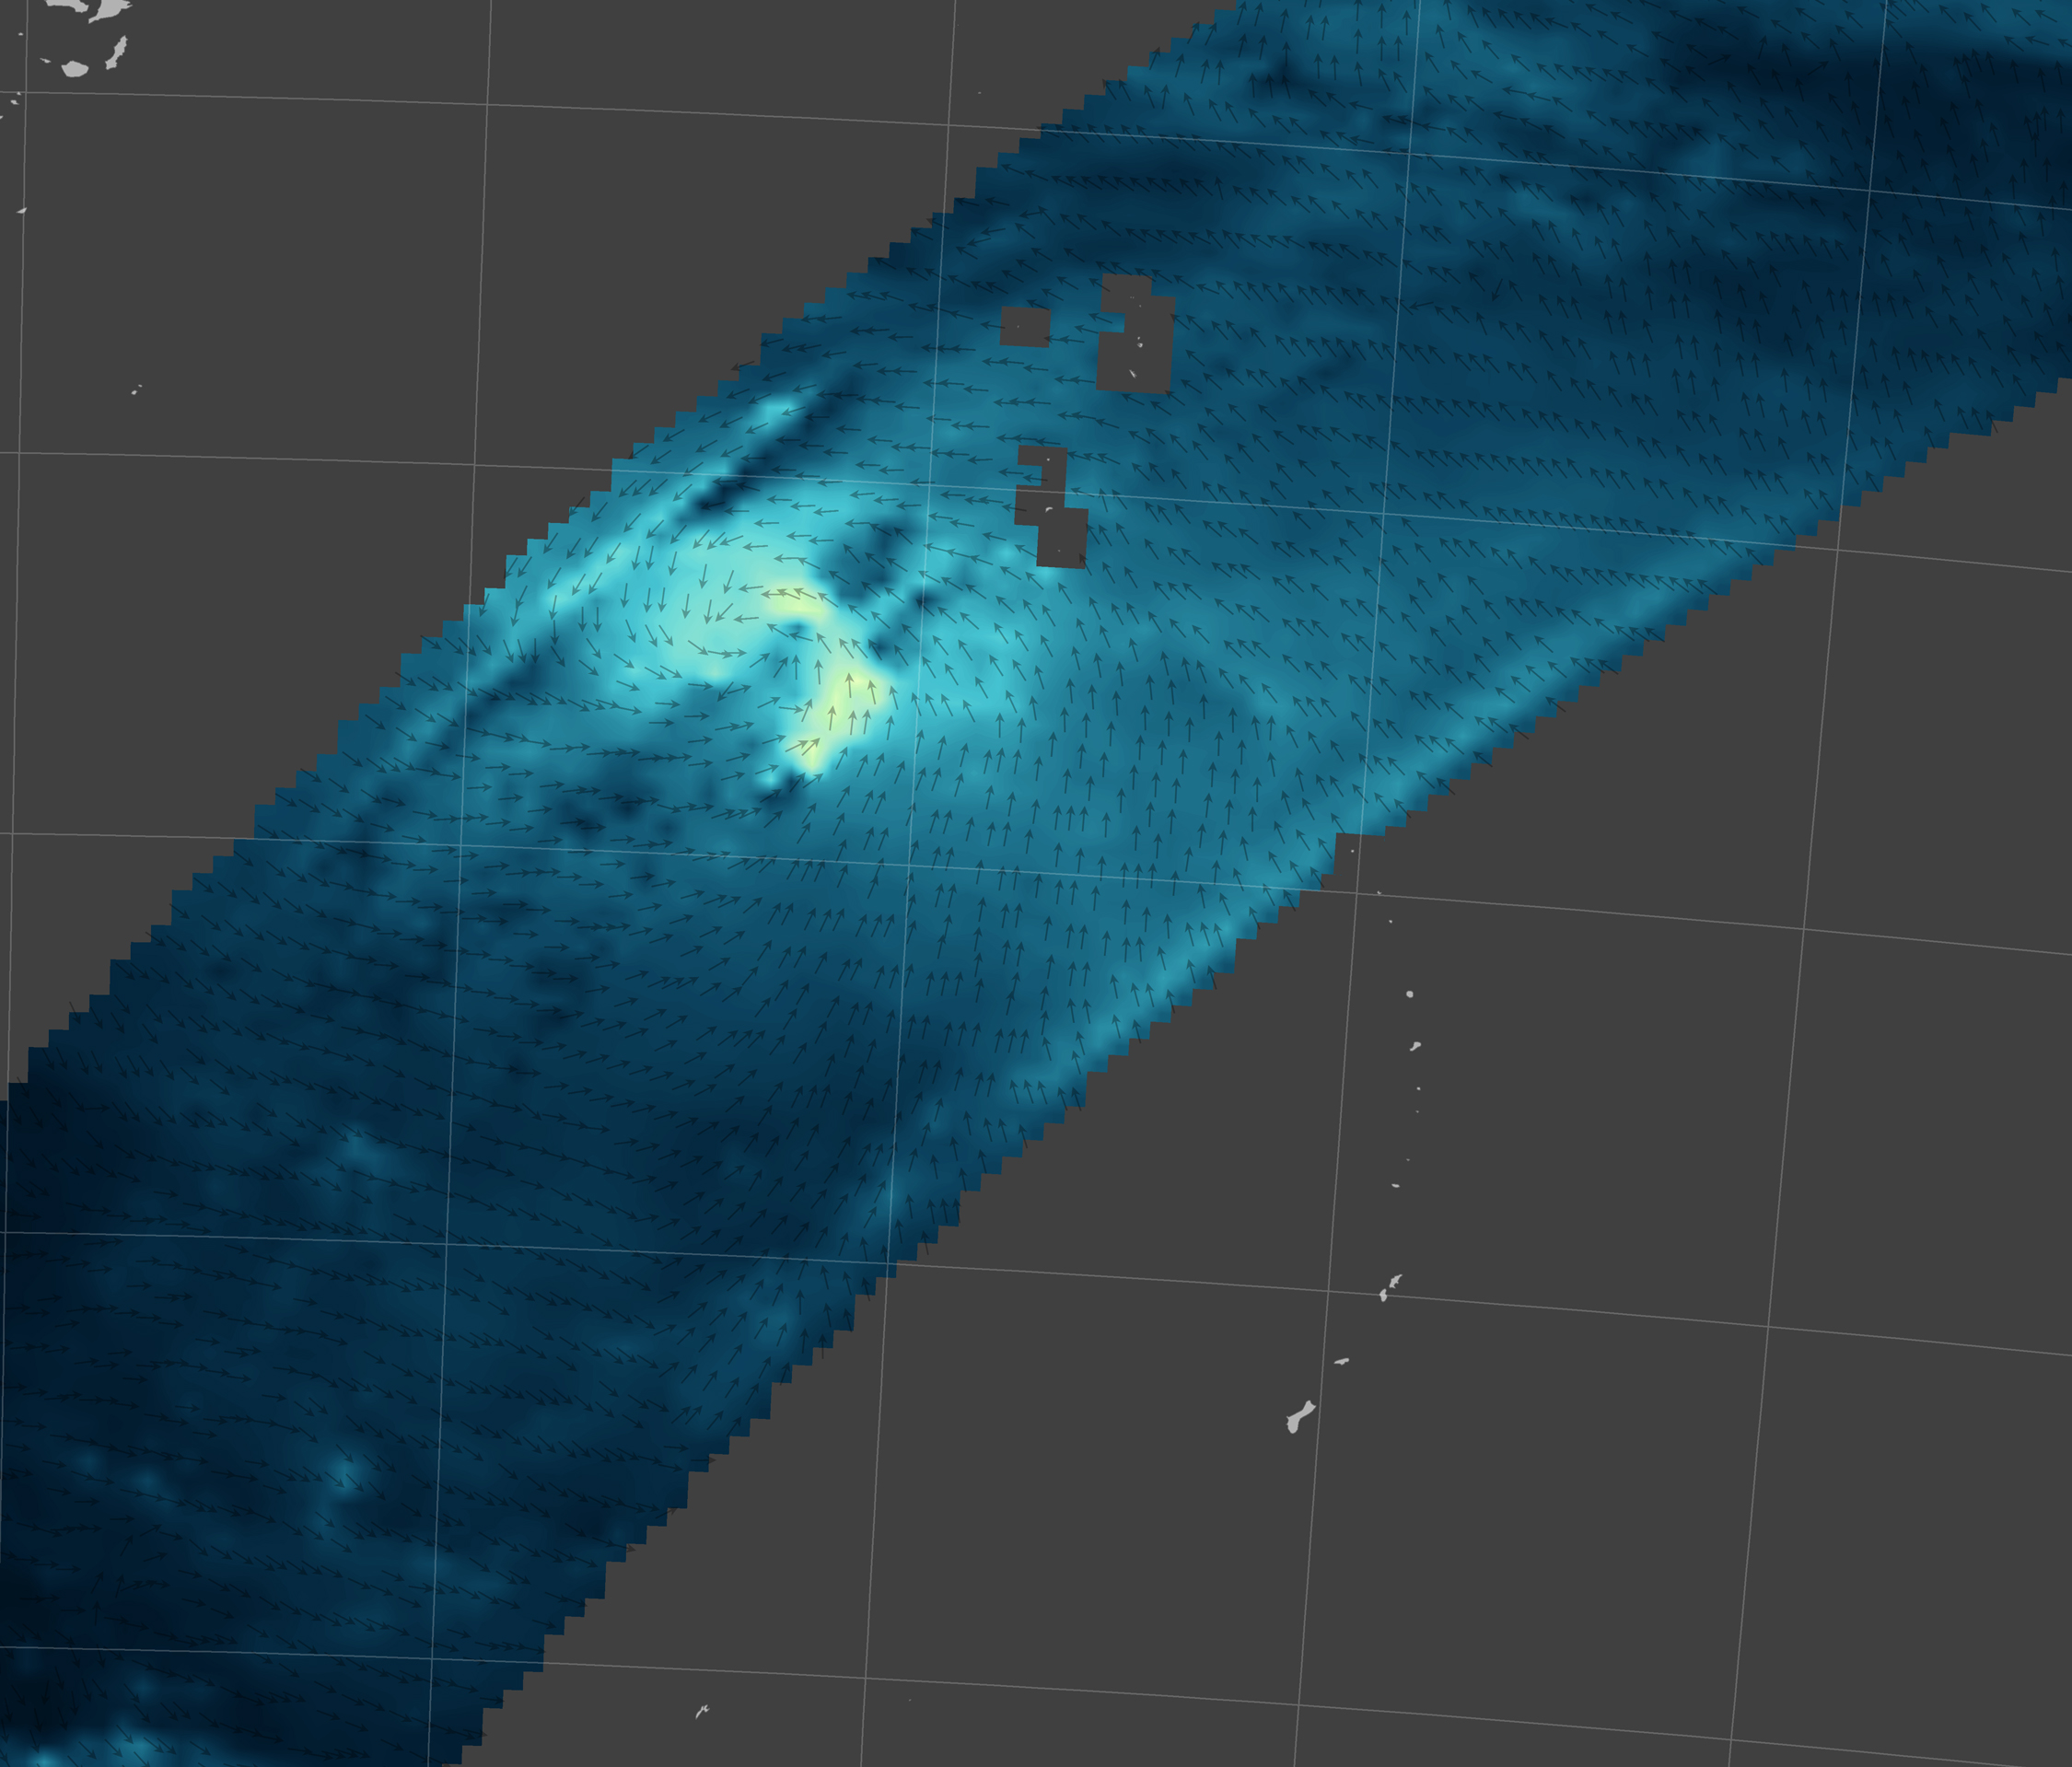
Meanwhile, a different NASA sensor was collecting another unique view of the storm. RapidScat, a scatterometer attached to the International Space Station, sends radar pulses toward the surface of the ocean. Observing how these pulses bounce off the water reveals sea surface “roughness,” which scientists can use to determine the surface wind speed and direction.
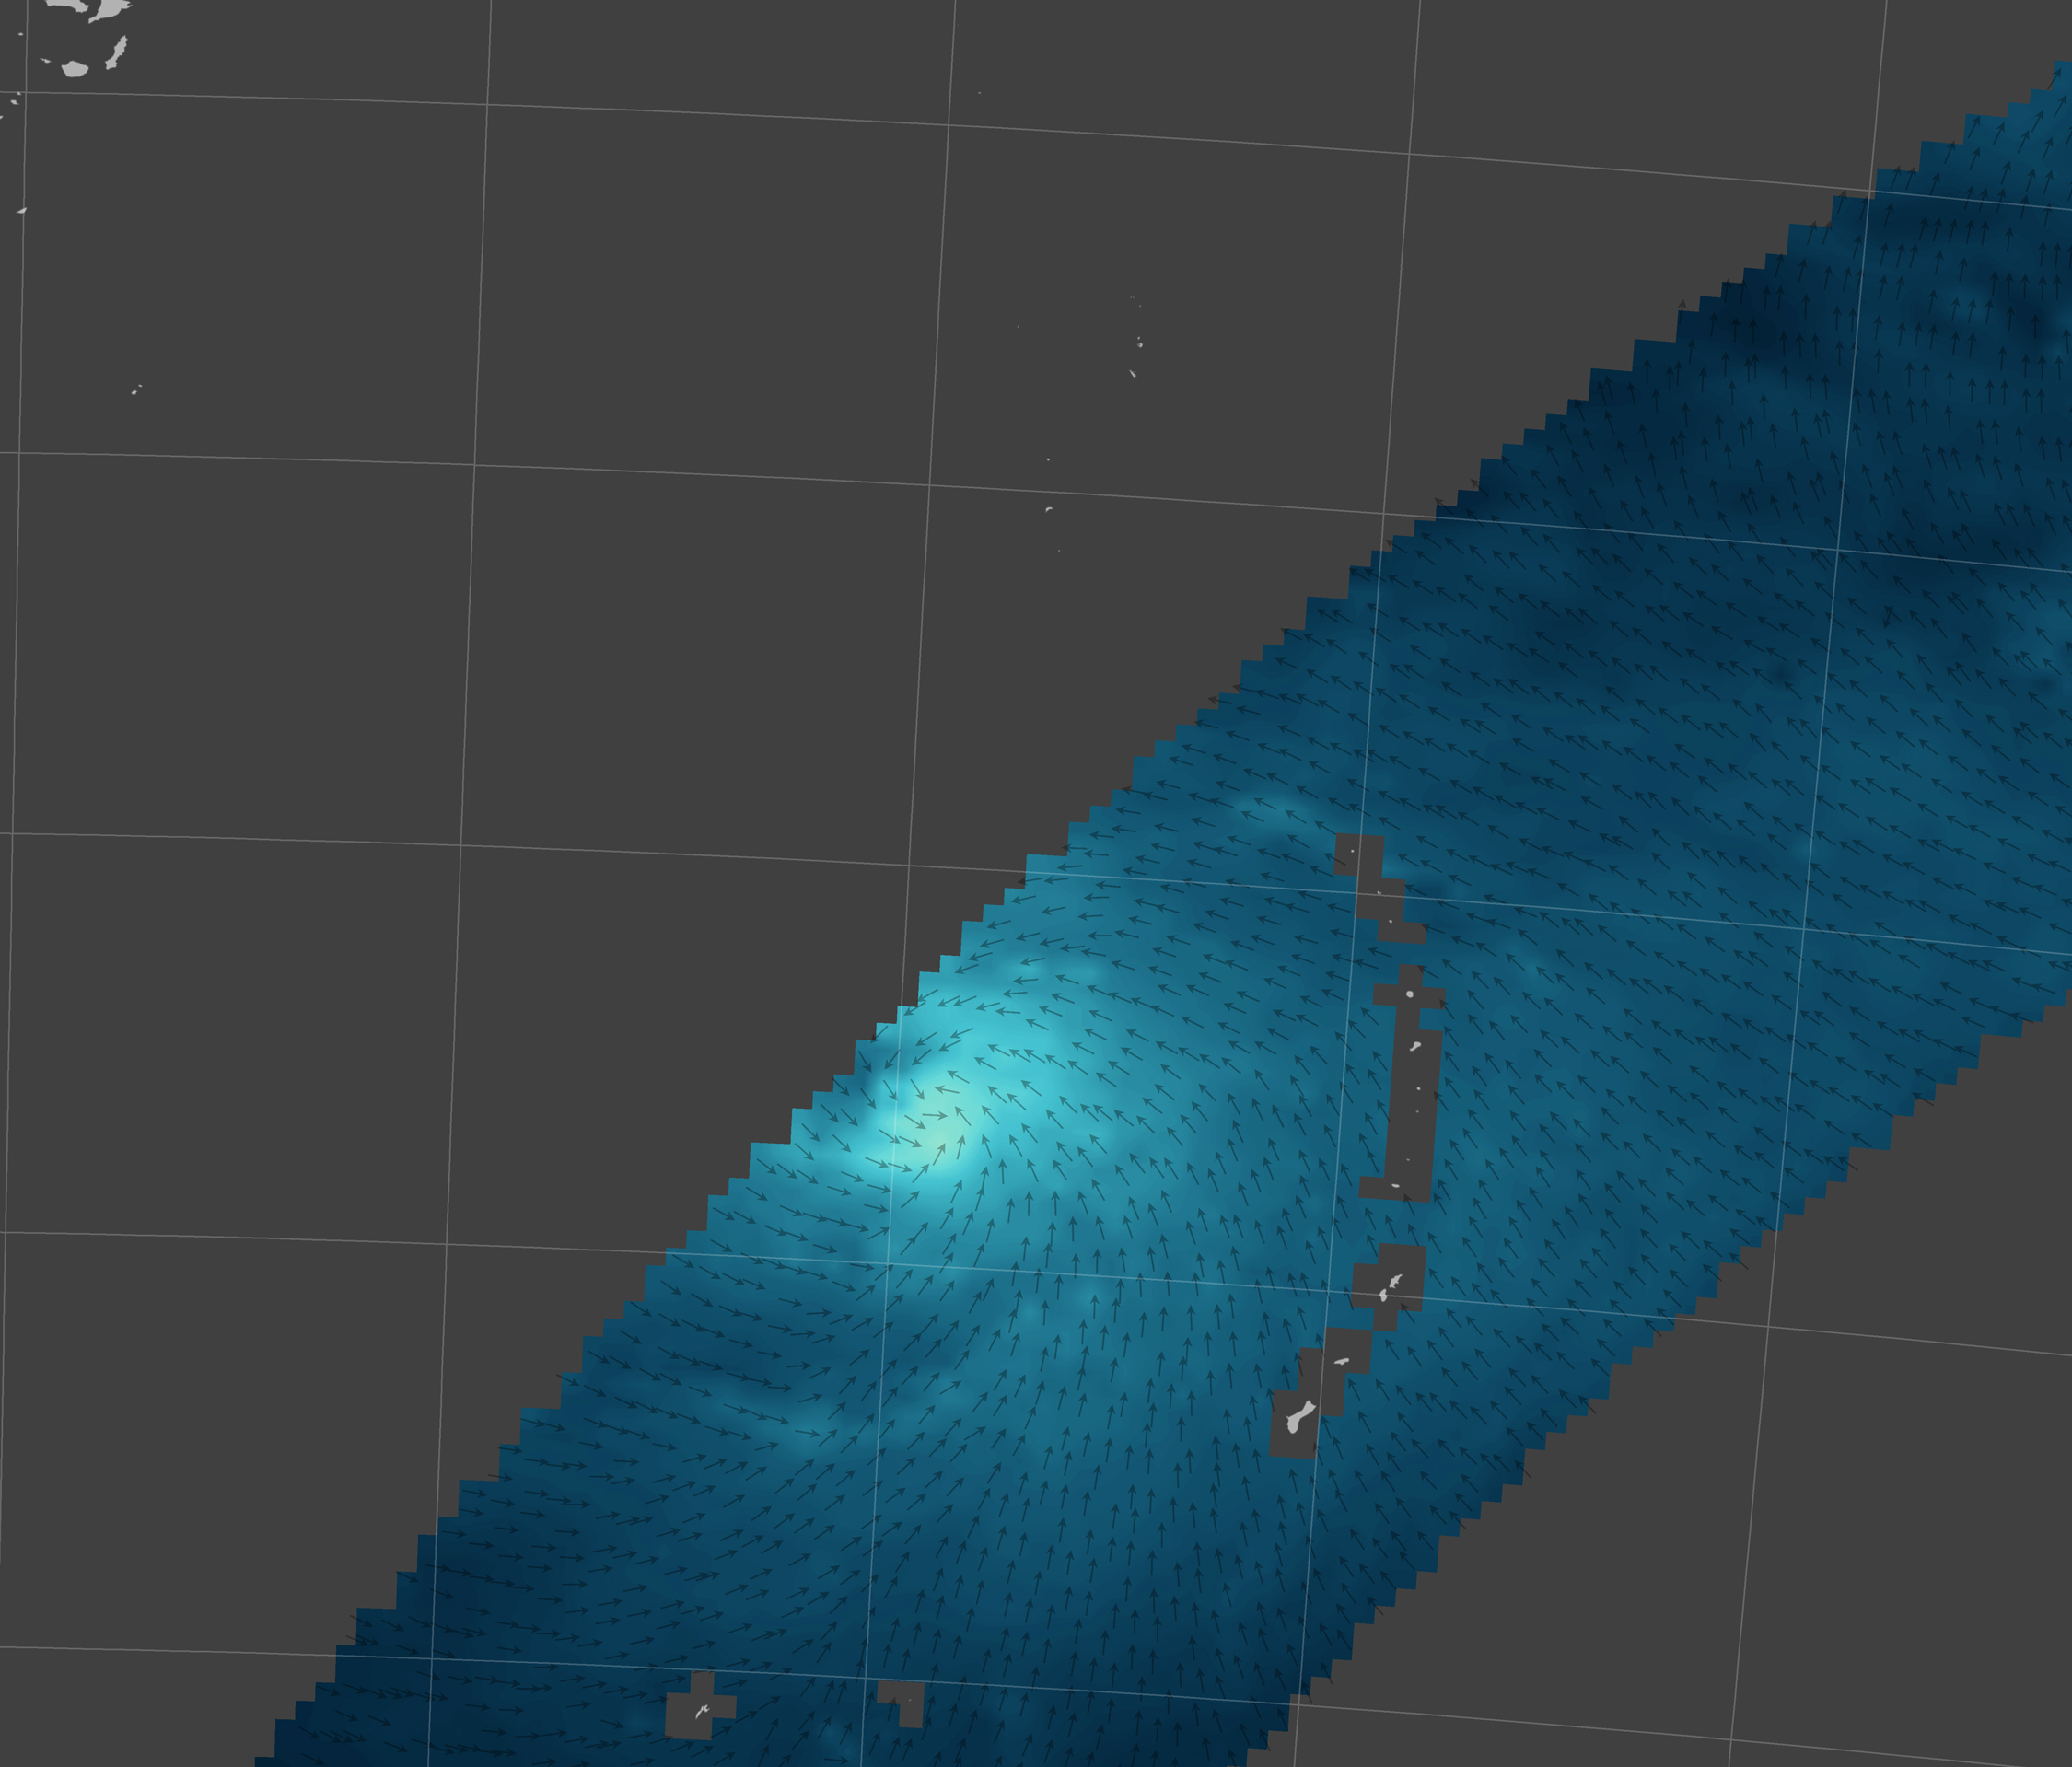
In this case, RapidScat acquired data on two dates. On May 16, the strongest winds of Typhoon Dolphin were south and east of the center of circulation, with sustained wind speeds near 120 kilometers (70 miles) per hour. By May 18, maximum sustained winds were 170 kilometers (110 miles) per hour in the northern and eastern quadrants of the storm.
Both CloudSat and RapidScat offer unique information about tropical cyclones that are used to better understand the destructive storms. “The wind data is available to both forecasters and scientists. RapidScat data are used to support real-time weather prediction and to improve the models scientists use to predict both short-term weather and long-term climate trends,” said Bryan Stiles, the lead for RapidScat’s science data processing at NASA’s Jet Propulsion Laboratory. “RapidScat data are now used by meteorological agencies around the world, including the U.S. Navy, the National Oceanographic and Atmospheric Administration, and the European Organization for the Exploitation of Meteorological Satellites, among others.”
In CloudSat’s case, scientists are creating a database of overpasses in order to better understand the anatomy and behavior of tropical storms. Natalie Tourville, a research meteorologist at Colorado State University, noted: “CloudSat is providing exceptional views of the internal structure of tropical cyclones, with more than 30 eye overpasses globally. We’ve been able to sample eyewall slope and view the vertical details of the convective core regions. This includes where and how large these cores are and how high the cloud tops are. We’ve also sampled overshooting cloud tops—some extend over 17 kilometers into the atmosphere—and provided detailed analysis of exactly what is underneath the cirrus clouds of these storm systems.”
Scientists have also developed an innovative technique that uses Cloudsat measurements, in conjunction with other satellites, to estimate storm intensity—something that has proven challenging to do from space. A team of researchers first described the technique in an article published in IEEE Geoscience and Remote Sensing Letters in 2008. Tourville is currently working on a follow-up that aims to improve the technique by using more recent CloudSat data.
NASA Earth Observatory image (top) by Jesse Allen, using CloudSat data provided courtesy of the CloudSat team at Colorado State University. NASA Earth Observatory maps (bottom) by Joshua Stevens, using RapidScat data from the Jet Propulsion Laboratory. Caption by Adam Voiland.


