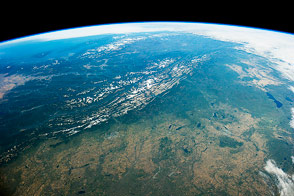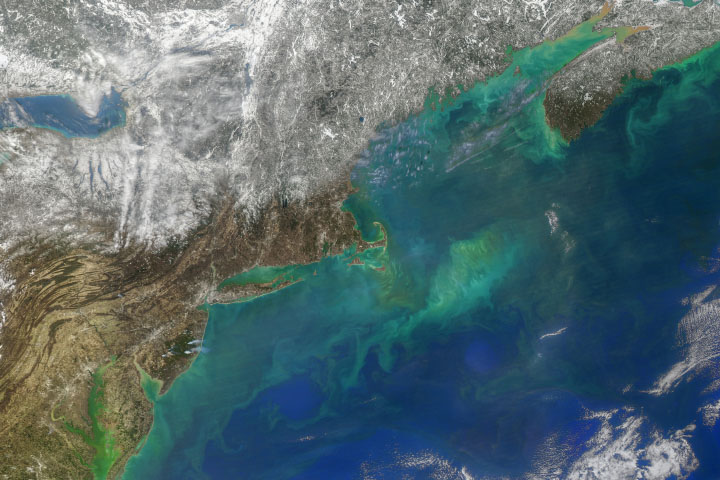

Over the past 50 years, satellites orbiting Earth have unveiled a remarkably dynamic planet. Polar ice advances and retreats, storm systems come and go, and surface currents meander across the oceans. It turns out that even the pulse of life shows up.
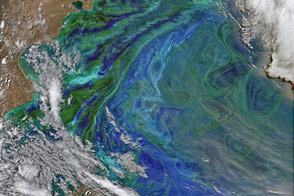
Primary producers—plant life and ocean phytoplankton—play an integral part of the Earth system; some would say that they drive the entire biosphere. Plants and plankton influence the composition of the atmosphere, play a part in the water cycle, and regulate ocean chemistry. They also provide the food for nearly all other life on the planet. And as the above images illustrate, Earth's biosphere is anything but static. Plant growth on land fluctuates with the seasons; so does the blooming of phytoplankton—tiny plant-like organisms in the oceans.
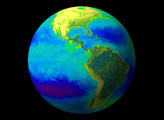
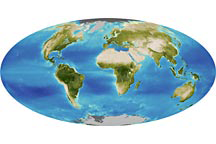
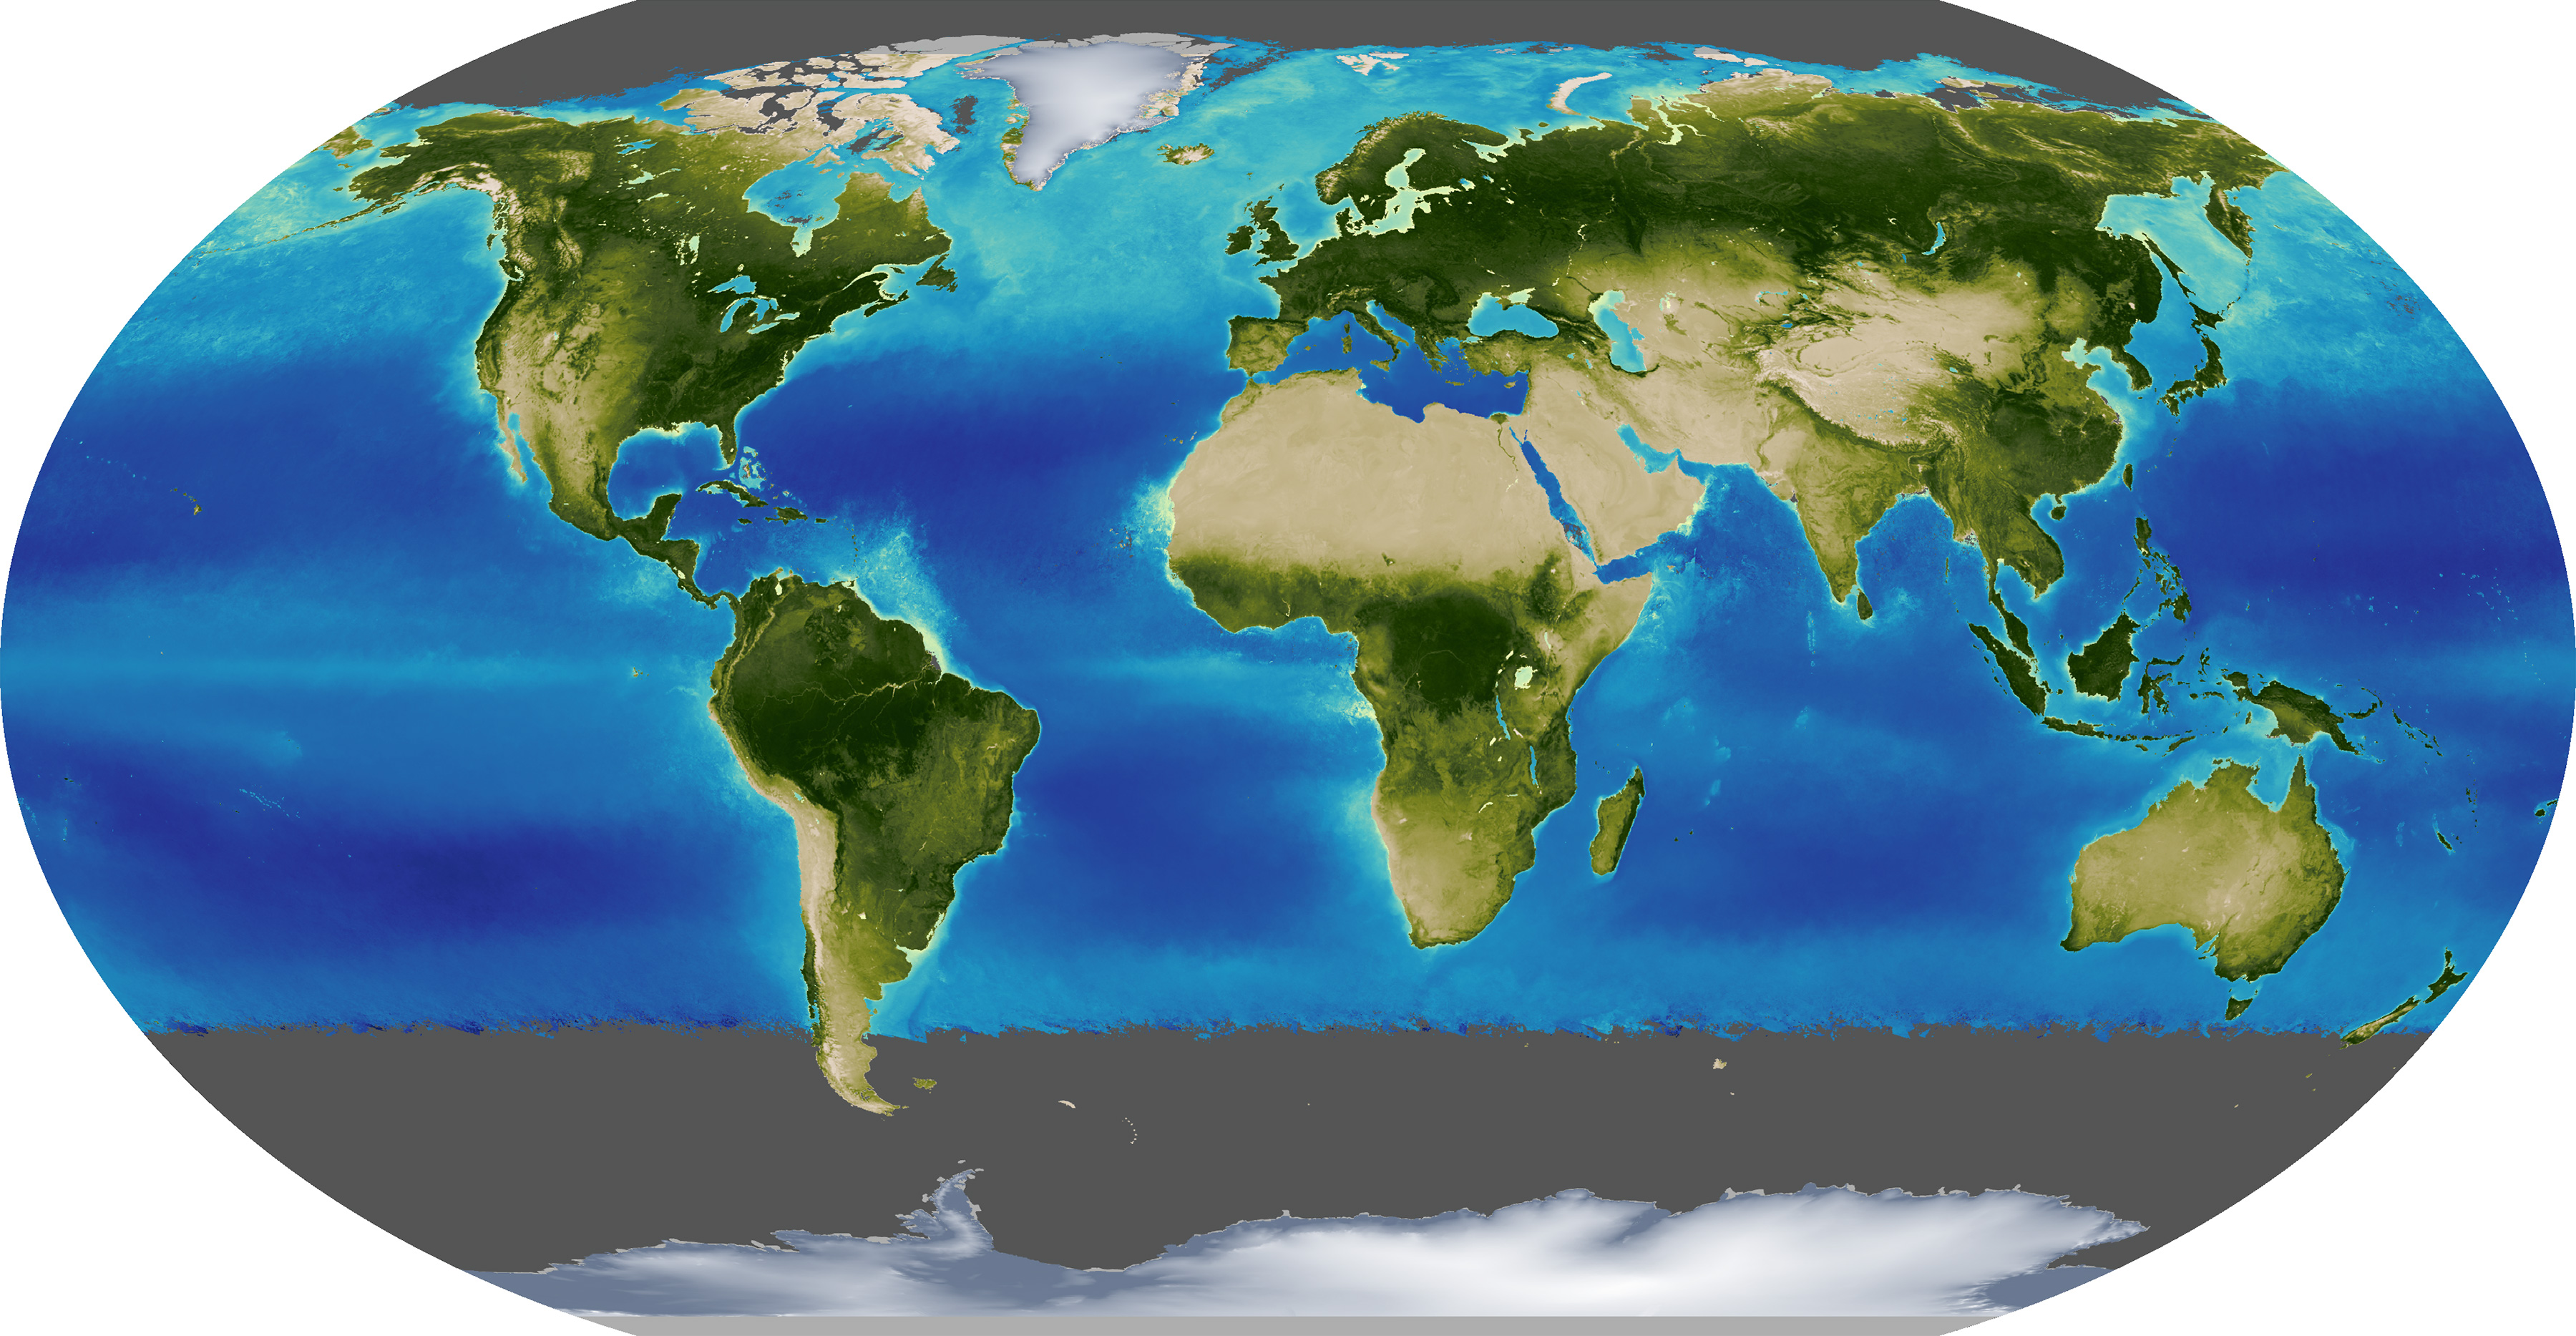
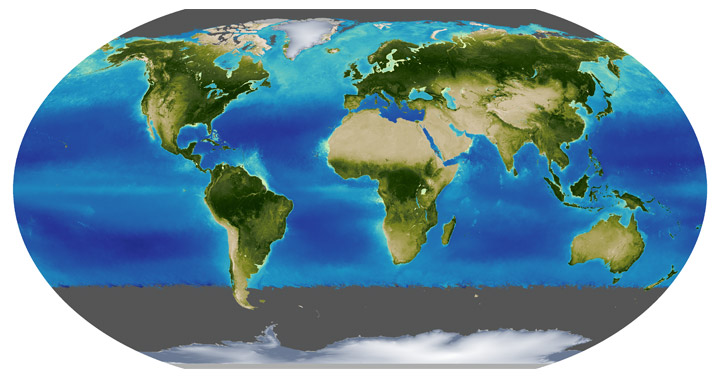
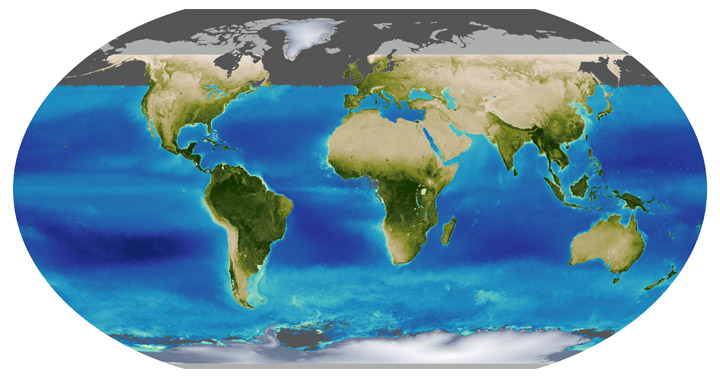
In both images, land areas with a robust vegetation index appear deep green, indicating greater plant growth. Waters with high chlorophyll concentrations appear light blue to yellow, indicating the abundance of phytoplankton. Both the vegetation index and chlorophyll concentration were calculated using data from the Moderate Resolution Imaging Spectroradiometer (MODIS) on NASA’s Terra satellite. Grey indicates areas where no data were collected during dark months of the year around the poles.
If you take the average of these data over the course of a year, the seasonal patterns are erased. But average them by month, as these images show, and certain attributes of the biosphere begin to emerge.
The top image is an average of data collected in June every year between 2000–2014. By this time of year, the intense summer growing season in the Northern Hemisphere has spread to high latitudes. A wave of phytoplankton growth in the North Atlantic also stands out.
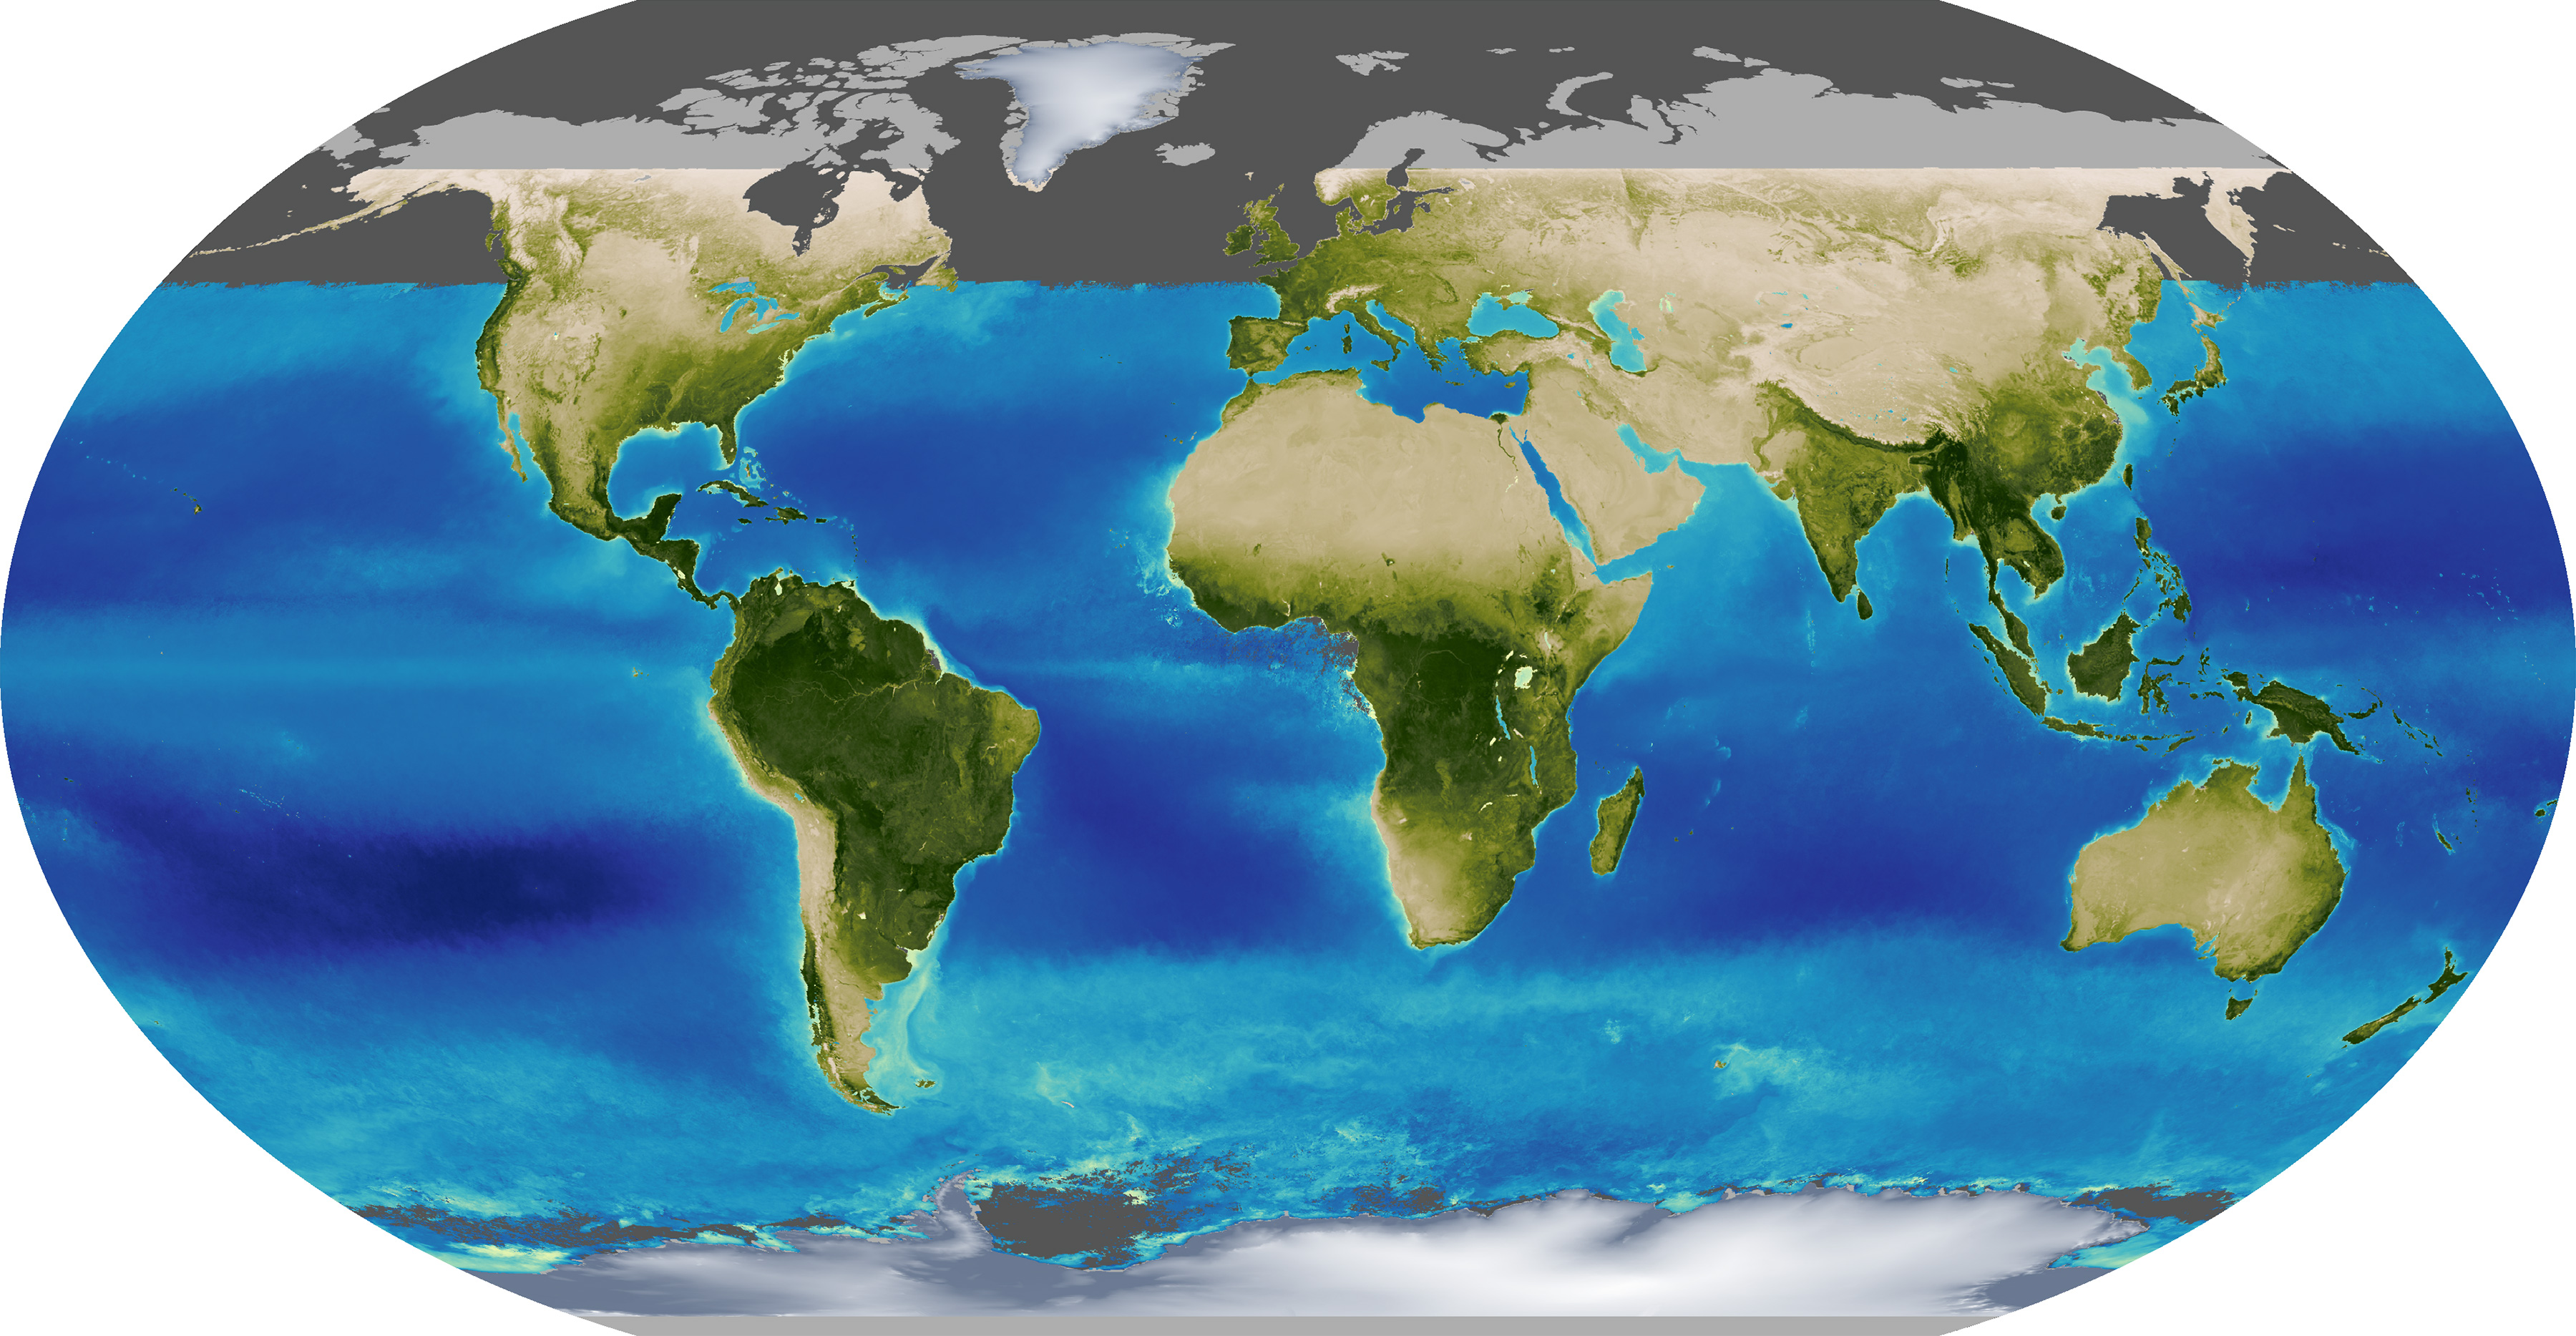
In contrast, the second image averages data collected in December every year between 2000–2013. In the Northern Hemisphere, fewer land plants are growing and many are decaying. But life pulses southward, apparent in features such as phytoplankton blooms off the coast of Patagonia. There are some changes in South America, Africa, and Australia, but they are less pronounced than summer in the North.
Both images show that phytoplankton and land plants are relatively consistent near the equator, where nutrients, temperatures, rainfall, and sunlight are fairly consistent throughout the year.
Turn on the image comparison tool to see how vegetation and chlorophyll change between June and December. Then, watch the video below to see the changes throughout the entire year. The data that make up these images not only provide an engaging way to look at life on Earth; scientists use them to gain valuable insight into the carbon cycle.
NASA Earth Observatory image by Kevin Ward, using data provided by the Ocean Color Web and MODIS Land Science Team. Caption by Kathryn Hansen.