On February 11, 2013, the Landsat 8 satellite rocketed into a sunny California morning onboard a powerful Atlas V and began its life in orbit. In the year since launch, scientists have been working to understand the information the satellite has been sending back. Some have been calibrating the data—checking it against ground observations and matching it to the rest of the 42-year-long Landsat record. At the same time, the broader science community has been learning to use the new data.
The map above—one of the first views of the United States from Landsat 8—is an example of how scientists are testing Landsat 8 data. David Roy, a co-leader of the USGS-NASA Landsat science team and researcher at South Dakota State University, made the map with observations taken during August 2013 by the satellite’s Operational Land Imager.
There are many ways to produce a composite map. Roy’s team breaks each Landsat scene into its smallest component, the picture element or “pixel.” For Landsat, every full-color pixel corresponds to a 30 by 30 meter area, a chunk of land about the size of a baseball diamond. Those pixels are accurately matched to a map, or “geolocated.” Using a computer algorithm, all 11 billion pixels in the contiguous United States (most of the lower 48; a small section of Maine is missing) are examined to identify the most cloud-free pixels. The best pixels are assembled into a single, composite image so that a pixel acquired on the first of the month might be next to one acquired a few weeks later. (To make the map manageable, the image is reduced so that it has a resolution of 300 meters per pixel.)
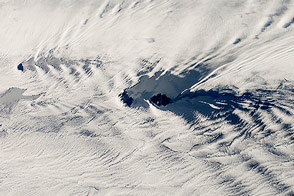
The strips in the image above are a result of the way Landsat 8 operates. Like its predecessors, Landsat 8 collects data in 185-kilometer (115-mile) wide strips called swaths or paths. Each orbit follows a predetermined ground track so that the same path is imaged each time an orbit is repeated. It takes 233 paths and 16 days to cover all of the land on Earth. This means that every land surface has the potential to be imaged once every 16 days, giving Roy two or three opportunities to get a cloud-free view of each pixel in the United States in a month. (Some northern latitudes are imaged in more than one path.)
Roy’s team makes the composite maps as part of a project called Web-Enabled Landsat Data (WELD), which is being developed to give scientists an easy way to preview the most cloud-free data acquired during a month before downloading and processing large volumes. The Landsat 8 maps are experimental, but Roy has previously distributed annual, seasonal, monthly, and weekly composite images based on Landsat 5 and 7 data.
Working with the new satellite is taking some adjustment. First, the data files are twice as large as those from previous Landsats because Landsat 8 collects more precise data and includes observations from two new spectral bands. The result is images that are crisper and colors that do not saturate. The lack of saturation makes it easier to distinguish clouds during the compositing process. Another feature that makes cloud detection easier is a new spectral band designed to identify high, wispy cirrus clouds.
Making composite maps with Landsat 8 is also simpler because each data pixel is more accurately mapped to a specific point on the ground. This improved geolocation is possible because Landsat 8 has fewer moving parts than previous Landsat satellites (making it more stable) and because it carries a fully functioning GPS device. Landsat 8’s geolocation is so accurate that scientists are starting to use it to retroactively improve Landsat 5 and 7 geolocation data. Accurate geolocation improves mapping and the ability to compare data from other sources.
Beyond the improvements, the Landsat 8’s greatest value is that it continues the decades-long Landsat record. The new composite maps are a step towards making that ongoing record more accessible to a wide range of people. “I want to make it easy for anyone to get all of the Landsat data for one place,” says Roy.
To see some of our favorite images from the first year of Landsat 8, visit our new gallery. The U.S. Geological Survey has also posted a collection of new images here. The video below shows how Landsat acquires data in swaths.
Image courtesy David Roy, USGS-NASA WELD product. Caption by Holli Riebeek.