After cooling the eastern tropical Pacific for the second winter in a row—and teaming with other large-scale weather patterns to wreak havoc on North American winter—La Niña ended in April 2012. Researchers from the Climate Prediction Center of the U.S. National Weather Service reported on May 3 that the Pacific has transitioned to “neutral conditions, which are expected to continue through northern summer 2012.”
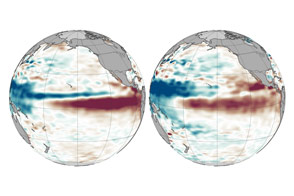
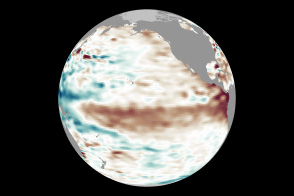
La Niña and El Niño are alternating patterns of ocean and atmospheric circulation that have a distinct impact on weather around the Pacific basin. La Niña brings cooler waters and stronger trade winds to the tropical Pacific, boosting precipitation in western Pacific nations like Australia and Indonesia and drying out southern North America. The pattern can alter the path of the jet stream and other atmospheric phenomena.The images above depict sea surface height (SSH) anomalies for the Pacific Ocean in January and April 2012, as observed by the radar altimeter on the OSTM/Jason-2 satellite. Shades of blue show regions where the sea surface height is lower than the average, while reds show heights that are above average. The animation linked below the image shows the see-saw pattern of sea surface heights over the past four years.
Over yearly scales, the height of the ocean surface is driven by the temperature of the water—warmer water expands to a greater volume than cooler water—and by winds. (Click here to see a map of sea surface temperatures for roughly the same period as the images above.)
“Sea surface temperatures (SST) show the surface manifestation of La Niña and El Niño; this is what the atmosphere ‘feels,’” says Bill Patzert of NASA’s Jet Propulsion Laboratory. “Sea surface height shows how much heat has been redistributed in the equatorial Pacific. These are very complementary. SST shows what the atmosphere is responding to, while SSH shows how intense the event is.”
NASA Earth Observatory image by Jesse Allen and Kevin Ward, using JASON-2 data provided by Akiko Hayashi, NASA/JPL Ocean Topography Team. Caption by Michael Carlowicz.